Australia Additive Manufacturing (AM) Market by Technology (Stereolithography, Fused Deposition Modeling, Selective Laser Sintering, Direct Metal Laser Sintering, Polyjet Printing, Inkjet Printing, Electron Beam Melting, Laser Metal Deposition, Digital Light Processing, Laminated Object Manufacturing, and Others) by Printer Type (Desktop 3D Printer and Industrial 3D Printer) by Material (Polymer, Metal, and Ceramic) by Application (Prototyping, Tooling, and Functional Parts) by Component (Hardware, Software, and Services) and by End-User (Industrial Additive Manufacturing and Desktop Additive Manufacturing) – Opportunity Analysis and Industry Forecast 2023–2030
Industry: Semiconductor & Electronics | Publish Date: 27-Jul-2023 | No of Pages: 77 | No. of Tables: 62 | No. of Figures: 29 | Format: PDF | Report Code : N/A


 Speak to Our Analyst
Market Definition
Australia Additive Manufacturing (AM) Market was valued at USD 75.15 million in 2022, and is predicted to reach USD 403.11 million by 2030, with a CAGR of 23.3% from 2023 to 2030. Additive manufacturing, commonly known as 3D printing, is a manufacturing technology that involves layering materials to construct objects. This process is controlled by a computer, which uses data from CAD software or 3D object scanners to guide the machines in shaping the materials. In order to initiate the additive manufacturing process, a design is necessary, which can be created using CAD software or by scanning an existing product. The software then converts the design into a detailed blueprint that provides instructions to the 3D printer. Once the blueprint is transferred, the production of the object begins. The time required to complete the additive manufacturing process varies depending on the size of the object, with smaller items typically being produced more quickly and efficiently.
Customization and Personalization in Additive Manufacturing Driving Growth in Australia
Additive manufacturing allows for the production of highly customized and personalized products. This capability is particularly valuable in sectors such as healthcare, where patient-specific medical devices and implants can be produced. The ability to tailor products to individual needs is driving the growth of additive manufacturing in Australia.
Sustainability and Waste Reduction Propelling Additive Manufacturing Growth in Australia
Additive manufacturing produces less waste compared to traditional manufacturing methods. By using only, the necessary materials to build an object, additive manufacturing helps minimize material waste and environmental impact. This aligns with Australia's focus on sustainability and waste reduction initiatives, which is driving the growth of additive manufacturing market.
Cost Restraints in Additive Manufacturing
The cost of additive manufacturing technologies, including printers, materials, and post-processing equipment is relatively high compared to traditional manufacturing methods. This cost factor may limit the accessibility and adoption of additive manufacturing, particularly for small and medium-sized businesses, which is expected to restrain the growth of the market.
Technological Advancements in Additive Manufacturing Market
Continuous advances in additive manufacturing technology, such as greater printer capabilities, improved materials, and more efficient post-processing procedures, have supported industry expansion. These developments allow for improved quality, faster production, and more application options, driving more sectors to adopt additive manufacturing. As a result, it is expected to create ample opportunities for the future.
Competitive Landscape
The additive manufacturing industry includes several market players such as Stratasys, Markforged Holding Corporation, Desktop Metal Inc., Velo3d, Inc., Formlabs Inc., Protolabs., Xometry Inc., Shapeway Holdings Inc., D Systems, General Electric. These market players are adopting various strategies such as product launches to maintain their dominance in the market of Australia.
For instance, in September 2022, Fleet Space unveiled its new 3D printer at the firm’s expanded manufacturing facility in Adelaide, Australia. The new technology boosts Fleet Space’s capabilities, which allows the manufacture and development of new products, paving the way for the company’s fully 3D-printed, Alpha satellite.
KEY BENEFITS
-
The Australia additive manufacturing market report provides a quantitative analysis of the current market and estimations through 2023-2030 that assists in identifying the prevailing market opportunities to capitalize on.
-
The study comprises a deep dive analysis of the market trend including the current and future trends for depicting the prevalent investment pockets in the market.
-
The information related to key drivers, restraints, and opportunities and their impact on the market is provided in the report.
-
The competitive analysis of the market players along with their market share in the Australia additive manufacturing market.
-
The SWOT analysis and Porter’s Five Forces model are elaborated in the study.
-
Value chain analysis in the market study provides a clear picture of the stakeholders’ roles.
AUSTRALIA ADDITIVE MANUFACTURING MARKET KEY SEGMENTS
By Technology
-
Stereolithography
-
Fused Deposition Modeling
-
Selective Laser Sintering
-
Direct Metal Laser Sintering
-
Polyjet Printing
-
Inkjet Printing
-
Electron Beam Melting
-
Laser Metal Deposition
-
Digital Light Processing
-
Laminated Object Manufacturing
-
Others
By Printing Type
-
Desktop 3D Printer
-
Industrial 3D Printer
By Material
-
Polymer
-
Metal
-
Ceramic
By Application
-
Prototyping
-
Tooling
-
Functional Parts
By Component
-
Hardware
-
Software
-
Design Software
-
Inspection Software
-
Printer Software
-
Scanning Software
-
-
Services
By End-User
-
Industrial Additive Manufacturing
-
Automotive
-
Aerospace and Defense
-
Healthcare
-
Consumer Electronics
-
Power and Energy
-
Others
-
-
Desktop Additive Manufacturing
-
Educational Purpose
-
Fashion and Jewelry
-
Objects
-
Dental
-
Food
-
Others
-
KEY PLAYERS
-
Stratasys
-
Markforged Holding Corporation
-
Desktop Metal Inc.
-
Velo3d, Inc.
-
Formlabs Inc.
-
Protolabs.
-
Xometry Inc.
-
Shapeway Holdings Inc.
-
D Systems
-
General Electric


At Next Move Strategy Consulting, we understand that insightful market research is the cornerstone of successful business decisions. That's why we employ a robust and multifaceted approach, combining various methodologies to deliver the most accurate and actionable data for our clients.
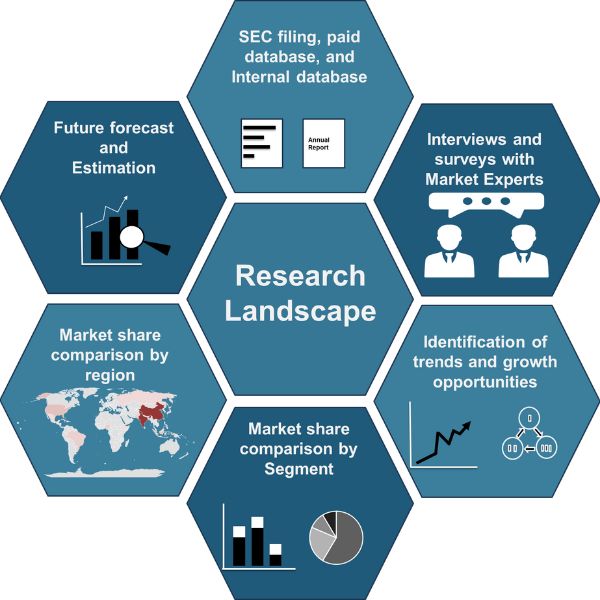
Research Landscape
We navigate the world of research with two primary approaches:
Qualitative Approach
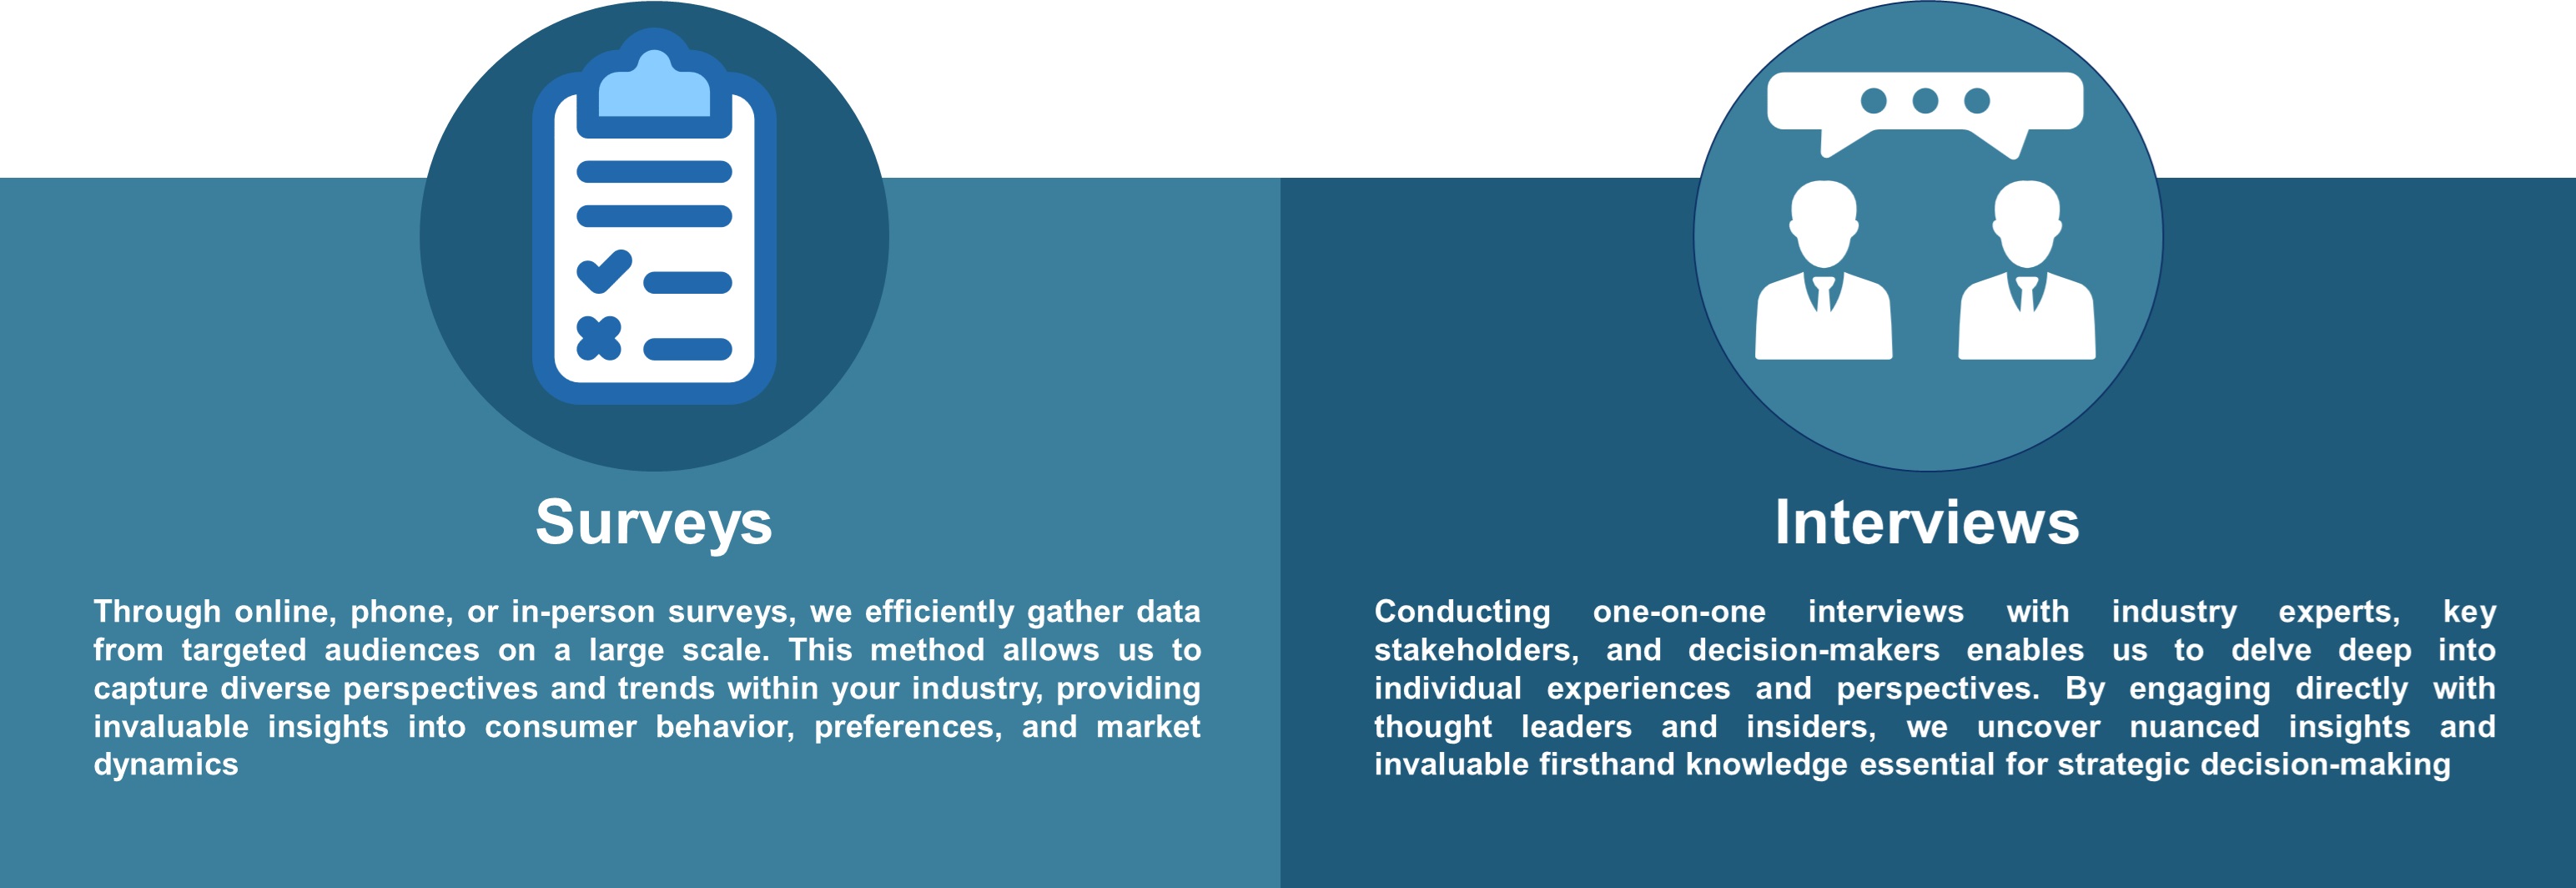
Our qualitative research methodologies involve immersive techniques such as in-depth interviews, focus groups, and observational studies. By engaging directly with individuals and stakeholders, we uncover valuable insights that quantitative data alone may overlook.
Quantitative Research
In tandem with qualitative methodologies, NMSC leverages the power of Quantitative Research to provide a robust foundation of numerical insights. Through systematic data collection and analysis, we quantify patterns, preferences, and market trends, offering a comprehensive view of the business landscape.
Our quantitative research approach employs diverse tools, including surveys, experiments, and statistical modelling. These methodologies enable us to gather data from a large and representative sample, ensuring the statistical significance of our findings. By employing structured questionnaires and standardized data collection methods, we guarantee the reliability and validity of the information we present to our clients.
Quantitative research is particularly effective in measuring the prevalence of trends, assessing market size, and gauging the impact of various factors on consumer behavior. The numerical precision attained through this approach equips our clients with actionable insights, facilitating data-driven decision-making and strategy formulation.
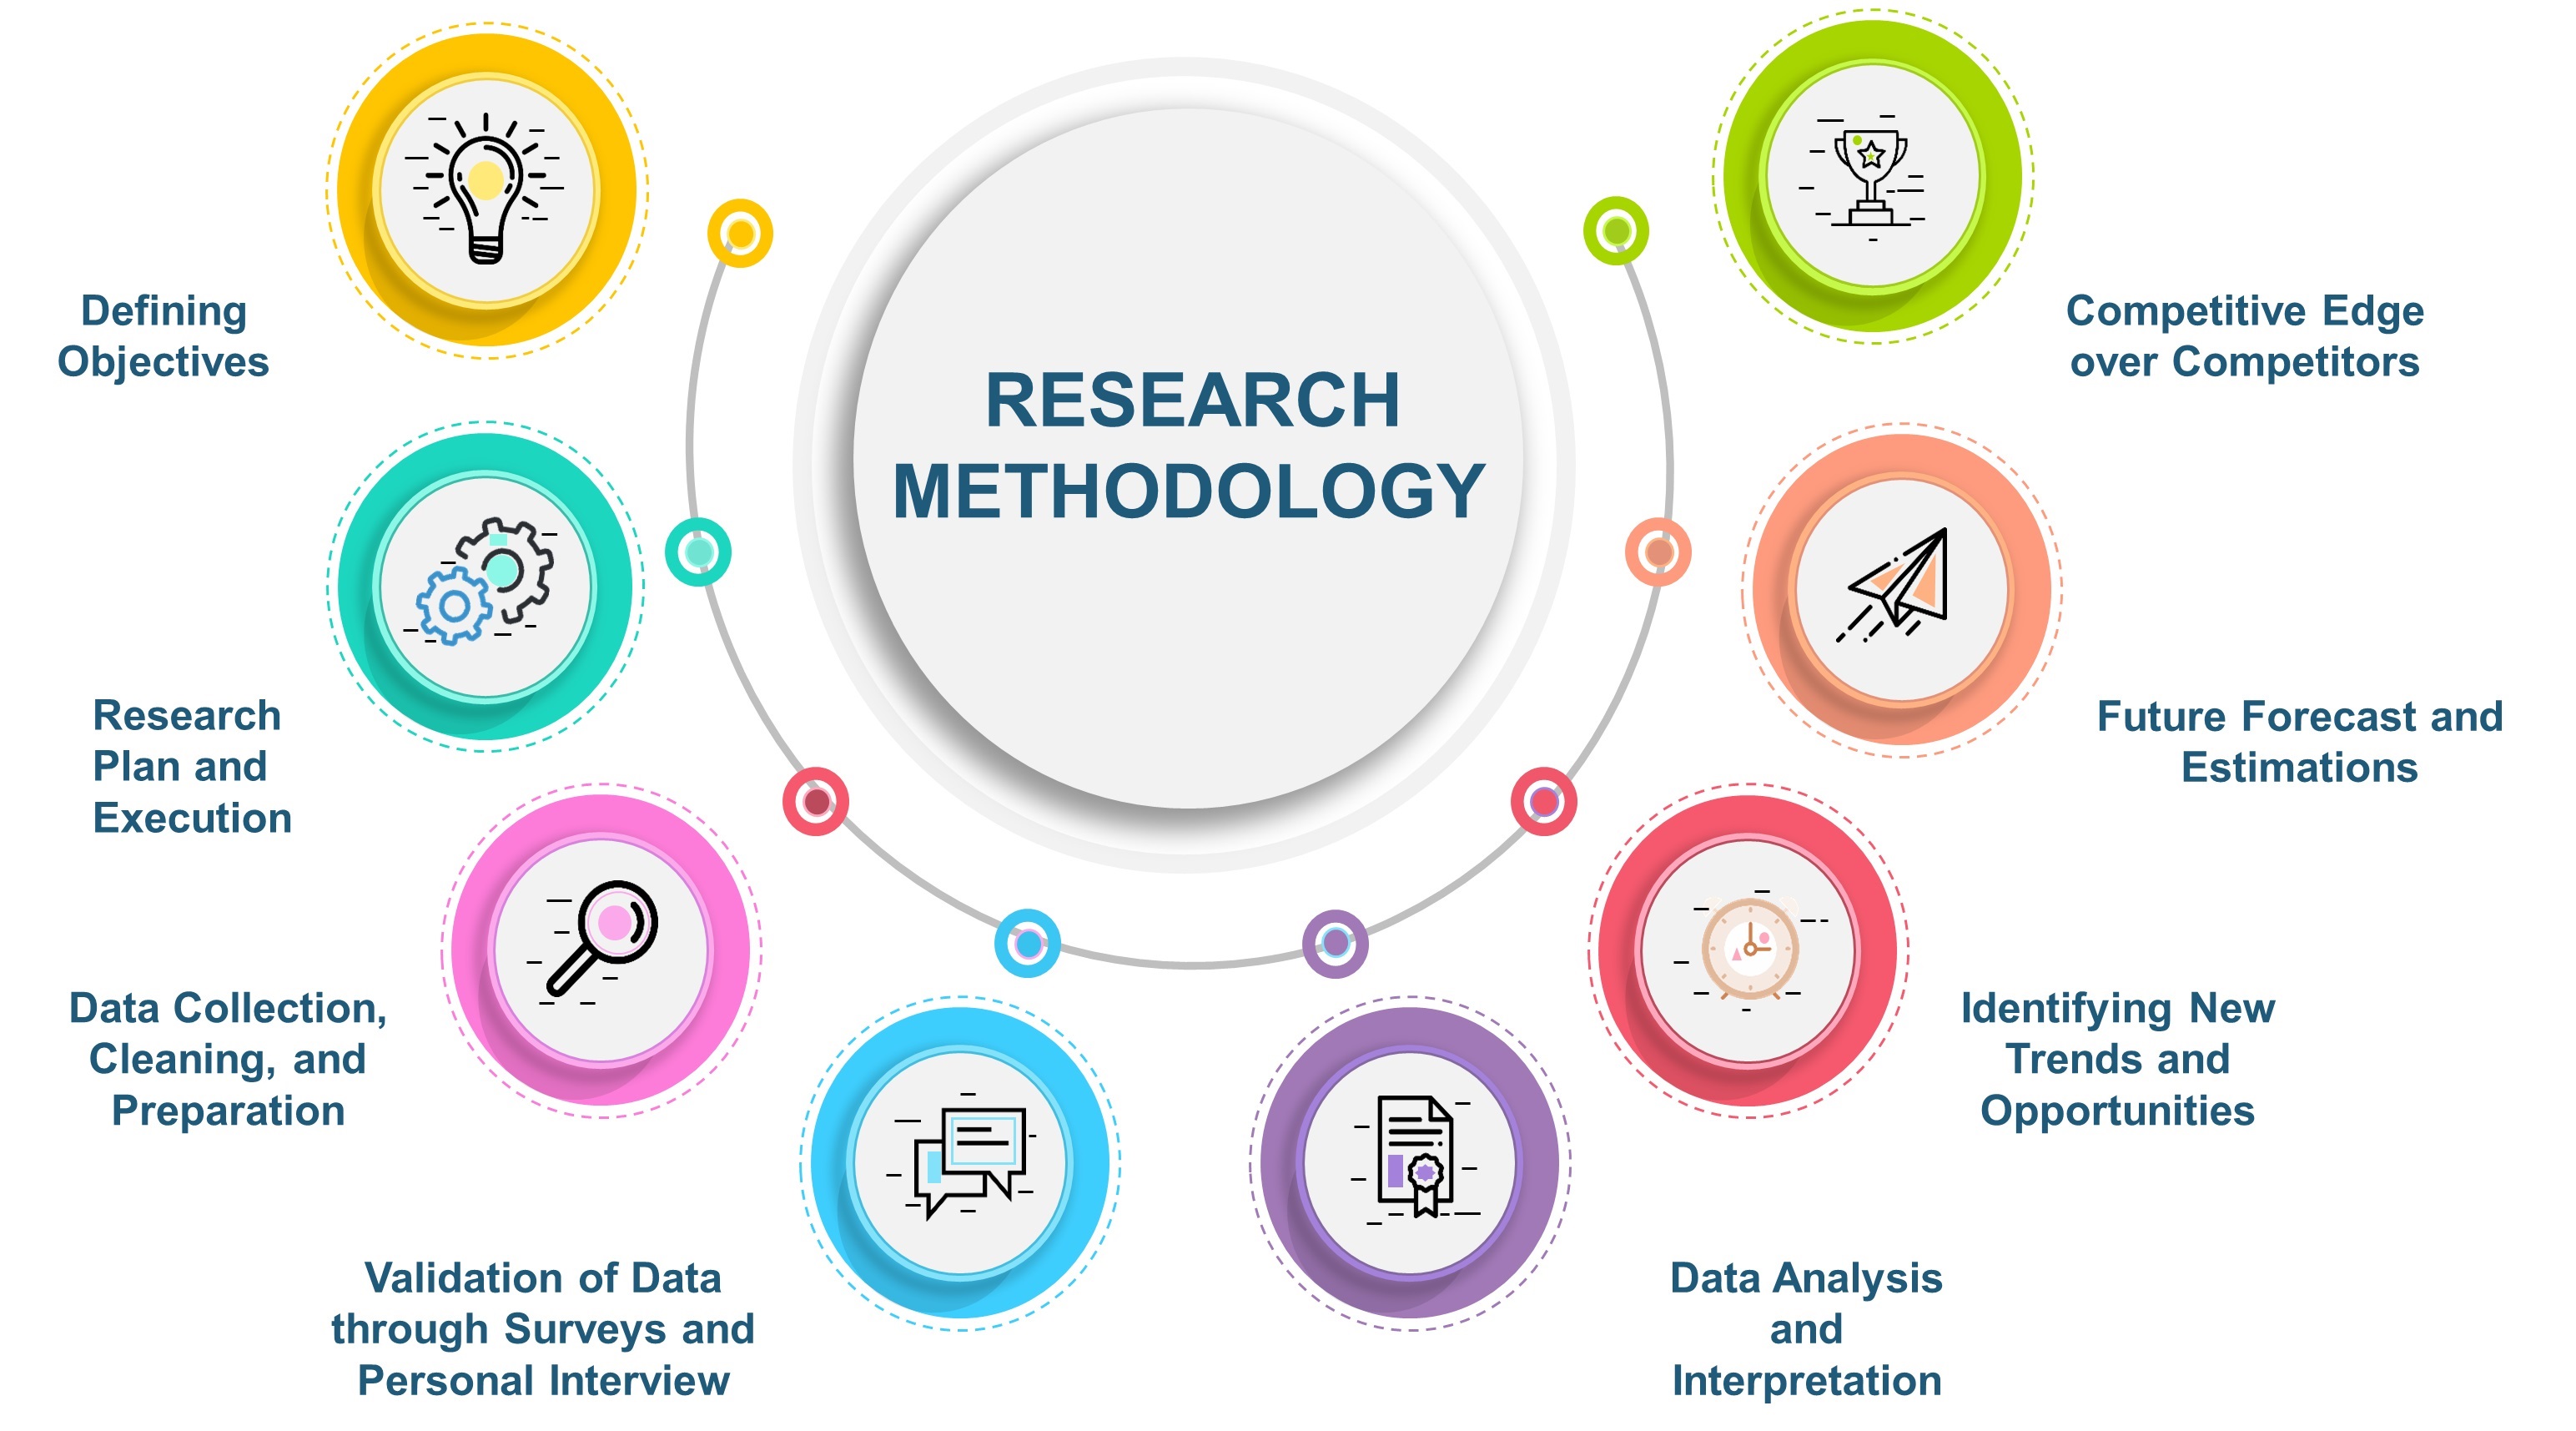
Our Specialized Toolbox for Industry-Specific Market Research
We deploy a specialized arsenal of techniques tailored to meet your unique requirements. Here's a glimpse into our comprehensive toolbox:
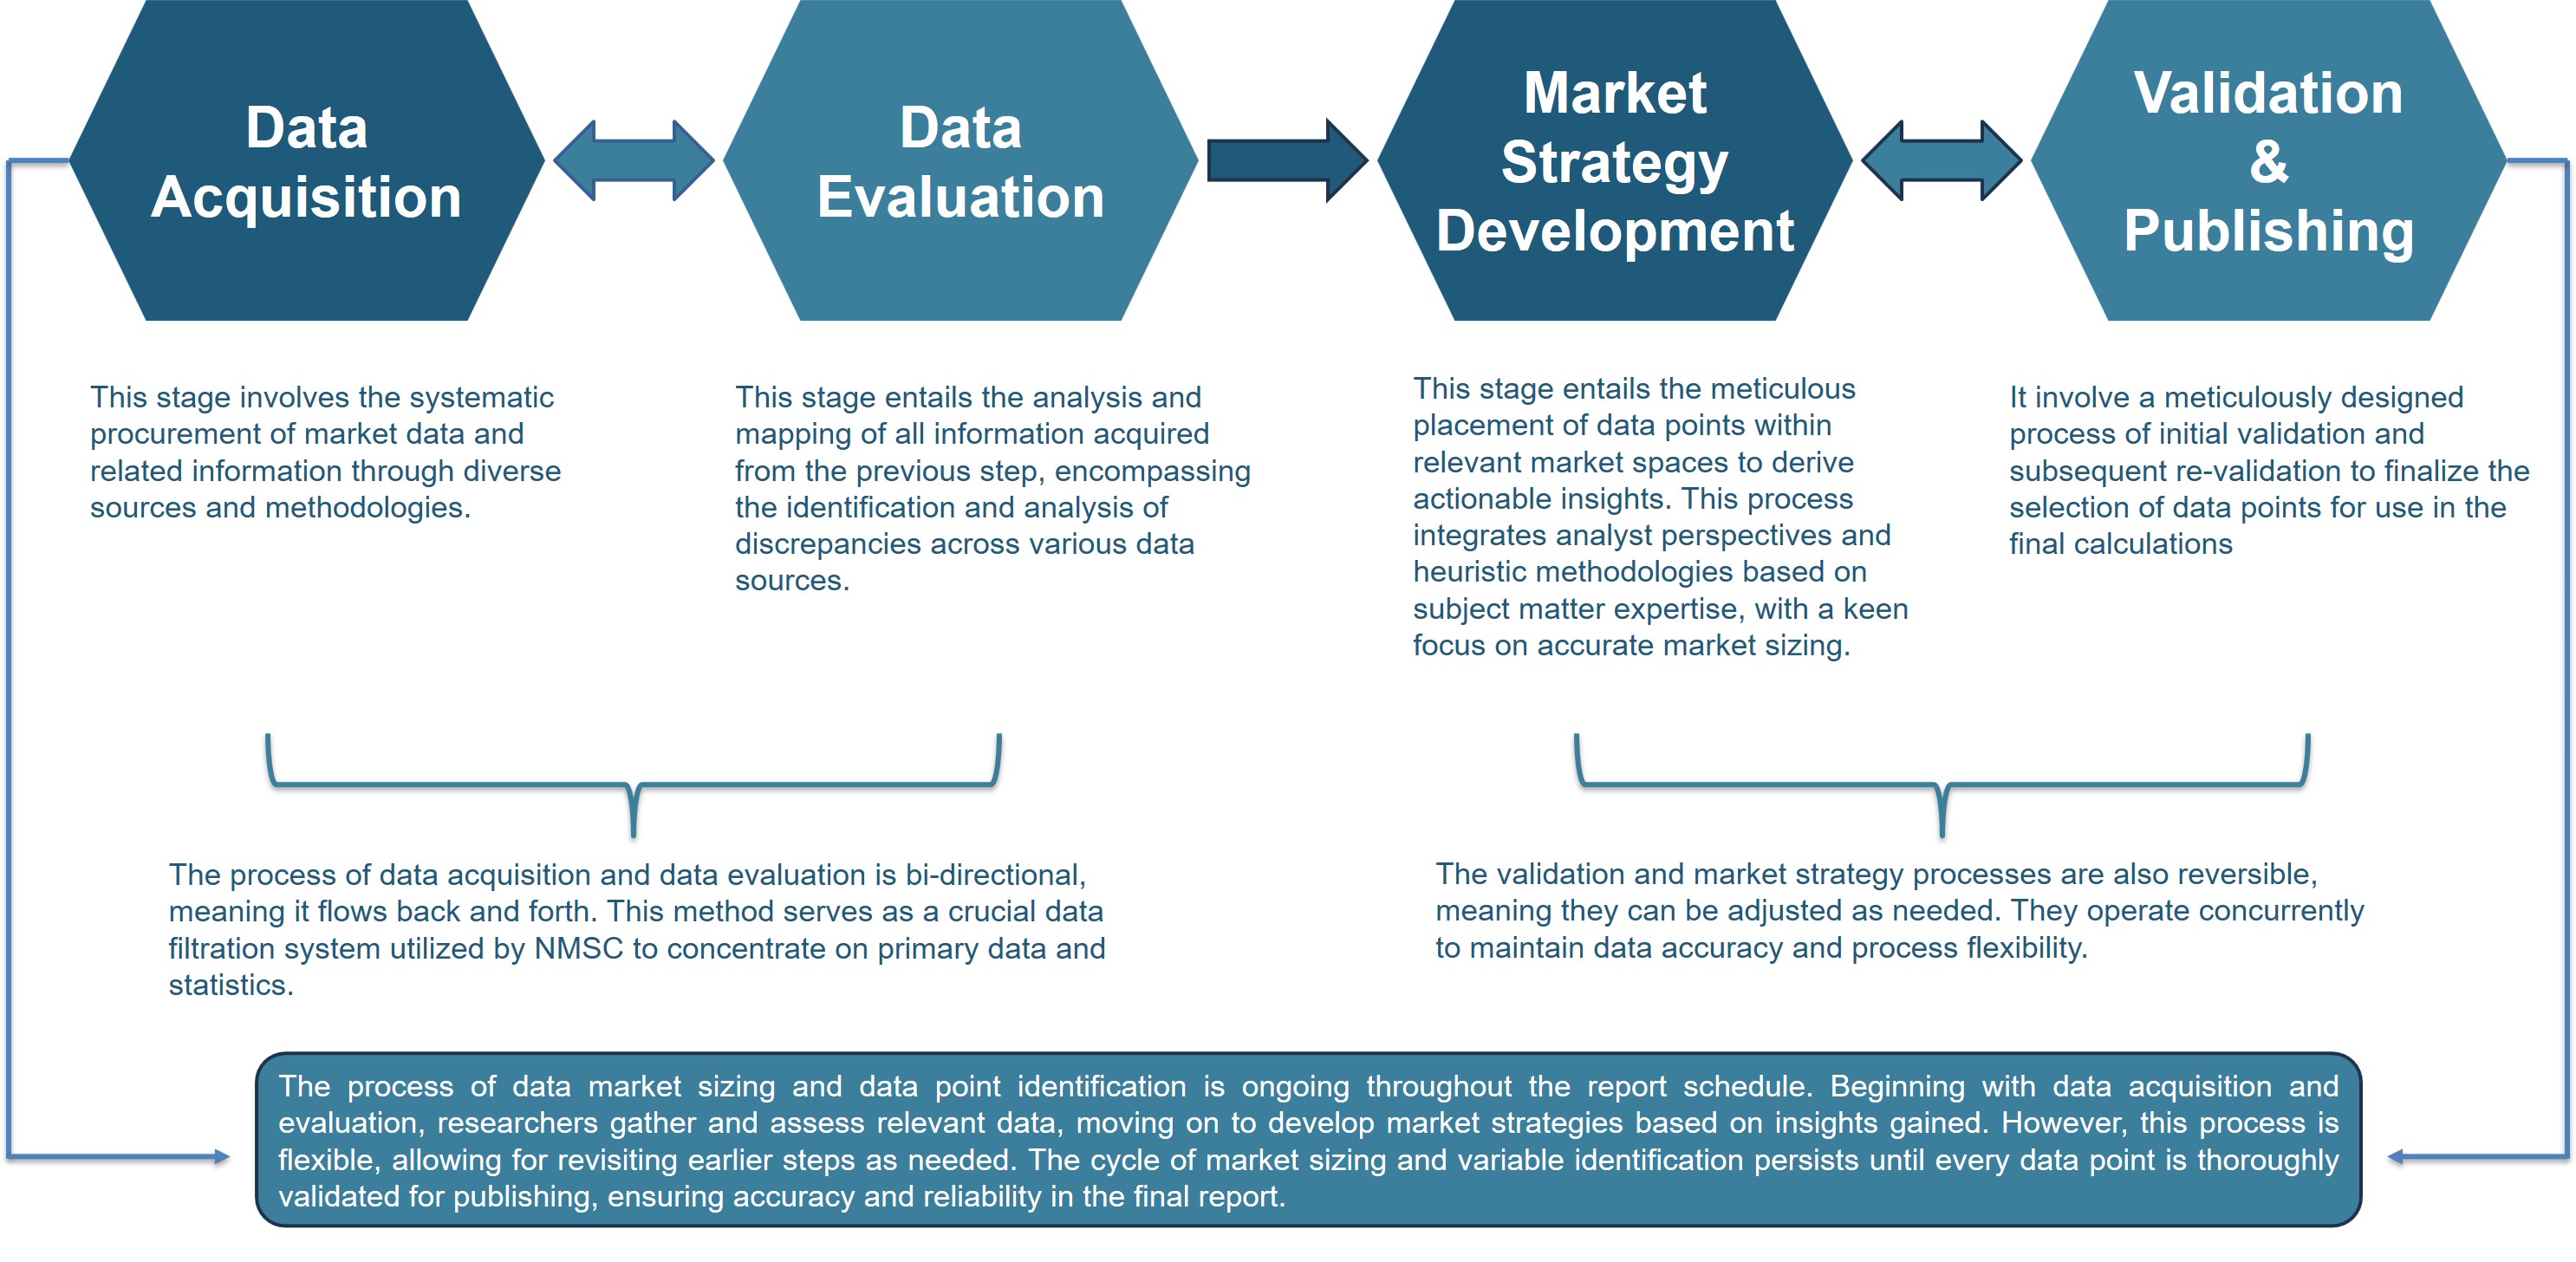
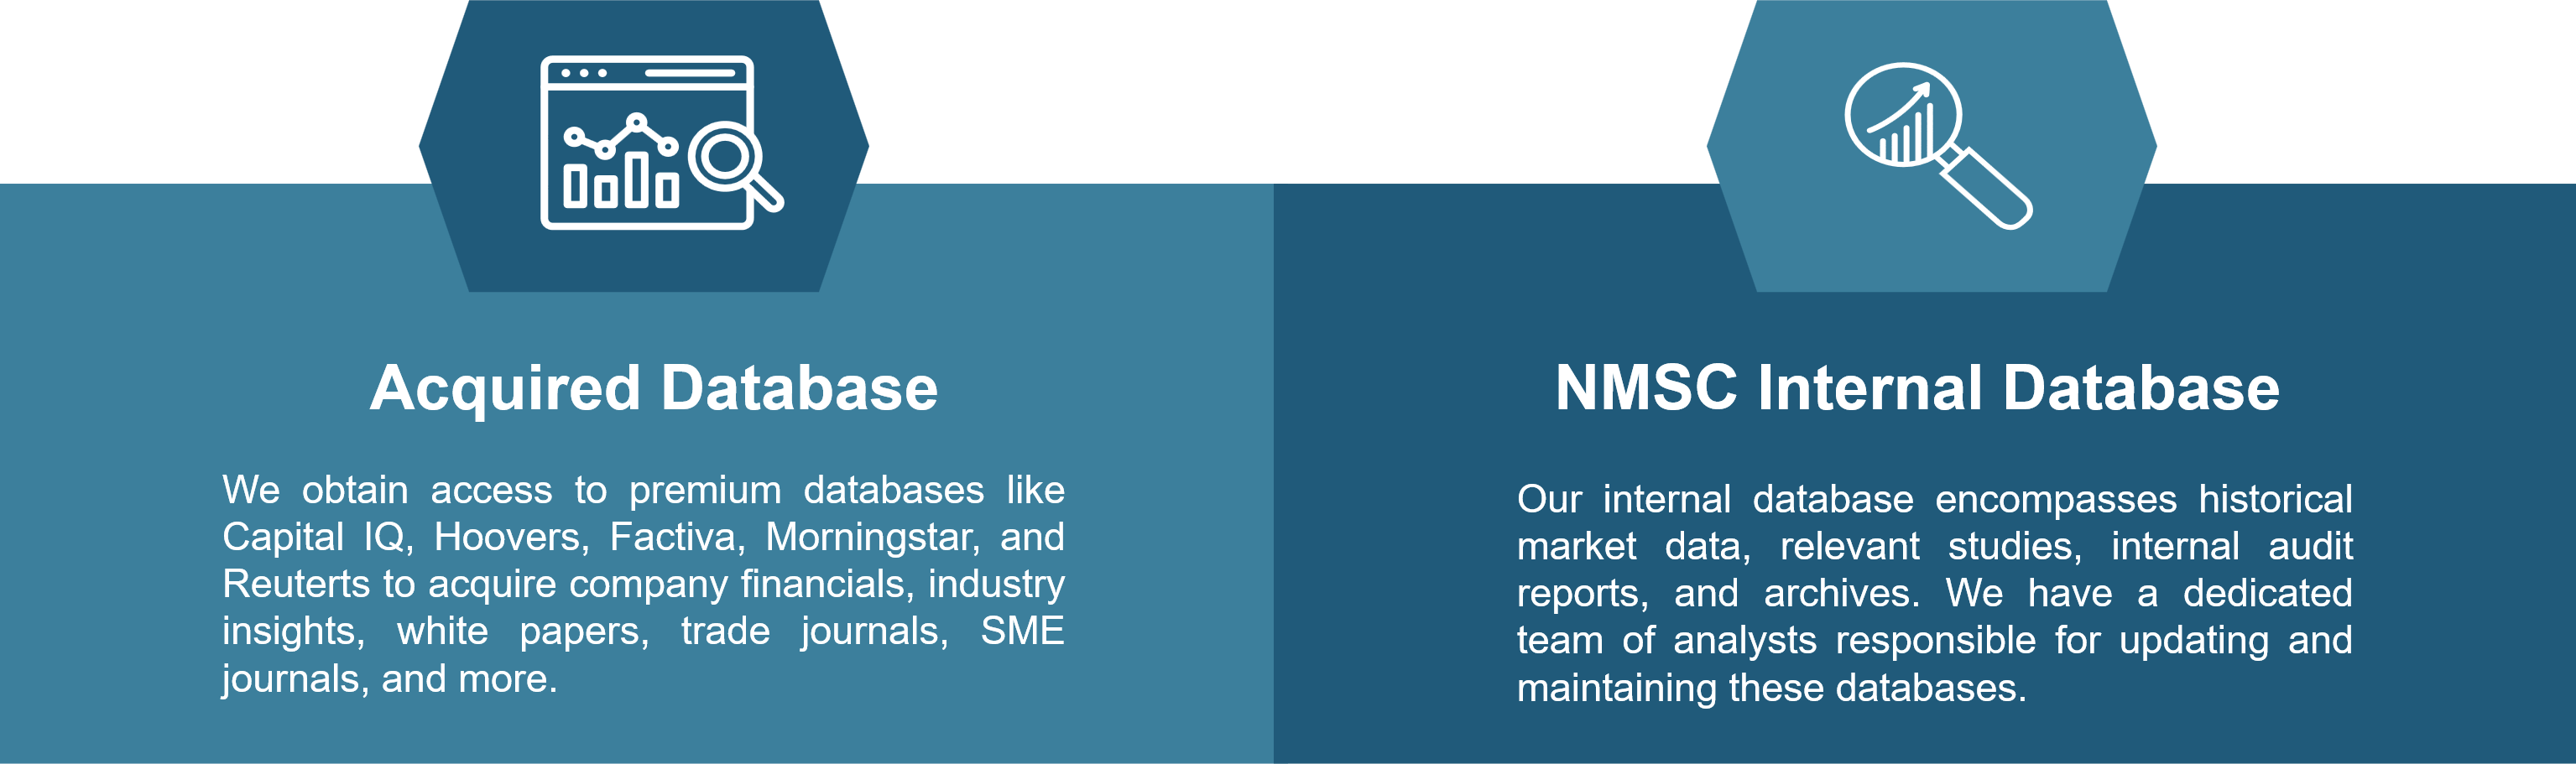
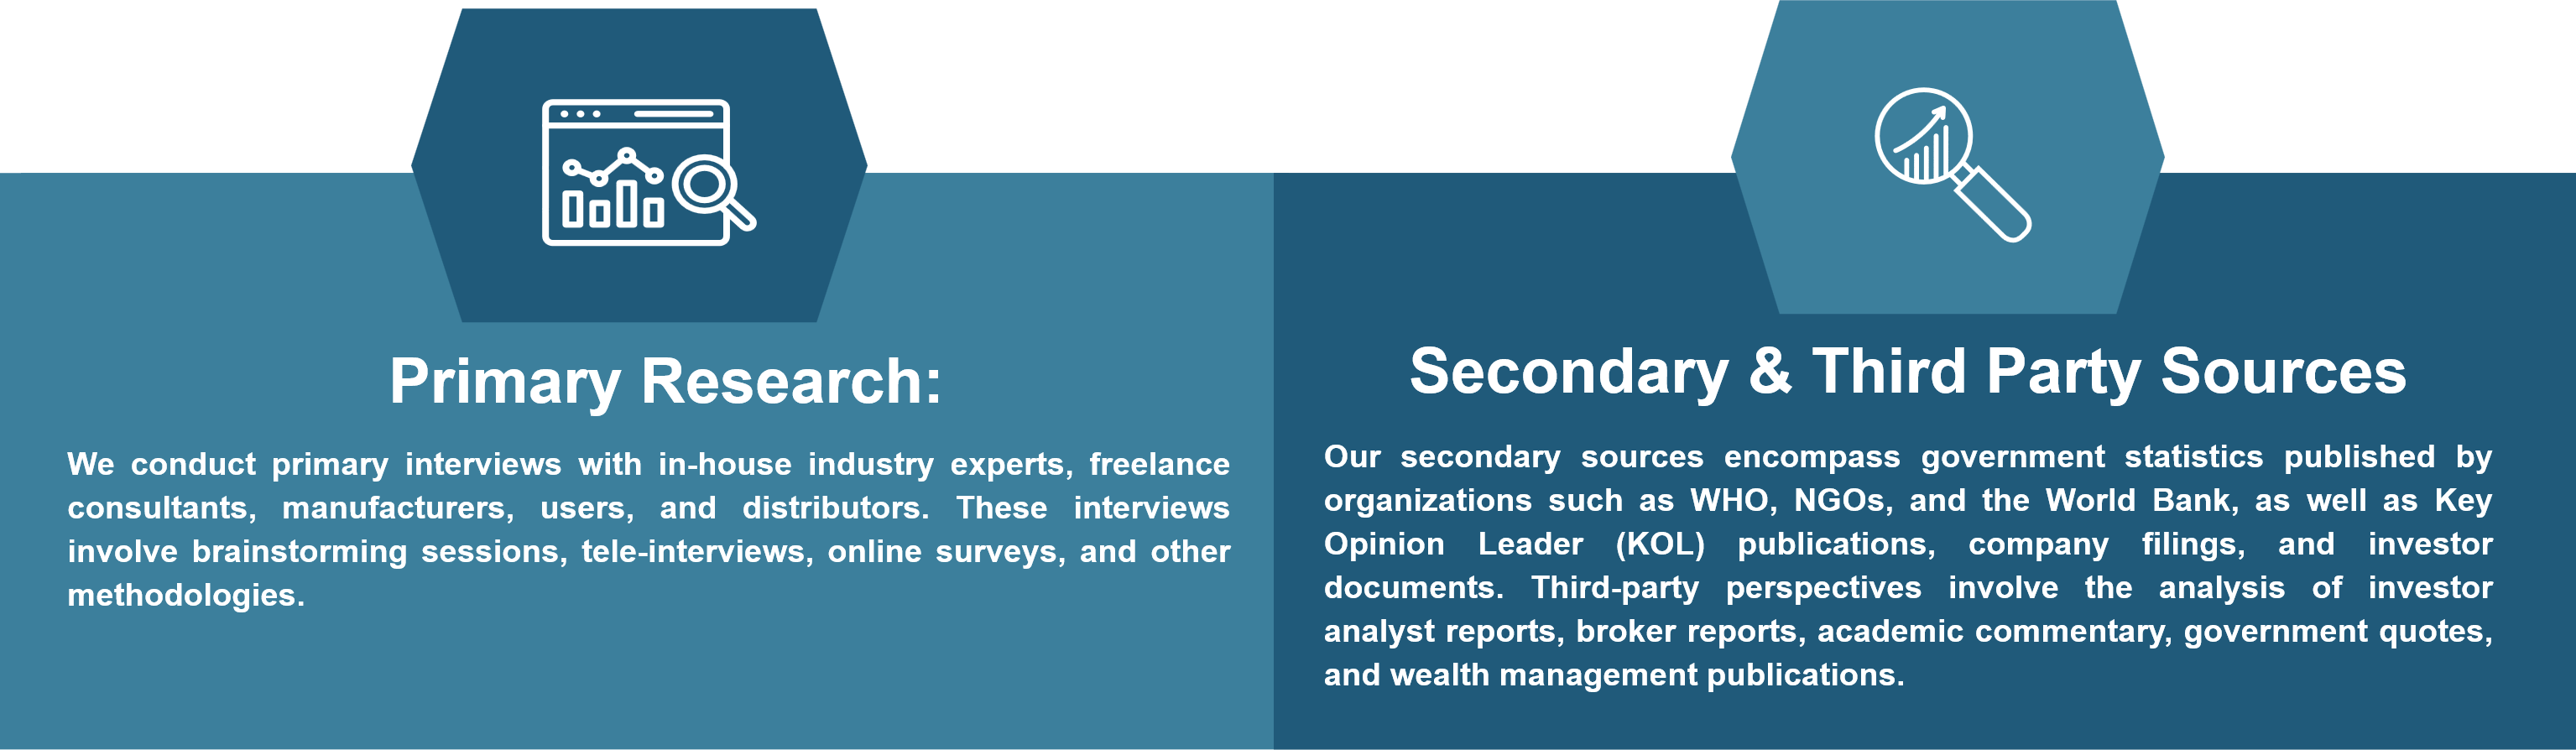
Information Procurement
The stage entails acquiring market data or relevant information through various sources and methodologies.
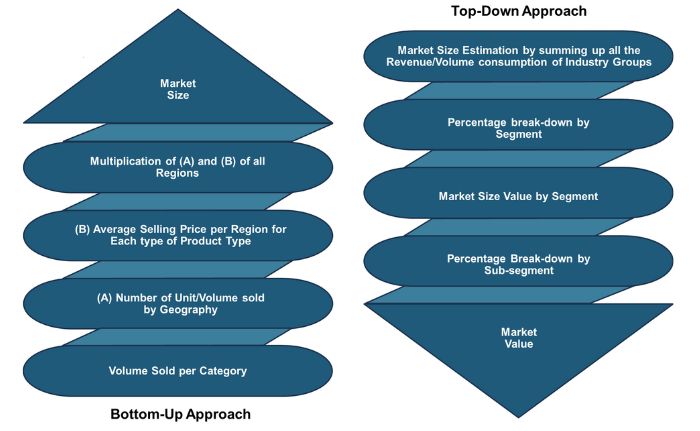
Market Research Approach
We utilize both top-down and bottom-up approaches in market research analysis to achieve a comprehensive understanding of the market dynamics, leveraging the broad perspective of industry trends and macroeconomic factors alongside detailed insights from specific segments and individual companies.
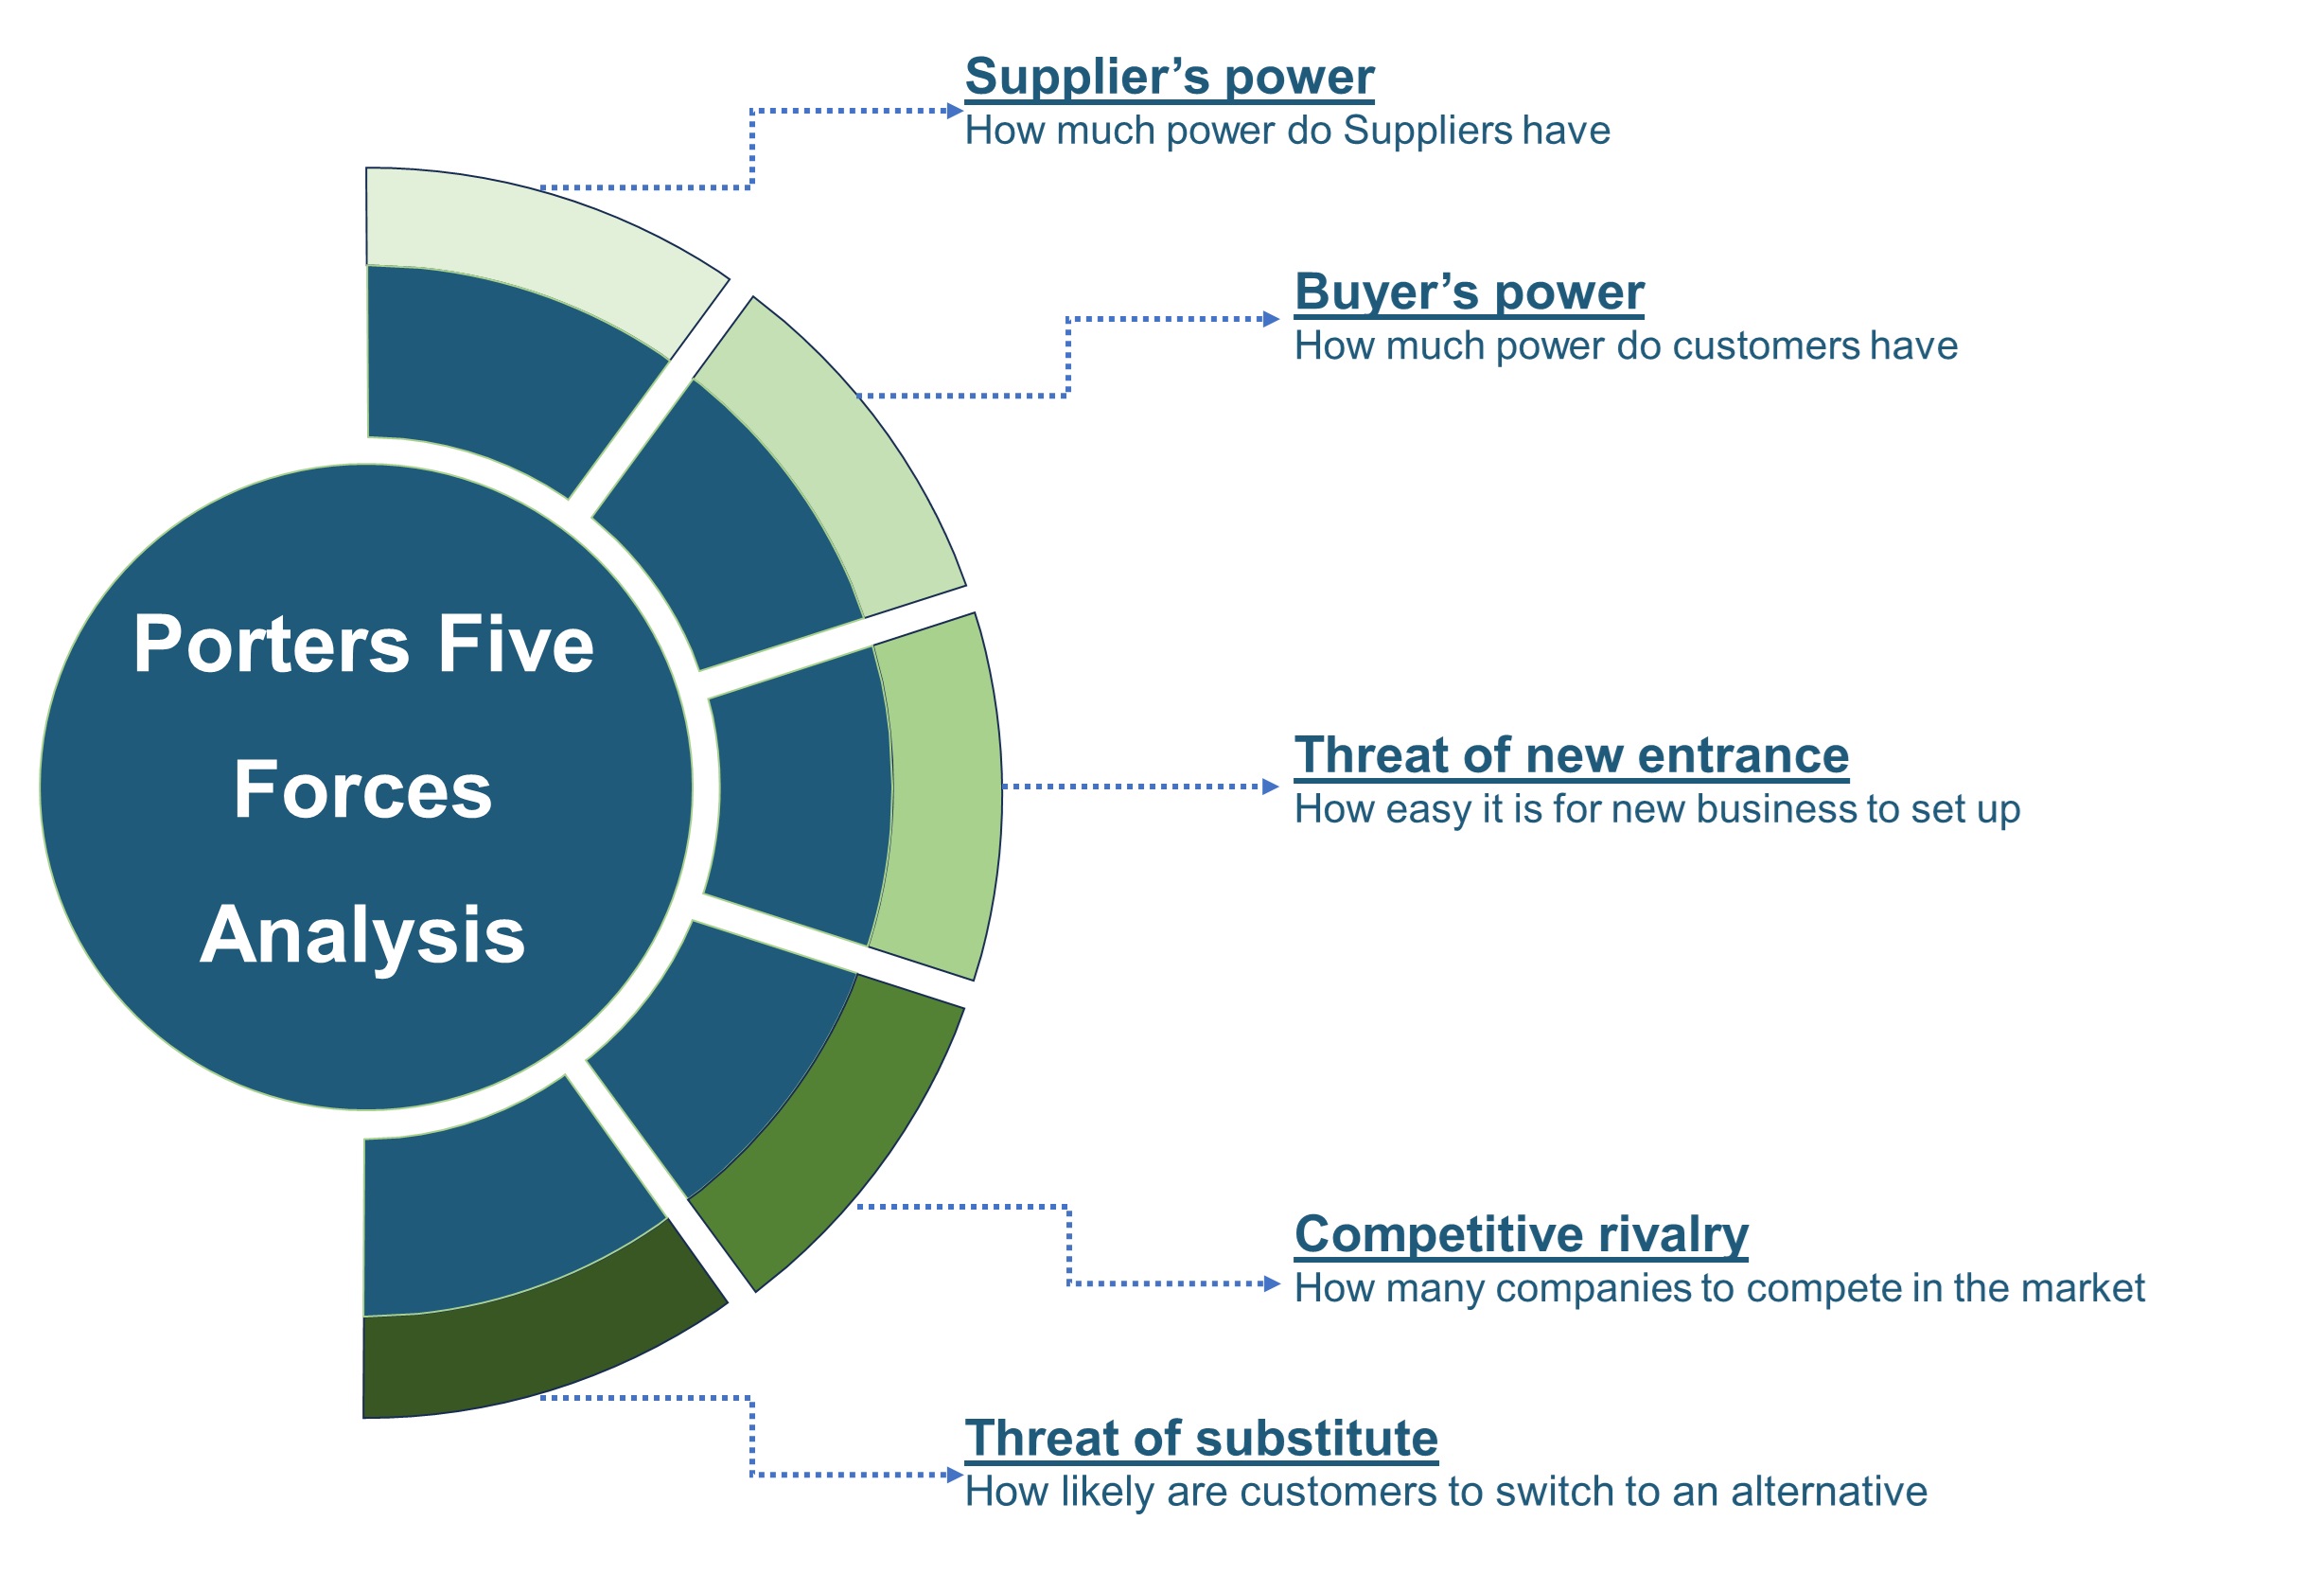
Porters Five Forces Analysis
We conduct Porter's Five Forces analysis to evaluate the competitive landscape of an industry, providing us with insights into factors that affect profitability and strategic positioning.
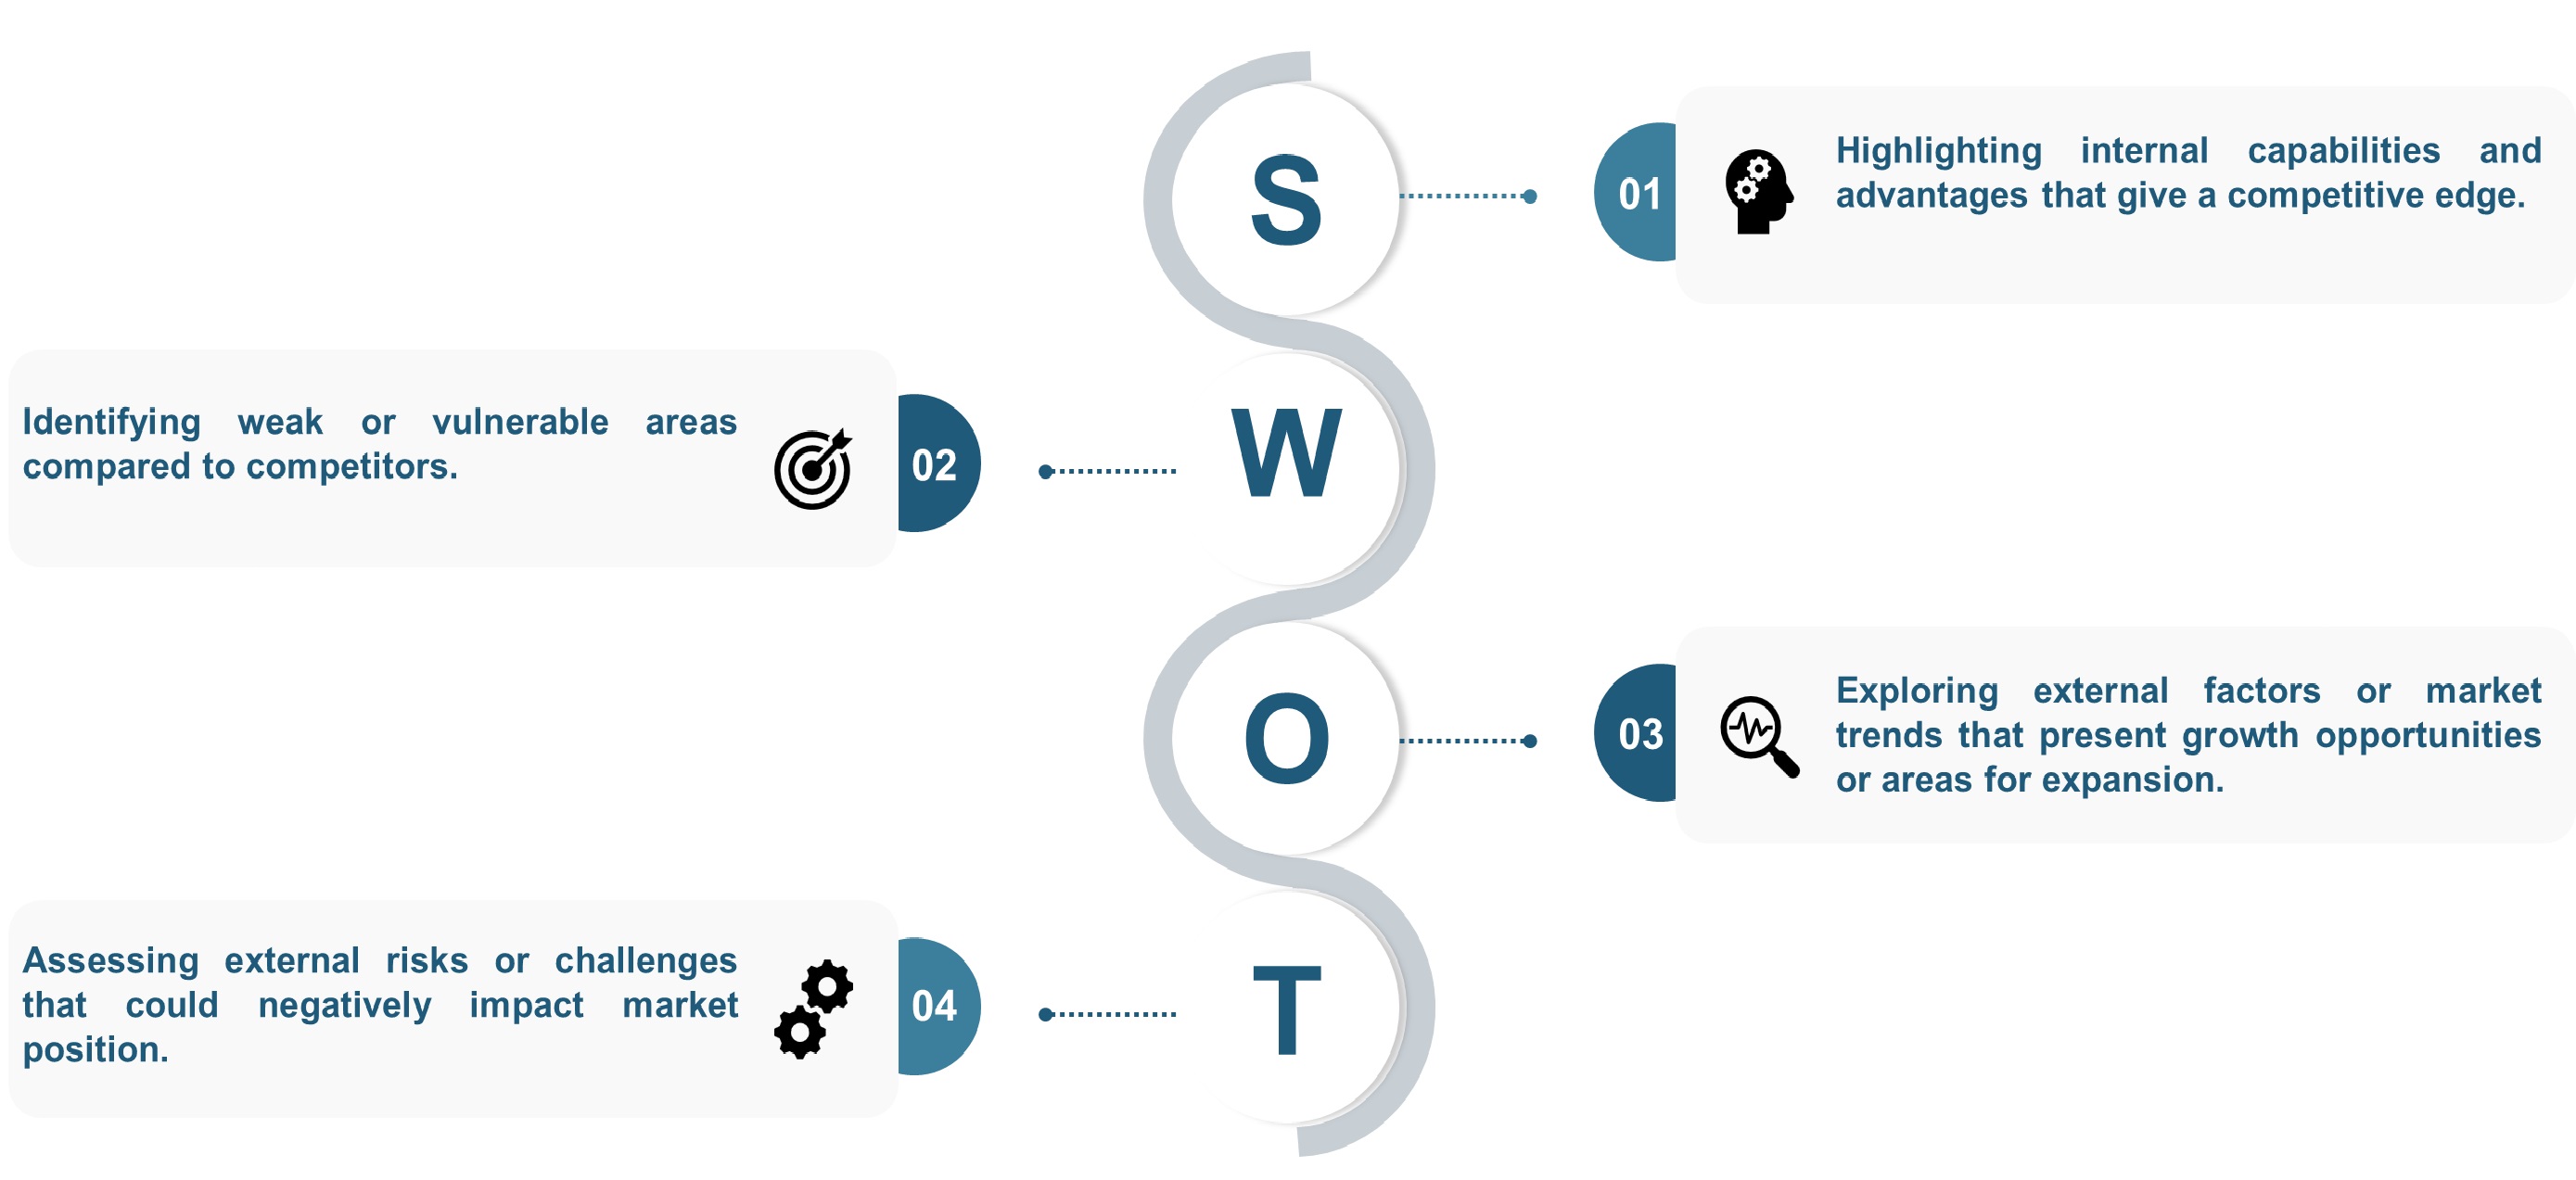
SWOT Analysis
We conduct SWOT analysis to understand market trends, identify potential threats, capitalize on opportunities, and assess our strengths and weaknesses.
Forecasting
We utilize a forecasting model to predict future consumption by considering parameters like population, economics, regulations, market competition, drivers, constraints, technology, and pricing. We also employ statistical techniques such as multilinear regression, exponential smoothing, moving average, ARIMA, and Monte Carlo simulations for accurate predictions. In econometric forecasting, we analyzed short-term and long-term event impacts, attributing values based on regulatory frameworks, economic factors, and market events.