Chemical Distribution Market Global Industry Analysis and Forecast (2026-2035)

Chemical Distribution Market size was USD 218.40 Billion in 2025, projected to reach USD 412.85 Billion by 2035, growing at a CAGR of 6.6% from 2026 to 2035. Key drivers include increasing outsourcing of chemical procurement and logistics, rising demand for specialty chemicals, and the expansion of value-added distribution services , with Asia-Pacific leading the market .

Download Free Sample PDF
Base Year (2025)
$218.40 Billion
Forecast (2035)
$412.85 Billion
CAGR (2026-2035)
6.6%
Top Region
Asia-Pacific

What Is the Chemical Distribution Market Size?

The global chemical distribution market size was valued at USD 218.40 Billion in 2025 and is estimated at USD 231.50 Billion in 2026, forecast to reach USD 412.85 Billion by 2035, expanding at a 6.6% CAGR between 2026 and 2035. Asia-Pacific leads with approximately a 36% share, while Commodity Chemicals dominates all other product types with approximately a 34% share.

We observed that the growth is broad-based across every segmentation axis, with specialty formulation demand and third-party logistics consolidation driving the dominant structural shifts through 2035.

Chemical Distribution Market Global Industry Analysis and Forecast (2026-2035) Revenue Forecast

Values in USD Billion

2025 $218.40 Billion
2025
2026 $232.81 Billion
2026
2027 $248.18 Billion
2027
2028 $264.56 Billion
2028
2029 $282.02 Billion
2029
2030 $300.63 Billion
2030
2031 $320.48 Billion
2031
2032 $341.63 Billion
2032
2033 $364.18 Billion
2033
2034 $388.21 Billion
2034
2035 $412.85 Billion
2035

Key Takeaways

By Product Type: Commodity Chemicals held the largest share with approximately 34% (USD 74.26 Billion) in 2025; Personal Care and Cosmetic Ingredients is the fastest-growing sub-segment at 8.2% CAGR from 2026–2035.

By End-Use Industry: Chemical Manufacturing held the largest share with approximately 15% (USD 32.76 Billion) in 2025; Electronics and Electrical is the fastest-growing sub-segment at 8.3% CAGR from 2026–2035.

By Distribution Channel: Direct Sales held the largest share with approximately 58% (USD 126.67 Billion) in 2025; Secondary Distribution is the fastest-growing sub-segment at 7.4% CAGR from 2026–2035.

Dominant Region: Asia-Pacific dominated with approximately 36% revenue share (USD 78.62 Billion) in 2025.

Fastest-Growing Region: Middle East & Africa is the fastest-growing region at 7.6% CAGR from 2026–2035.

Dominant Country: China led with approximately USD 42.10 Billion in 2025, representing the largest single covered country within Asia-Pacific.

Fastest-Growing Country: Saudi Arabia is the fastest-growing country at approximately 7.5 % CAGR from 2026–2035.

Market Opportunity: The chemical distribution market is expected to create an incremental value opportunity of approximately USD 181.35 Billion between 2026 and 2035, representing a substantial addressable window for specialty formulators, logistics providers, and regional distribution platforms investing in value-added blending and last-mile delivery capacity.

According to NMSC analysis, distributors are increasingly bundling technical formulation support with logistics and regulatory compliance services to defend margins, a shift that favors diversified, multi-category platforms over single-line commodity resellers as customer procurement consolidates through 2035.

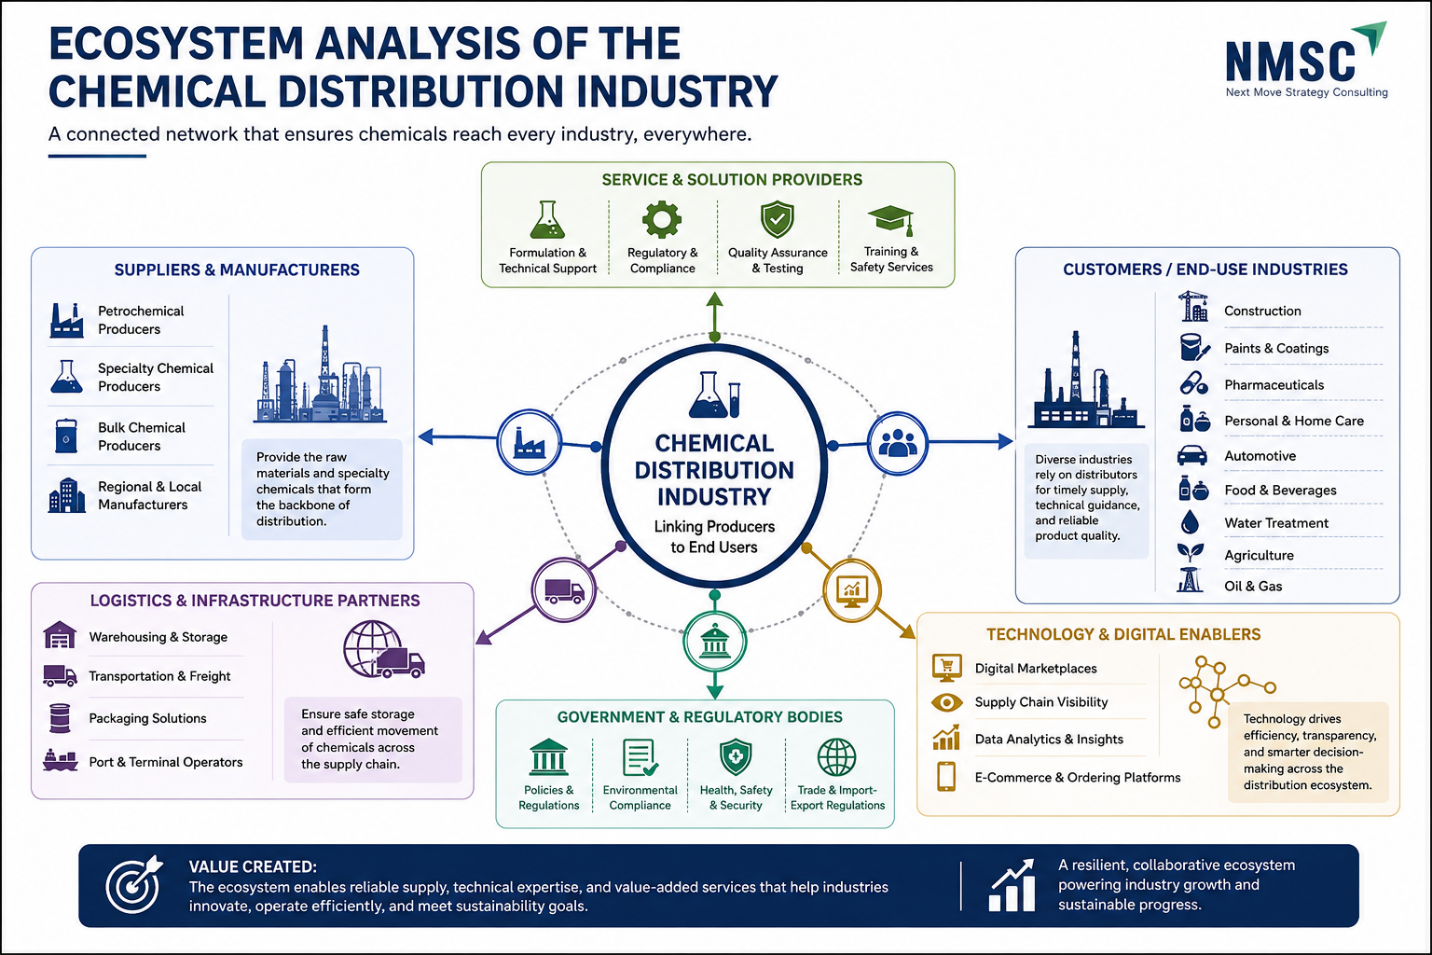
Ecosystem Analysis of the Chemical Distribution Market

The above infographic illustrates the intricate ecosystem of the chemical distribution market , which serves as a vital bridge connecting producers to diverse end-use sectors. We observed that it is fueled by upstream suppliers, logistics partners, and technology enablers, while being guided by regulatory bodies and specialized service providers. Ultimately, this interconnected network drives reliable supply and technical expertise, creating significant value across the global economy .

What Does the Chemical Distribution Market Encompass?

The chemical distribution market encompasses third-party intermediaries that procure, warehouse, blend, and deliver commodity, specialty, and fine chemical products from manufacturers to industrial, agricultural, and consumer end users. Our assessment indicates that the scope spans direct sales, agent and broker arrangements, and secondary distribution networks serving chemical manufacturing, construction, automotive, water treatment, and personal care value chains. The category has evolved from simple bulk resale into an integrated value-added service model, combining formulation support, inventory management, and regulatory documentation for customers who increasingly outsource non-core procurement to specialized partners.

Regulatory frameworks such as the U.S. Toxic Substances Control Act and the European Union's REACH regulation shape registration, labeling, and safe-handling obligations that distributors must satisfy on behalf of upstream suppliers, while national chemical management databases increasingly influence cross-border trade documentation. We observed that technology adoption is shifting toward digital order management, automated inventory replenishment, and blockchain-enabled traceability platforms that reduce lead times. NMSC's analysis indicates that this structural shift, combined with tightening safety and sustainability disclosure requirements, is redefining sourcing criteria across the market.

Market Drivers & Dynamics

Interactive Dataset
Rising outsourcing of chemical procurement by mid-sized manufacturers driver +1.4% Global 2026–2035
Growth of specialty and performance chemical demand driver +1.1% Asia-Pacific, North America 2026–2035
Expansion of value-added blending and technical service models driver +0.9% Global 2026–2032
Digitalization of procurement and inventory management driver +0.7% North America, Europe 2026–2035
Infrastructure and construction sector demand for coatings and adhesives driver +0.6% Asia-Pacific, Middle East & Africa 2027–2035
Stringent chemical safety and transportation regulations restraint -0.8% Europe, North America 2026–2035
Volatility in petrochemical feedstock pricing restraint -0.6% Global 2026–2030
High working-capital intensity of bulk inventory holding restraint -0.5% Global 2026–2035
Fragmented regional regulatory approval requirements restraint -0.4% Latin America, Middle East & Africa 2026–2032
Source: Next Move Strategy Consulting

Growth Drivers

What Is the Primary Growth Driver of the Chemical Distribution Market ?

The primary growth driver is rising outsourcing of chemical procurement, warehousing, and formulation by mid-sized manufacturers that lack dedicated sourcing infrastructure. The United States International Trade Commission reports that U.S. chemical industry shipments continue to expand steadily, supporting downstream distribution volumes. Our analysis shows that this outsourcing trend contributes approximately 1.4 percentage points to the 2026–2035 CAGR, as manufacturers redirect capital toward core production rather than in-house logistics and compliance management.

How Is Specialty Chemical Demand Driving Market Growth?

Specialty chemical demand is expanding distributor revenue mix toward higher-margin, technically differentiated product lines including coatings additives, water treatment formulations, and personal care ingredients. The U.S. Environmental Protection Agency's chemical data reporting programs indicate sustained registration activity for specialty and performance chemical categories. We found that specialty-linked distribution activity is growing at approximately 7.9% CAGR through 2035, materially faster than commodity-line resale, reflecting the segment's structural shift toward value-added service delivery.

Growth Inhibitors

What Is Restraining the Chemical Distribution Market?

Stringent chemical safety, storage, and cross-border transportation regulations are raising compliance costs for distributors handling hazardous or restricted formulations. The European Chemicals Agency's REACH registration requirements impose extensive documentation obligations on distributors moving products across member states. During our market evaluation, we noticed that these compliance burdens weigh most heavily on smaller regional distributors, constraining the overall CAGR by an estimated 0.8 percentage points between 2026 and 2035.

Segmentation Analysis

2025 (USD Billion)
2035 (USD Billion)
Commodity Chemicals 2025: $74.26 Billion | 2035: $127.21 Billion
Commodity Ch
Polymers and Resins 2025: $41.50 Billion | 2035: $74.19 Billion
Polymers and
Specialty Chemicals 2025: $52.42 Billion | 2035: $111.84 Billion
Specialty Ch
Fine Chemicals and Active Ingredients 2025: $19.66 Billion | 2035: $39.89 Billion
Fine Chemica
Food and Feed Ingredients 2025: $13.10 Billion | 2035: $24.85 Billion
Food and Fee
Personal Care and Cosmetic Ingredients 2025: $8.74 Billion | 2035: $19.12 Billion
Personal Car
Agricultural Formulation Products 2025: $6.55 Billion | 2035: $12.01 Billion
Agricultural
Other Distributed Chemical Products 2025: $2.17 Billion | 2035: $3.74 Billion
Other Distri
Commodity Chemicals $74.26 Billion $127.21 Billion 5.3%
Polymers and Resins $41.50 Billion $74.19 Billion 5.8%
Specialty Chemicals $52.42 Billion $111.84 Billion 7.9%
Fine Chemicals and Active Ingredients $19.66 Billion $39.89 Billion 7.3%
Food and Feed Ingredients $13.10 Billion $24.85 Billion 6.5%
Personal Care and Cosmetic Ingredients $8.74 Billion $19.12 Billion 8.2%
Agricultural Formulation Products $6.55 Billion $12.01 Billion 6.1%
Other Distributed Chemical Products $2.17 Billion $3.74 Billion 5.4%

Which Product Type Segment Dominates the Market?

Commodity Chemicals dominated the chemical distribution market with approximately 34% share in 2025, reflecting its role as the largest-volume category moving through distributor networks into fuel, plastics, and industrial manufacturing applications. Personal Care and Cosmetic Ingredients is the fastest-growing sub-segment at 8.2% CAGR through 2035, supported by rising demand for coatings additives, water treatment formulations, and performance-driven applications. Our analysis shows distributors are reallocating warehouse and technical-service capacity toward the higher-margin specialty category.

2025 (USD Billion)
2035 (USD Billion)
Chemical Manufacturing 2025: $32.76 Billion | 2035: $58.34 Billion
Chemical Man
Building and Construction 2025: $26.21 Billion | 2035: $48.69 Billion
Building and
Automotive and Transportation 2025: $21.84 Billion | 2035: $41.62 Billion
Automotive a
Water and Wastewater Treatment 2025: $19.66 Billion | 2035: $38.74 Billion
Water and Wa
Oil and Gas 2025: $17.47 Billion | 2035: $30.07 Billion
Oil and Gas
Paints and Coatings 2025: $17.47 Billion | 2035: $34.14 Billion
Paints and C
Agriculture 2025: $15.29 Billion | 2035: $28.89 Billion
Agriculture
Pharmaceuticals and Healthcare 2025: $15.29 Billion | 2035: $30.90 Billion
Pharmaceutic
Personal Care and Cosmetics 2025: $13.10 Billion | 2035: $26.03 Billion
Personal Car
Electronics and Electrical 2025: $13.10 Billion | 2035: $28.54 Billion
Electronics
Food and Beverage 2025: $10.92 Billion | 2035: $20.12 Billion
Food and Bev
Textiles and Leather 2025: $6.55 Billion | 2035: $11.76 Billion
Textiles and
Mining and Metals 2025: $4.37 Billion | 2035: $7.59 Billion
Mining and M
Pulp and Paper 2025: $2.18 Billion | 2035: $3.66 Billion
Pulp and Pap
Other Industrial Users 2025: $2.19 Billion | 2035: $3.76 Billion
Other Indust
Chemical Manufacturing $32.76 Billion $58.34 Billion 5.9%
Building and Construction $26.21 Billion $48.69 Billion 6.4%
Automotive and Transportation $21.84 Billion $41.62 Billion 6.7%
Water and Wastewater Treatment $19.66 Billion $38.74 Billion 7.1%
Oil and Gas $17.47 Billion $30.07 Billion 5.5%
Paints and Coatings $17.47 Billion $34.14 Billion 7.0%
Agriculture $15.29 Billion $28.89 Billion 6.6%
Pharmaceuticals and Healthcare $15.29 Billion $30.90 Billion 7.4%
Personal Care and Cosmetics $13.10 Billion $26.03 Billion 7.2%
Electronics and Electrical $13.10 Billion $28.54 Billion 8.3%
Food and Beverage $10.92 Billion $20.12 Billion 6.3%
Textiles and Leather $6.55 Billion $11.76 Billion 6.0%
Mining and Metals $4.37 Billion $7.59 Billion 5.6%
Pulp and Paper $2.18 Billion $3.66 Billion 5.2%
Other Industrial Users $2.19 Billion $3.76 Billion 5.5%

Which End-Use Industry Leads Chemical Distribution Demand in the Chemical Distribution Market ?

Chemical Manufacturing led end-use demand with approximately a 15% share in 2025, as intermediate producers rely on distributors for feedstock aggregation and just-in-time delivery. Electronics and Electrical is the fastest-growing end-use category at 8.3% CAGR through 2035, driven by rising demand for high-purity process chemicals in semiconductor and display manufacturing. We observed that distributors serving electronics customers are investing in cleanroom-compatible packaging and handling capabilities to meet purity specifications.

2025 (USD Billion)
2035 (USD Billion)
Direct Sales 2025: $126.67 Billion | 2035: $231.63 Billion
Direct Sales
Agent and Broker Sales 2025: $52.42 Billion | 2035: $101.69 Billion
Agent and Br
Secondary Distribution 2025: $39.31 Billion | 2035: $79.53 Billion
Secondary Di
Direct Sales $126.67 Billion $231.63 Billion 6.2%
Agent and Broker Sales $52.42 Billion $101.69 Billion 6.9%
Secondary Distribution $39.31 Billion $79.53 Billion 7.4%

Which Distribution Channel Generates the Most Revenue?

Direct Sales generated approximately 58% of 2025 revenue, reflecting large manufacturers' preference for negotiated volume contracts with established distributors. Secondary Distribution is the fastest-growing channel at 7.4% CAGR through 2035, as smaller regional resellers extend distributor reach into fragmented end markets. Based on research conducted by NMSC, we found that secondary distribution is expanding fastest in markets with dispersed small-and-medium manufacturing bases.

2025 (USD Billion)
2035 (USD Billion)
Liquid
Solid
Gas
Semi-Solid
Segment Item 2025 (USD Billion) 2035 (USD Billion) CAGR
Liquid $10.0 USD Billion $40.0 USD Billion 9.0%
Solid $17.1 USD Billion $51.1 USD Billion 11.0%
Gas $24.2 USD Billion $62.2 USD Billion 21.0%
Semi-Solid $31.3 USD Billion $73.3 USD Billion 15.0%

Segment-wise data not detailed in this view

Unlock complete segment-wise numbers for By Product Form.

Unlock Full Data

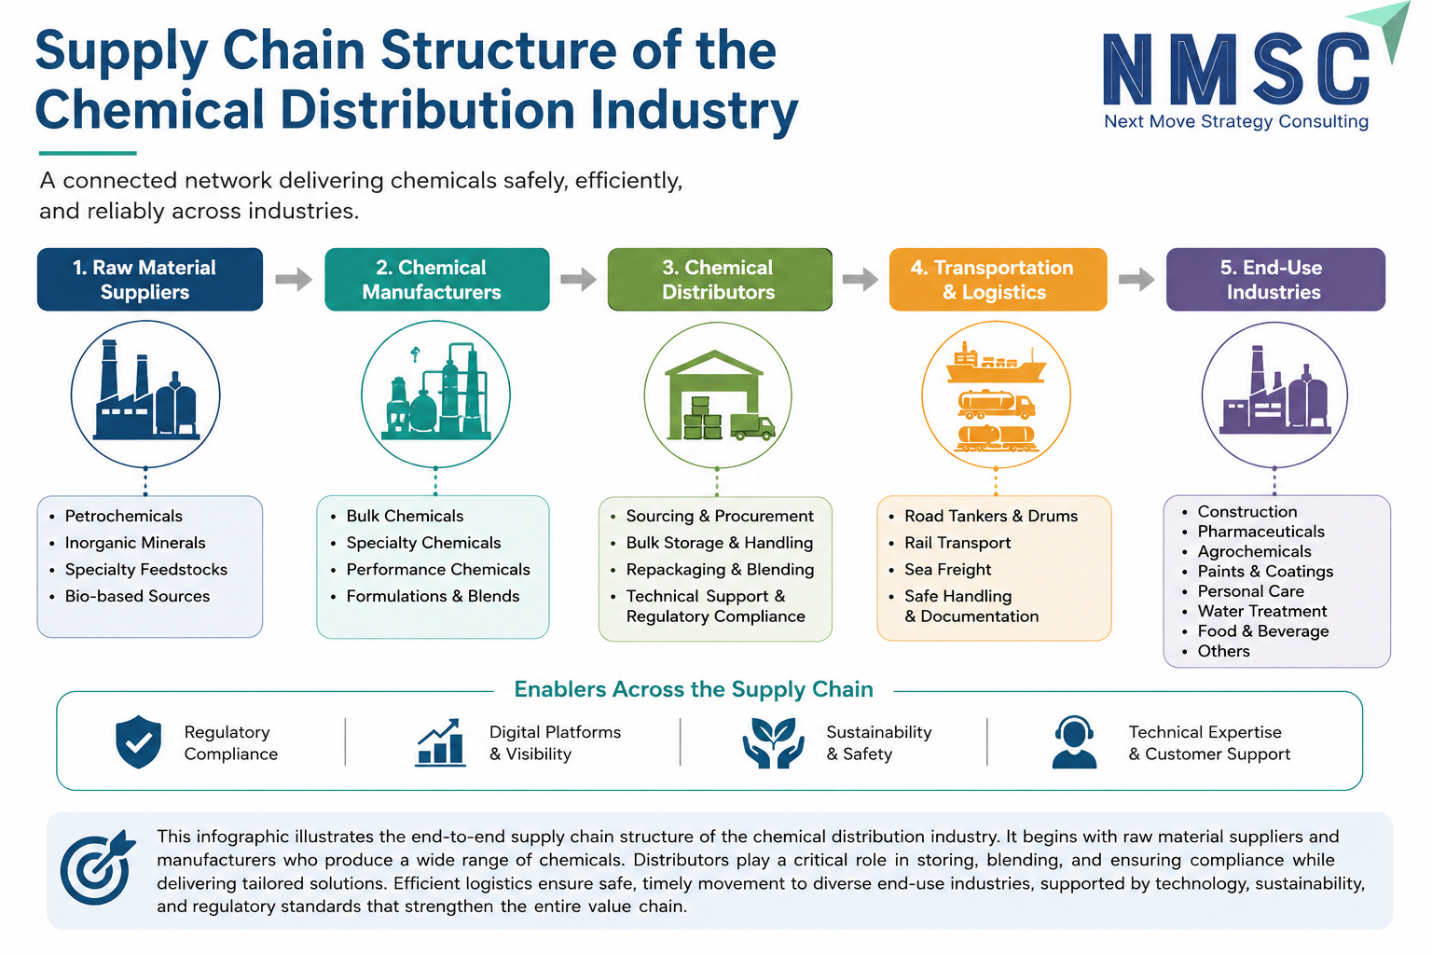
Supply Chain Analysis of the Chemical Distribution Industry

Supply Chain Analysis of the Chemical Distribution Industry
The above infographic outlines the linear supply chain structure of the chemical distribution industry , detailing a five-step flow from raw material suppliers through to end-use industries. It highlights specific activities like manufacturing, warehousing, and logistics, alongside an overarching foundation of enablers such as regulatory compliance and digital visibility that support efficient operations across the entire network .

Growth Opportunities

Our assessment indicates three forward-looking opportunities where distributors and formulation partners can capture disproportionate value through 2035.

How Can Electronics-Grade Chemical Distribution Capture Semiconductor Growth?

Expanding semiconductor fabrication capacity across Asia-Pacific and North America is creating sustained demand for ultra-high-purity process chemicals distributed through cleanroom-compatible logistics, positioning specialty distributors to capture premium margins by serving semiconductor and display manufacturers, the primary beneficiary segment.

How Can Agrochemical Formulation Support Unlock Value in Emerging Markets?

Rising smallholder adoption of crop protection and specialty fertilizer products across Latin America and Asia-Pacific creates a whitespace opportunity for distributors to offer localized formulation, packaging, and application support. Agricultural formulation product distributors and regional agrochemical resellers stand to benefit as demand shifts toward smaller, application-ready package sizes.

How Can Sustainability-Certified Ingredient Sourcing Create Premium Value?

Brand owners in personal care and food ingredient categories are seeking traceable, sustainability-certified raw material sourcing, creating an opportunity for distributors to build certified supplier networks and command premium pricing. Personal care ingredient formulators and food and beverage manufacturers are the primary beneficiary segments as certification becomes a procurement prerequisite.

Regional Outlook

Asia-Pacific $78.62 Billion $154.72 Billion 6.9%
North America $56.78 Billion $101.81 Billion 5.8%
Europe $48.05 Billion $84.70 Billion 5.6%
Middle East & Africa $19.66 Billion $41.03 Billion 7.6%
Latin America $15.29 Billion $30.59 Billion 7.1%

Competitive Landscape

Our findings suggest that the competitive landscape spans large diversified distributors and regional specialists competing on portfolio breadth, technical service depth, and logistics reach. Category | Assessment Market Structure | Moderately fragmented, with the top ten distributors accounting for a meaningful but non-dominant share of global revenue Innovation Focus | Digital procurement platforms, value-added formulation labs, and traceability systems M&A Activity | Active consolidation among mid-sized regional distributors acquiring specialty niche players Source: www.nextmsc.com

How Do Companies Compete in the Chemical Distribution Market?

Companies compete primarily on portfolio breadth, geographic warehousing coverage, and the depth of technical formulation support offered alongside product resale. Large diversified distributors leverage scale to negotiate favorable supplier terms, while regional specialists compete on responsiveness and local regulatory expertise. Pricing strategies increasingly incorporate bundled logistics and compliance services rather than commodity margin alone, reflecting the industry's shift toward value-added service delivery.

Which Competitive Archetypes Dominate the Chemical Distribution Industry?

Two archetypes dominate the chemical distribution industry: global diversified platforms such as Brenntag SE and Univar Solutions LLC that compete on scale and multi-category breadth, and specialty-focused distributors such as IMCD N.V. and Azelis Group NV that compete on technical formulation expertise. Regional players including Sunrise Group Corporation and DKSH Holding AG differentiate through localized logistics networks and market access in Asia-Pacific and emerging economies.

What Is the Innovation and Differentiation Strategy Across the Industry?

Leading distributors are investing in digital procurement portals, application laboratories, and sustainability-linked sourcing programs to differentiate beyond price. Innovation is concentrated in customer-facing technology that improves order visibility and formulation turnaround time. NMSC's analysis indicates that distributors integrating technical service capability into their commercial model are capturing a disproportionate share in categories such as coatings, adhesives, and water treatment chemicals.

How Active Is M&A in the Chemical Distribution Market?

Merger and acquisition activity remains active as diversified distributors acquire regional specialists to expand geographic reach and add technical capability. Consolidation is most pronounced among mid-sized European and Asian distributors seeking scale to compete with global platforms. HELM AG and Barentz International B.V. have both pursued targeted acquisitions to broaden specialty ingredient portfolios, reflecting continued industry-wide consolidation through 2035.

Key Market Players

Our analysis shows that the following companies represent the validated set of key market players evaluated for their portfolio breadth, geographic reach, and technical service capability in the chemical distribution market.

Brenntag SE Tricon Energy Inc. Univar Solutions LLC Sinochem Petrochemical Distribution Co., Ltd. Nagase & Co., Ltd. Sunrise Group Corporation IMCD N.V. Azelis Group NV HELM AG Kolmar Group AG Barentz International B.V. Caldic B.V. Snetor S.A.S. Stavian Chemical Joint Stock Company Stockmeier Holding SE Junan Resources Co., Ltd. DKSH Holding AG OQEMA AG Omya International AG Biesterfeld SE

Latest Developments

We observed that recent company activity across the chemical distribution industry has centered on capacity expansion, digital platform investment, and targeted specialty acquisitions.

Date Event
July 2026 Univar Solutions Acquires Interpur Chemicals, Expanding Access to Polyurethanes and Powder Coatings in EMEA . The addition strengthens the Performance Materials business within Ingredients + Specialties from Univar Solutions, expanding technical capabilities and regional coverage across EMEA.
May 2026 TA’ZIZ signed three agreements with Tricon covering exports of PVC, ethylene dichloride , and caustic soda, with a total value of up to USD 2.5 billion over seven years. Products originatedfrom TA’ZIZ’s planned Al Ruwais Industrial City facilities when operations commence in 2028.

Investment Opportunities

What Is Driving Capital Inflowsinto Chemical Distribution?

Private equity and strategic investors are directing capital toward mid-sized regional distributors with specialty portfolios and established customer relationships. The U.S. Securities and Exchange Commission's public filings show continued acquisition activity among publicly listed distribution platforms. Our assessment indicates that capital inflows are concentrated in businesses combining logistics scale with technical formulation capability, reflecting investor preference for defensible, service-differentiated margin.

How Significant Is Infrastructure Investment in Distribution Networks?

Distributors are expanding warehousing, blending, and cold-chain-adjacent storage infrastructure to support faster delivery and broader ingredient handling capability. This infrastructure investment is most pronounced in Asia-Pacific and Middle Eastern markets, where distributors are building multi-country hub networks to serve expanding manufacturing bases and reduce single-site supply concentration risk.

How Are ESG Considerations Shaping Investment Decisions?

Environmental, Social, and Governance considerations are increasingly embedded in investment screening, with acquirers favoring distributors that can document traceable sourcing and safe-handling compliance. Regulatory disclosure requirements under frameworks such as the European Union's Corporate Sustainability Reporting Directive are raising the bar for portfolio company reporting. We found that ESG-aligned distributors are commanding valuation premiums relative to peers lacking documented sustainability programs.

Key Benefits for Stakeholders

How Does This Report Benefit Industry Leaders?

Industry leaders gain access to validated 2025–2035 market sizing, segmentation, and competitive benchmarking that supports capacity planning and portfolio prioritization decisions. The report's regional and country-level analysis helps operational leaders identify where warehousing and technical service investment will generate the strongest demand-linked returns across the forecast period.

How Does This Report Benefit Investors and Financial Analysts?

Investors and financial analysts gain a structured view of market size, growth drivers, and competitive positioning that supports valuation and due diligence work. The report's segmentation and regional forecasts help analysts identify which distribution categories and geographies offer the strongest growth-adjusted return profiles through 2035.

How Does This Report Benefit Technology Vendors and Product Teams?

Technology vendors and product teams serving the distribution industry gain insight into which digital procurement, traceability, and inventory management capabilities are gaining adoption. The report's trend analysis helps vendors prioritize product development toward the workflows distributors are actively investing in through the forecast period.

Key Market Segments Evaluated

By Product Type

  • Commodity Chemicals
  • Polymers and Resins
  • Specialty Chemicals
  • Fine Chemicals and Active Ingredients
  • Food and Feed Ingredients
  • Personal Care and Cosmetic Ingredients
  • Agricultural Formulation Products
  • Other Distributed Chemical Products

By End-Use Industry

  • Chemical Manufacturing
  • Building and Construction
  • Automotive and Transportation
  • Water and Wastewater Treatment
  • Oil and Gas
  • Paints and Coatings
  • Agriculture
  • Pharmaceuticals and Healthcare
  • Personal Care and Cosmetics
  • Electronics and Electrical
  • Food and Beverage
  • Textiles and Leather
  • Mining and Metals
  • Pulp and Paper
  • Other Industrial Users

By Distribution Channel

  • Direct Sales
  • Agent and Broker Sales
  • Secondary Distribution

By Product Form

  • Liquid
  • Solid
  • Gas
  • Semi-Solid

Conclusion & Recommendations

The long-term outlook remains favorable, with the market expanding from USD 218.40 Billion in 2025 to USD 412.85 Billion by 2035 at a 6.6% CAGR. Our findings suggest that growth will remain broad-based across commodity and specialty categories, with specialty and fine chemical distribution outpacing the overall market as customers increasingly value technical formulation support over pure commodity resale through the forecast period.

What Strategic Positioning Should Distributors Pursue?

Distributors should prioritize building technical application capability and digital procurement infrastructure to defend margin against commoditized bulk resale competition. We recommend that mid-sized regional players pursue targeted specialty acquisitions to diversify beyond single-category exposure. Our analysis shows that platforms combining logistics scale with formulation expertise are best positioned to capture the USD 181.35 Billion-plus incremental opportunity available through 2035.

How Attractive Is the Chemical Distribution Market for Investment?

Investment attractiveness is strongest in specialty and fine chemical distribution segments, where 8.2% CAGR growth in Personal Care and Cosmetic Ingredients substantially outpaces the broader market average. Asia-Pacific, holding approximately 36% share, offers the largest absolute investment opportunity, while Middle East & Africa presents the fastest relative growth trajectory for market entrants seeking early-mover positioning.

What Are the Key Market Shifts and Risks?

Key shifts include the migration from commodity resale toward value-added technical distribution and rising regulatory documentation burden across cross-border trade. Principal risks include feedstock price volatility, fragmented regional approval requirements, and working-capital intensity associated with bulk inventory holding. NMSC's analysis indicates that distributors underinvesting in compliance infrastructure face rising competitive disadvantage as regulatory scrutiny intensifies through 2035.

What Are the Primary Growth Pathways?

Primary growth pathways include expanding specialty and electronics-grade chemical portfolios, deepening technical formulation service offerings, and building multi-country warehousing networks to serve diversifying manufacturing bases. Our findings suggest that distributors combining these pathways with sustainability-linked sourcing credentials will capture the largest share of the USD 181.35 Billion incremental value opportunity available between 2026 and 2035.

FAQs

About the Author

Jayanta Das

Jayanta Das

Jayanta Das is Senior Analyst at Next Move Strategy Consulting, where he has spent 4.5 years covering the firm's full industry taxonomy — spanning aerospace and defense, healthcare, BFSI, energy and power, semiconductors, and beyond — rather than one specialization. His work follows NextMSC's research model, combining data mining, analytics, and secondary research to build market sizing and forecasts behind NextMSC's 2,000-plus research reports, trusted by more than 3,000 organizations globally.

About the Reviewer

Supradip Baul

Supradip Baul

Supradip Baul is an accomplished business consultant and strategist with over a decade of rich experience in market intelligence, strategy, technology, and business transformation. His work has included rigorous qualitative and quantitative analysis across multiple industries, helping clients shape investment decisions and long-term roadmaps. Earlier in his career, he was associated with Gartner, where he contributed to industry-leading reports and market share analyses. He has worked with leading global companies and holds an MBA with a dual specialization in Marketing and Finance.

Download Free Sample

Rishabh Jogani

RISHABH JOGANI

Strategy Analyst

Accenture Japan

We are incredibly impressed with the market report on the real estate market in India provided by Next Move Strategy Consulting. The report was thorough, insightful, and well-structured, offering deep analysis and actionable recommendations. It not only captured the current trends and dynamics but also provided a forward-looking perspective that has been invaluable for our strategic planning. Their team demonstrated exceptional professionalism, attention to detail, and a profound understanding of the industry. The data-driven insights and clarity of presentation exceeded our expectations, making complex market trends easy to understand. We highly recommend Next Move Strategy Consulting to anyone looking for reliable and comprehensive market research services. Their expertise has given us the confidence to navigate the complexities of the Indian real estate market with clarity and foresight.

Semih Kavaklioglu

SEMIH KAVAKLIOGLU

Co-Founder & Sales Manager

Decortie

I work a lot in the marketing industry and I know that research is an essential part of any campaign. I have used Market research reports for my own products and I found them to be very informative and well-researched. The team here produces insightful reports for a good price

Ross J Mckenzie

ROSS J MCKENZIE

Business Insight Manager

Staysure Group

“Next MSC have been incredibly helpful in providing detailed & robust information on our market, alongside quantifying growth by different segments. The process to procure was simple and easy, with sample reports and regular contact to ensure we had what we needed. Succinct detail on their sources & methodologies is also greatly received, allowing transparency in this respect helps build trust in the detail you pay for. Joseph in particular was fantastic, and helped ensure efficient provision of the insight pack – thank you NMSC!”.

Robert Sean Trevino

ROBERT SEAN TREVINO

Sr. Director, Head of Strategic Insights & Analytics

Foundation Medicine

I realized that it was a reliable source of information. These days, there are many people who are looking for authentic data, and this is one of the only sources that can offer them with what they need;

Amos Chang

AMOS CHANG

Strategy Consultant

Kardex Group

I have bought the intralogistics market reports from NMSC two times so far. Joseph and his team are always very helpful and flexible in responding to any customization requirements on the report. Their expertise in market reports really helps us steer the day-to-day business. I will definitely recommend and come back myself whenever there is a need.

Custom Market Research Services

We will customize the research for you if the listed report does not fully match your requirements.

Get 30% Free Customization

Select License

This website uses cookies to ensure you get the best experience on our website. Learn more