Hardware Stores Retail Market

The global Hardware Stores Retail Market size was USD 1.95 trillion in 2025, projected to reach USD 3.09 trillion by 2035, growing at a CAGR of 4.55% from 2026 to 2035. Key growth drivers include rising professional contractor spending, distributor consolidation by major retailers, and increasing online sales, with North America leading the market with approximately 42% share.

Download Free Sample PDF
Base Year (2025)
$1.95 Trillion
Forecast (2035)
$3.09 Trillion
CAGR (2026-2035)
4.6%
Top Region
North America

What Is the Hardware Stores Retail Market Size?

The global hardware stores retail market size was valued at USD 1.95 trillion in 2025 and USD 2.07 trillion in 2026. NMSC projects the market will reach USD 3.09 trillion by 2035, a 4.55% CAGR from 2026 to 2035. Building Materials is the largest product category, at roughly 29% of 2025 revenue. North America leads regionally with approximately 42% share. Growth through 2035 is driven mainly by professional contractor spending, distributor consolidation by major retailers, and rising online sales. This report covers market size, segmentation by product category, store format, sales channel, and end user, regional performance, competitive positioning, and the 2026–2035 outlook.

The table below summarizes the market's largest and fastest-growing segment in each category, based on the segmentation and regional data presented in this report.

Hardware Stores Retail Market Revenue Forecast

Values in USD Trillion

2025 $1.95 Trillion
2025
2026 $2.04 Trillion
2026
2027 $2.13 Trillion
2027
2028 $2.23 Trillion
2028
2029 $2.33 Trillion
2029
2030 $2.44 Trillion
2030
2031 $2.55 Trillion
2031
2032 $2.66 Trillion
2032
2033 $2.78 Trillion
2033
2034 $2.91 Trillion
2034
2035 $3.09 Trillion
2035

Key Takeaways

By Product Category: Building Materials held the largest share of approximately 29% (USD 0.566 Trillion) in 2025; Storage Products is the fastest-growing category at 7.18% CAGR from 2026–2035.

By Store Format: Home Improvement Centers held the largest share of approximately 46% (USD 0.897 Trillion) in 2025; Specialty Stores is the fastest-growing format at 7.95% CAGR from 2026–2035.

By Sales Channel: Store Sales held the largest share of approximately 87% (USD 1.70 trillion) in 2025; Online Sales is the fastest-growing channel at 10.27% CAGR from 2026–2035.

By End User: Residential held the largest share of approximately 52% (USD 1.01 trillion) in 2025; Institutional is the fastest-growing end user at 7.18% CAGR from 2026–2035.

Dominant Region: North America dominated with approximately 42% revenue share (USD 0.819 Trillion) in 2025.

Fastest-Growing Region: Asia-Pacific is expected to register the highest CAGR of 7.39% during 2026–2035.

Dominant Country: U.S. led with approximately USD 0.672 Trillion in 2025.

Fastest-Growing Country: India is the fastest-growing country at approximately 9.8% CAGR from 2026–2035.

Market Opportunity: The hardware stores retail market will add USD 1.02 trillion in revenue between 2026 and 2035. Online sales and professional contractor channels will capture a disproportionate share of that growth, based on their above-average segment CAGRs.

NMSC's analysis indicates that retailers are shifting capital from new store openings toward acquiring specialty distributors that already serve professional contractors. This shift shows up directly in the acquisitions covered in this report's Latest Developments section, and it changes who competes with whom: a retailer with a distribution arm competes on job-site delivery speed, not just shelf price.

What Does the Hardware Stores Retail Market Encompass?

The hardware stores retail market encompasses home improvement centers, independent hardware stores, building material stores, and specialty stores that sell building materials, plumbing, electrical, tools, hardware, paints, adhesives, garden products, safety products, and storage products to residential, professional, commercial, and institutional customers. Our assessment indicates that the scope spans store-based and online sales channels, serving DIY homeowners, professional contractors, and facility management buyers across a wide range of product categories and store formats.

Market Drivers & Dynamics

Interactive Dataset
Rising professional contractor spending amid aging housing stock and deferred maintenance driver +1.6% North America, Europe 2026–2035
Expanding online sales and omnichannel fulfillment for both DIY and pro customers driver +1.4% Global 2026–2035
Growing home improvement retailer consolidation of specialty building material distribution driver +1.1% North America 2026–2032
Expanding urbanization and residential construction activity in emerging economies driver +0.9% Asia-Pacific, Middle East & Africa 2026–2035
Rising adoption of AI-powered digital ordering and inventory tools for professional buyers driver +0.7% North America, Europe 2027–2035
Growing demand for storage and organization products amid smaller urban living spaces driver +0.5% Global 2026–2033
Elevated mortgage rates constraining discretionary residential renovation spending restraint −0.9% North America, Europe 2026–2030
Tariff and trade policy volatility affecting imported building material and tool costs restraint −0.6% North America 2026–2030
Intense price competition among large-format home improvement retailers restraint −0.4% Global 2026–2032
Source: Next Move Strategy Consulting

Growth Drivers

What Is the Primary Growth Driver of the Hardware Stores Retail Market?

Aging housing stock forces repair spending regardless of the broader economy, and this is the market's most stable growth driver. The Home Depot, Inc. reported first-quarter fiscal 2026 sales of USD 41.8 billion, up 4.8% year over year, with professional customers outperforming DIY customers, according to company earnings disclosures. That gap matters: it shows the growth is coming from necessity-driven repair and maintenance, not discretionary remodeling, which explains why sales held up despite high mortgage rates discouraging major renovations.

How Does Distribution Consolidation Translate to Hardware Stores Retail Market Growth?

When a retailer acquires a distributor, it inherits that distributor's existing contractor accounts overnight, rather than winning them one by one through marketing. Lowe's Companies, Inc.'s agreement to acquire Foundation Building Materials for approximately USD 8.8 billion, following The Home Depot, Inc.'s prior purchase of SRS Distribution, follows this exact logic. The result is faster revenue growth from the professional segment than organic store-level sales could produce alone, which is why professional-channel growth is outpacing residential-channel growth across both companies' recent earnings reports.

Growth Inhibitors

What Is Restraining Hardware Stores Retail Market Growth?

Higher mortgage rates discourage homeowners from taking out home-equity financing for large remodeling projects, since financing costs eat into renovation budgets. Retailers have specifically flagged reduced big-ticket renovation demand even as routine repair and maintenance spending held steady. The practical effect is a split market: small-repair sales stay resilient while large discretionary projects, such as full kitchen remodels, are the first purchases homeowners delay. Retailers weighted toward big-ticket categories are more exposed to this restraint than retailers focused on repair and maintenance products.

Segmentation Analysis

2025 (USD Trillion)
2035 (USD Trillion)
Building Materials 2025: $0.57 Trillion | 2035: $0.83 Trillion
Building Mat
Hardware 2025: $0.25 Trillion | 2035: $0.37 Trillion
Hardware
Tools 2025: $0.23 Trillion | 2035: $0.40 Trillion
Tools
Electrical 2025: $0.18 Trillion | 2035: $0.31 Trillion
Electrical
Plumbing 2025: $0.18 Trillion | 2035: $0.28 Trillion
Plumbing
Paints 2025: $0.14 Trillion | 2035: $0.22 Trillion
Paints
Garden Products 2025: $0.14 Trillion | 2035: $0.22 Trillion
Garden Produ
Storage Products 2025: $0.08 Trillion | 2035: $0.15 Trillion
Storage Prod
Adhesives 2025: $0.08 Trillion | 2035: $0.12 Trillion
Adhesives
Safety Products 2025: $0.06 Trillion | 2035: $0.09 Trillion
Safety Produ
Others 2025: $0.06 Trillion | 2035: $0.09 Trillion
Others
Building Materials $0.57 Trillion $0.83 Trillion 3.73%
Hardware $0.25 Trillion $0.37 Trillion 3.63%
Tools $0.23 Trillion $0.40 Trillion 5.49%
Electrical $0.18 Trillion $0.31 Trillion 5.78%
Plumbing $0.18 Trillion $0.28 Trillion 4.55%
Paints $0.14 Trillion $0.22 Trillion 4.55%
Garden Products $0.14 Trillion $0.22 Trillion 4.55%
Storage Products $0.08 Trillion $0.15 Trillion 7.18%
Adhesives $0.08 Trillion $0.12 Trillion 4.55%
Safety Products $0.06 Trillion $0.09 Trillion 4.55%
Others $0.06 Trillion $0.09 Trillion 4.55%

Which Product Category Is Largest, and Which Is Growing Fastest?

Building Materials is the largest category at USD 0.566 Trillion in 2025, about 29% of total revenue. Lumber, roofing, and drywall sell in high volume because they are required inputs for nearly every repair or construction job, giving the category a stable, project-independent revenue base. Storage Products is the fastest-growing category at a 7.18% CAGR through 2035. Smaller urban homes leave less storage space, pushing homeowners toward shelving, garage storage, and closet systems. For retailers, this means storage merchandising, historically a secondary aisle, is becoming a category worth dedicated floor space and marketing.

2025 (USD Trillion)
2035 (USD Trillion)
Home Improvement Centers 2025: $0.90 Trillion | 2035: $1.36 Trillion
Home Improve
Hardware Stores 2025: $0.55 Trillion | 2035: $0.80 Trillion
Hardware Sto
Building Material Stores 2025: $0.27 Trillion | 2035: $0.43 Trillion
Building Mat
Specialty Stores 2025: $0.18 Trillion | 2035: $0.37 Trillion
Specialty St
Others 2025: $0.06 Trillion | 2035: $0.12 Trillion
Others
Home Improvement Centers $0.90 Trillion $1.36 Trillion 4.04%
Hardware Stores $0.55 Trillion $0.80 Trillion 3.69%
Building Material Stores $0.27 Trillion $0.43 Trillion 4.55%
Specialty Stores $0.18 Trillion $0.37 Trillion 7.95%
Others $0.06 Trillion $0.12 Trillion 7.95%

Which Store Format Leads, and Which Is Gaining Share Fastest?

Home Improvement Centers lead at USD 0.897 Trillion in 2025, roughly 46% of the market, because a single large-format store lets both DIY and professional customers complete a full project list in one visit. That convenience is the format's core competitive advantage over smaller specialty retailers. Specialty Stores are growing fastest, at a 7.95% CAGR, as professional buyers in trades like electrical and plumbing seek deeper product expertise and faster in-and-out service than a generalist superstore provides. This signals a bifurcation: large-format stores win on convenience, while specialty stores win on trade-specific expertise.

2025 (USD Trillion)
2035 (USD Trillion)
Store Sales
Company-Owne
Franchise St
Cooperative
Online Sales
Segment Item 2025 (USD Trillion) 2035 (USD Trillion) CAGR
Store Sales $10.0 USD Trillion $40.0 USD Trillion 27.0%
Company-Owned Stores $17.1 USD Trillion $51.1 USD Trillion 9.0%
Franchise Stores $24.2 USD Trillion $62.2 USD Trillion 19.0%
Cooperative Stores $31.3 USD Trillion $73.3 USD Trillion 17.0%
Online Sales $38.4 USD Trillion $84.4 USD Trillion 18.0%

Segment-wise data not detailed in this view

Unlock complete segment-wise numbers for By Sales Channel.

Unlock Full Data
2025 (USD Trillion)
2035 (USD Trillion)
Residential 2025: $1.01 Trillion | 2035: $1.51 Trillion
Residential
Professional 2025: $0.62 Trillion | 2035: $1.05 Trillion
Professional
Commercial 2025: $0.20 Trillion | 2035: $0.31 Trillion
Commercial
Institutional 2025: $0.08 Trillion | 2035: $0.15 Trillion
Institutiona
Others 2025: $0.04 Trillion | 2035: $0.06 Trillion
Others
Residential $1.01 Trillion $1.51 Trillion 3.86%
Professional $0.62 Trillion $1.05 Trillion 5.26%
Commercial $0.20 Trillion $0.31 Trillion 4.55%
Institutional $0.08 Trillion $0.15 Trillion 7.18%
Others $0.04 Trillion $0.06 Trillion 4.55%

Which End User Buys the Most, and Which Segment Is Growing Fastest?

Residential buyers account for USD 1.01 trillion in 2025, roughly 52% of the market, driven by ongoing repair and maintenance spending across owner-occupied homes. This spending is relatively recession-resistant, since deferred maintenance eventually becomes mandatory rather than optional. Institutional buyers, government, education, and healthcare facilities, are the fastest-growing end user at a 7.18% CAGR, as facility-maintenance budgets increasingly route through retail rather than direct-to-manufacturer procurement. For retailers, winning institutional accounts requires bulk pricing and dedicated account management, a different sales motion than serving walk-in consumers.

2025 (USD Trillion)
2035 (USD Trillion)
North Americ
Europe
Asia-Pacific
Middle East
Latin Americ
Segment Item 2025 (USD Trillion) 2035 (USD Trillion) CAGR
North America $10.0 USD Trillion $40.0 USD Trillion 24.0%
Europe $17.1 USD Trillion $51.1 USD Trillion 22.0%
Asia-Pacific $24.2 USD Trillion $62.2 USD Trillion 20.0%
Middle East & Africa $31.3 USD Trillion $73.3 USD Trillion 22.0%
Latin America $38.4 USD Trillion $84.4 USD Trillion 13.0%

Segment-wise data not detailed in this view

Unlock complete segment-wise numbers for By Region.

Unlock Full Data

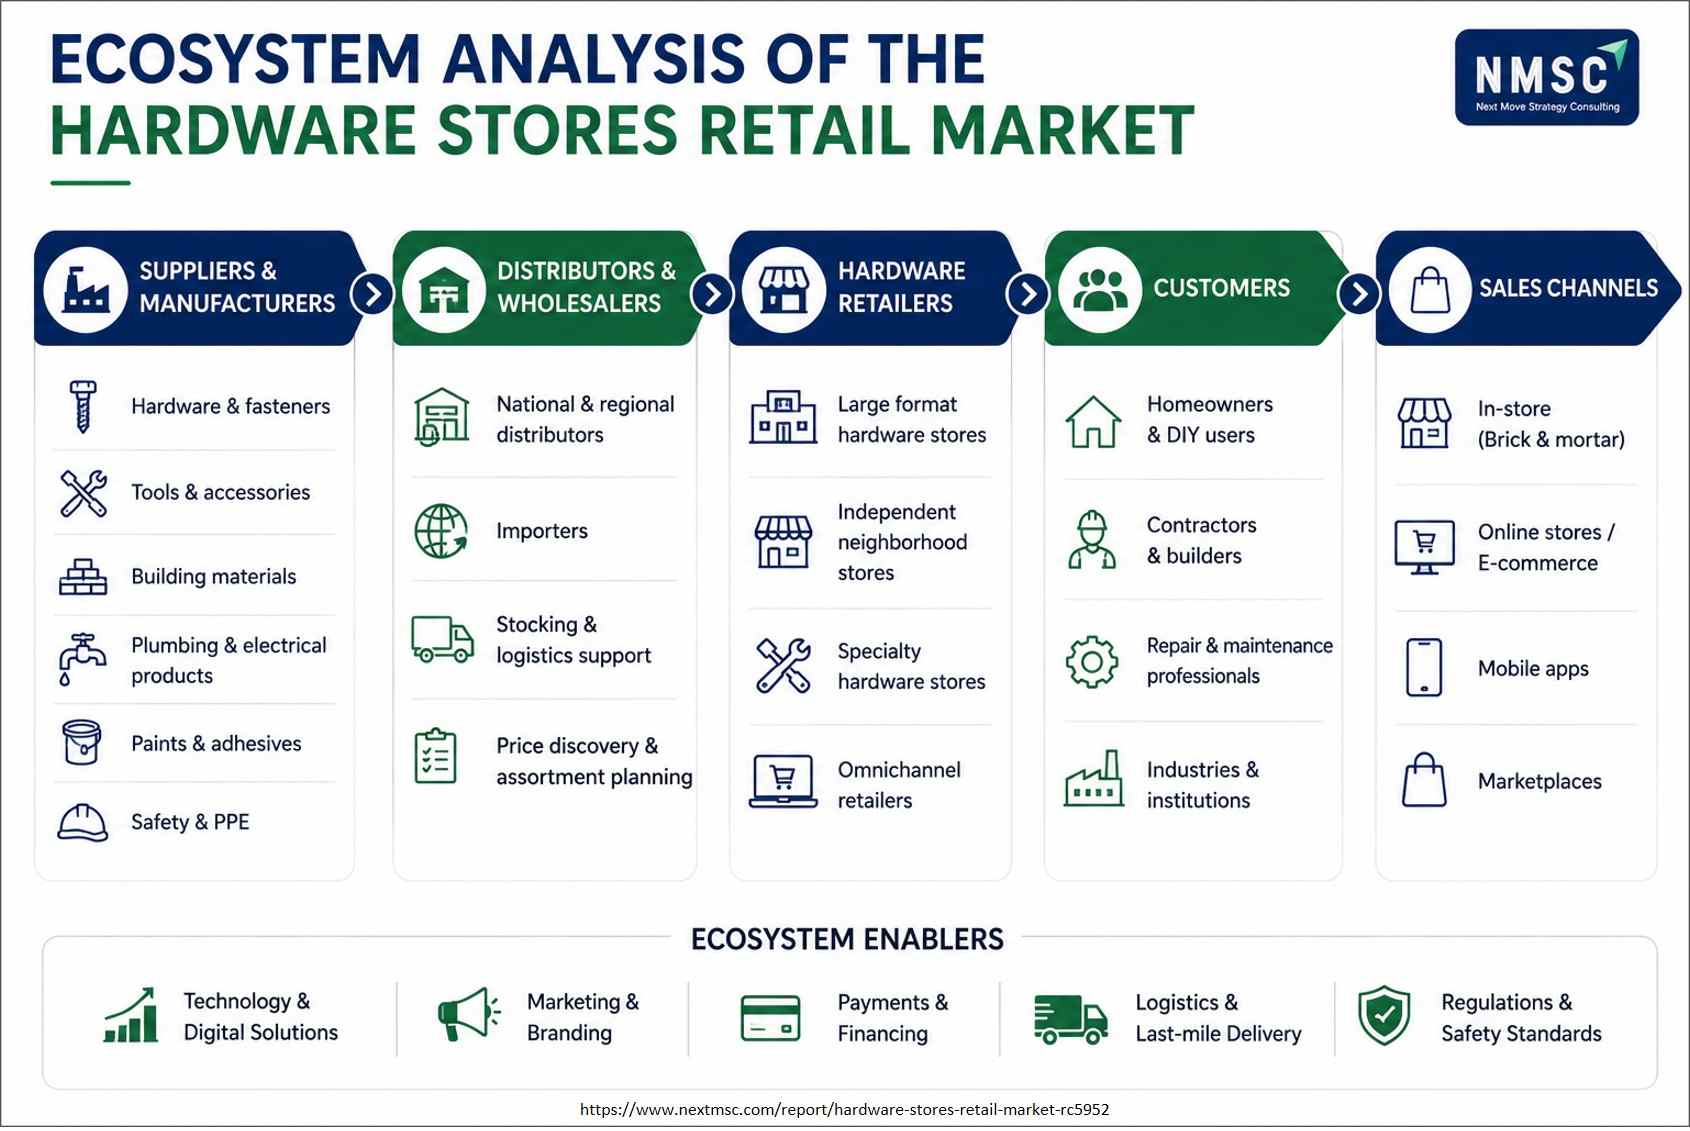
Ecosystem Analysis of the Hardware Stores Retail Market

The hardware stores retail market operates through an interconnected ecosystem of manufacturers, distributors, retailers, customers, and sales channels. Suppliers provide hardware, tools, building materials, plumbing, electrical products, paints, and safety equipment, while distributors support inventory and logistics. Retailers serve homeowners, contractors, and businesses through physical stores and increasingly integrated digital and omnichannel platforms.

Growth Opportunities

Our analysis shows that three forward-looking opportunities stand out for stakeholders positioning within the hardware stores retail market over the 2026-2035 forecast period.

Where Is the Clearest Opportunity in Pro Fulfillment Infrastructure?

Contractors switch suppliers over delivery reliability more than price. Retailers that build dedicated job-site delivery, credit terms, and easy reordering, spanning categories from building materials to lawn and garden consumables , can lock in recurring purchase volume that a price-only competitor cannot easily displace.

Where Is Storage and Organization Retail Underserved Today?

Urban housing is shrinking in square footage, and most hardware retailers still merchandise storage as an afterthought category. Retailers that expand cordless powered tools and garage-storage system offerings into dedicated floor space can capture demand from residential customers actively searching for space-saving solutions, a segment currently growing faster than the store's average category.

Why Is Institutional Procurement a Distinct Growth Channel?

Government, education, and healthcare facilities buy on annual maintenance budgets rather than per-project decisions, which makes institutional accounts more predictable than residential sales. Retailers that build dedicated institutional account management and bulk-pricing structures can convert this segment's 7.18% CAGR into a recurring, budget-driven revenue stream distinct from walk-in retail.

Regional Outlook

North America $0.82 Trillion $1.14 Trillion 3.09%
Europe $0.53 Trillion $0.74 Trillion 3.19%
Asia-Pacific $0.43 Trillion $0.87 Trillion 7.39%
Middle East & Africa $0.10 Trillion $0.19 Trillion 6.69%
Latin America $0.08 Trillion $0.15 Trillion 7.18%

Competitive Landscape

This Hardware Stores Retail Market splits into two competitive archetypes: large-format retailers that now compete on distribution and delivery, and regional or cooperative chains that compete on local service and community ties.

Dimension Description
Market Structure Moderately consolidated. The Home Depot, Inc. and Lowe's Companies, Inc. hold the largest share in North America; regional chains and cooperatives such as Ace Hardware Corporation and Do it Best Corp. serve markets these large-format retailers do not reach as efficiently.
Innovation Focus Professional contractor digital fulfillment platforms, job-site delivery infrastructure, and account-based reordering tools, not general e-commerce features, are where competitive investment is concentrated.
M&A Activity Active consolidation of specialty building material distribution, led by Lowe's Companies, Inc.'s agreement to acquire Foundation Building Materials for approximately USD 8.8 billion.

How Do The Home Depot and Lowe's Compete Against Each Other Specifically?

The Home Depot, Inc. and Lowe's Companies, Inc. both operate large-format stores, but their current competitive battle is over distribution ownership, not store count. The Home Depot moved first with its approximately USD 18 billion SRS Distribution acquisition; Lowe's answered with its approximately USD 8.8 billion Foundation Building Materials deal. Whichever company integrates its acquired distribution network faster will capture professional contractor accounts before the other, making integration speed, not deal size, the deciding competitive factor over the next two years.

How Do Regional Chains and Cooperatives Compete Against National Retailers?

Ace Hardware Corporation, Do it Best Corp., and Home Hardware Stores Limited use a cooperative model: independent store owners share purchasing power and branding while retaining local pricing and inventory control. This lets a cooperative member compete on neighborhood convenience and personalized service in locations too small to justify a big-box store, a segment large-format retailers structurally cannot serve profitably.

What Specific Investments Are Driving Competitive Differentiation Right Now?

The clearest differentiator today is job-site delivery infrastructure, not product assortment. The Home Depot, Inc.'s nationwide express delivery expansion and Lowe's Companies, Inc.'s Pro Extended Aisle both target the same problem: getting materials to a job site fast enough that a contractor does not lose a day of labor waiting on supplies. Retailers without comparable delivery capability are losing large commercial accounts regardless of their in-store pricing, which is why delivery investment, not price competition, is now the primary battleground among national retailers.

What Does the Pace of M&A Activity Signal About the Market's Direction?

Lowe's Companies, Inc.'s approximately USD 8.8 billion Foundation Building Materials deal, coming roughly 18 months after The Home Depot, Inc.'s approximately USD 18 billion SRS Distribution acquisition and subsequent GMS Inc. purchase, shows both national retailers converging on the same strategy at nearly the same time. This synchronized timing suggests the professional contractor segment has become the primary battleground for growth, with both companies concluding that organic store expansion alone cannot capture it fast enough.

Key Market Players

Our assessment indicates that the following 20 companies are actively shaping product innovation, capacity expansion, and go-to-market strategy within the global hardware stores retail market.

Lowe's Companies, Inc . ADEO Group Kingfisher plc Bunnings Group Limited Ace Hardware Corporation Menard, Inc. OBI Group Holding SE & Co. KGaA BAUHAUS AG HORNBACH Holding AG & Co. KGaA Travis Perkins plc Wickes Group plc RONA inc. Home Hardware Stores Limited CAINZ CORPORATION DCM Holdings Co., Ltd. Komeri Co., Ltd. Konan Shoji Co., Ltd. Do it Best Corp. Groupe BMR Inc.

Latest Developments

We found that recent M&A activity, financial results, and digital fulfillment investment within the hardware stores retail market are concentrated on professional contractor distribution expansion, reflecting the industry's active capitalization cycle.

Date Event
August 2026 Home Depot expanded Magic Apron’s localized store knowledge nationwide across its 2,000+ U.S. stores, combining AI-powered project guidance with store-specific product wayfinding, availability checks, image uploads, voice-to-text and multilingual interactions. The initiative strengthens in-store assistance by connecting digital discovery with physical store navigation and purchasing.
August 2026 Home Depot expanded Express Delivery nationwide across U.S. markets, using more than 2,000 stores as neighborhood fulfillment hubs. Customers can receive thousands of plumbing, electrical, hardware, paint, tools and project-supply SKUs in three hours or less, raising expectations for rapid omnichannel fulfillment in hardware retail.
March 2026 Kingfisher and Google Cloud announced a multi-year partnership to deploy Vertex AI across B&Q, Castorama and Brico Dépôt e-commerce platforms. The initiative introduces conversational search and planned AI shopping agents capable of helping customers build project lists and complete purchases, advancing digital customer experience across European home-improvement retail.
January 2026 Bunnings opened a 40,000-square-metre distribution centre at North Maclean, Queensland, storing full pallets, timber, bulk products and seasonal inventory. The facility is designed to improve stock flow, product availability and delivery operations while reducing third-party storage, supporting stronger fulfillment capacity for Queensland DIY and trade customers.
October 2025 Lowe’s completed its acquisition of Foundation Building Materials, adding more than 370 locations across the United States and Canada. Lowe’s expects the combination to expand Pro assortment, accelerate fulfillment, strengthen digital tools and trade credit, and create cross-selling opportunities, materially broadening its professional hardware and building-supply reach.

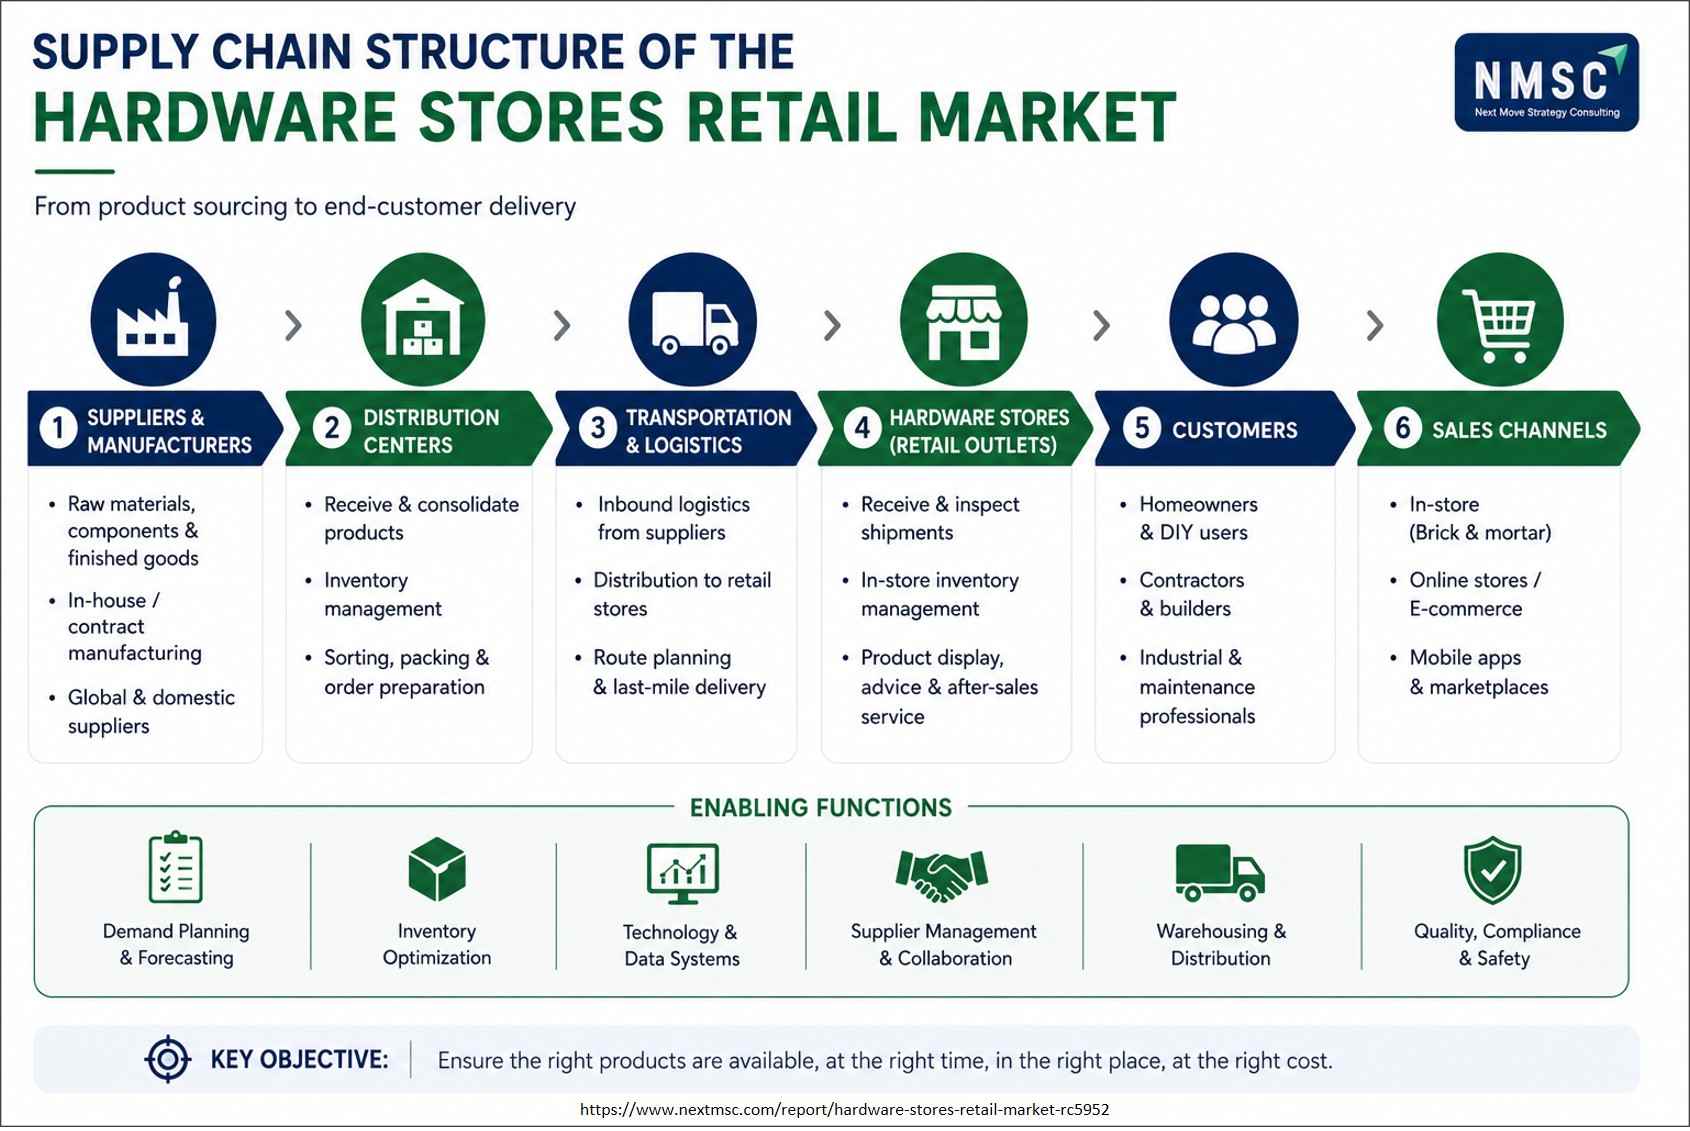
Supply Chain Structure of the Hardware Stores Retail Market

Supply Chain Structure of the Hardware Stores Retail Market

The hardware stores retail market supply chain spans product sourcing, distribution, transportation, retail operations, and end-customer fulfillment. Manufacturers and suppliers provide products to distribution centers, where inventory is consolidated and prepared for delivery. Logistics networks transport products to hardware stores, which manage inventory and customer service before fulfilling purchases through in-store, e-commerce, mobile, and marketplace channels.

Investment Opportunities

Where Is Capital Actually Flowing in This Market Right Now?

Retailers are increasingly directing capital toward specialty distribution acquisitions, fulfillment infrastructure, and digital capabilities that strengthen their professional-contractor offerings. Lowe's Companies, Inc.'s approximately USD 8.8 billion Foundation Building Materials acquisition and The Home Depot, Inc.'s approximately USD 18 billion SRS Distribution acquisition illustrate the industry's growing focus on expanding access to professional customers and strengthening distribution networks.

What Infrastructure Investment Is Supporting This Growth?

Retailers are investing in distribution centers, delivery fleets, and integrated fulfillment systems to improve product availability and shorten delivery times for professional customers. The Home Depot, Inc.'s nationwide Express Delivery expansion demonstrates how retailers are using their store networks as fulfillment hubs to support faster omnichannel service.

How Does Tariff Exposure Factor Into Investment Risk Here?

A large share of tools, hardware, and fasteners sold in this market are imported, which makes retailer margins directly exposed to trade policy changes. Retailers disclosing diversified, multi-country sourcing strategies are managing this risk more actively than retailers concentrated in single-country supply chains, and that sourcing diversification is a reasonable proxy for supply-chain governance quality when evaluating investment risk.

Key Benefits for Stakeholders

What Does This Report Give Enterprise and Retail Leaders?

Retail and merchandising teams get segment-level revenue splits by product category, store format, and end user, tied to a specific 2025-2035 forecast rather than general market commentary. This lets a merchandising team justify a specific floor-space reallocation, for example, expanding storage products, with a growth-rate figure rather than a hunch.

What Does This Report Give Investors and Financial Analysts?

Analysts get consistent, single-point size and CAGR estimates by region and segment, which support valuation models without requiring analysts to reconcile conflicting figures from multiple sources. The regional growth gap, 7.39% in Asia-Pacific versus 3.09% in North America, is the clearest single data point for identifying where above-market growth is available.

What Does This Report Give Technology Vendors and Product Teams?

Vendors building retail software get evidence for which features actually drive retention: account-based reordering and delivery tracking, not general-purpose e-commerce, based on the tools leading retailers are actually deploying. This should shift product roadmaps away from generic online-store features and toward contractor account management.

Key Market Segments Evaluated

By Product Category

  • Building Materials
  • Hardware
  • Tools
  • Electrical
  • Plumbing
  • Paints
  • Garden Products
  • Storage Products
  • Adhesives
  • Safety Products
  • Others

By Store Format

  • Home Improvement Centers
  • Hardware Stores
  • Building Material Stores
  • Specialty Stores
  • Others

By Sales Channel

  • Store Sales
  • Company-Owned Stores
  • Franchise Stores
  • Cooperative Stores
  • Online Sales
  • Company E-Commerce
  • Marketplace E-Commerce

By End User

  • Residential
  • Professional
  • Commercial
  • Institutional
  • Others

By Region

  • North America
  • Europe
  • Asia-Pacific
  • Middle East & Africa
  • Latin America

Conclusion & Recommendations

The market will grow from USD 1.95 trillion in 2025 to USD 3.09 trillion by 2035, a 4.55% CAGR. Growth will not be evenly distributed: online sales (10.27% CAGR) and Asia-Pacific (7.39% CAGR) will grow roughly twice as fast as the market overall, while North America (3.09% CAGR) grows below the global average despite remaining the largest region in absolute dollars.

How Should Vendors Position Themselves Strategically?

Vendors should prioritize job-site delivery and account-based digital ordering over general store expansion, since these are the specific investments driving professional-segment share gains today. Building or acquiring distribution capability, as both The Home Depot, Inc. and Lowe's Companies, Inc. have done, is the clearest path to defending share against a competitor that already has it.

Is This Market Attractive for New Investment?

Yes, selectively. The USD 1.02 trillion revenue opportunity between 2026 and 2035 is concentrated in online sales and the professional contractor channel, not the market broadly. Investment attractiveness is highest for retailers or distributors that already serve professional accounts, since that customer relationship is harder for a new entrant to replicate than store square footage.

What Are the Key Risks to This Outlook?

The clearest risk is renewed mortgage-rate increases, which would further suppress discretionary big-ticket renovation spending beyond current levels. A secondary risk is tariff escalation on imported tools and hardware, which would compress margins for retailers with concentrated single-country sourcing. Retailers most exposed to both risks are those weighted toward big-ticket residential categories with single-source import dependency.

What Are the Clearest Growth Pathways to 2035?

Three pathways stand out based on this report's segment data: expanding professional-contractor digital fulfillment, scaling online sales infrastructure specifically for account-based reordering, and building institutional procurement relationships with government, education, and healthcare buyers. Retailers pursuing multiple pathways simultaneously, as The Home Depot, Inc. and Lowe's Companies, Inc. are currently doing, are best positioned to capture above-market growth through 2035.

FAQs

About the Author

Mihul Sharma

Mihul Sharma

Mihul Sharma is Research Associate at Next Move Strategy Consulting, where he has covered technology, industrial, and healthcare markets for 3 years. His work applies structured business research, market analysis, and secondary-source review to assess market trends, competitive developments, and growth opportunities. He supports report development by fully synthesizing industry data, company information, and market signals into concise findings for strategy and investment-focused research teams.

About the Reviewer

Supradip Baul

Supradip Baul

Supradip Baul is an accomplished business consultant and strategist with over a decade of rich experience in market intelligence, strategy, technology, and business transformation. His work has included rigorous qualitative and quantitative analysis across multiple industries, helping clients shape investment decisions and long-term roadmaps. Earlier in his career, he was associated with Gartner, where he contributed to industry-leading reports and market share analyses. He has worked with leading global companies and holds an MBA with a dual specialization in Marketing and Finance.

Download Free Sample

Diana Trejo

DIANA TREJO

Assistant Manager

Sumitomo Corporation de Mexico, S.A. de C.V.

Recently, we purchased a report on the Mexico Data Center Market from Next Move Strategy Consulting. The service has been excellent, with support that is always timely and thoroughly professional. The information provided is interesting, highly useful, and delivered with clarity. I would highly recommend NextMSC for anyone seeking insightful and dependable analysis.

Ross J Mckenzie

ROSS J MCKENZIE

Business Insight Manager

Staysure Group

“Next MSC have been incredibly helpful in providing detailed & robust information on our market, alongside quantifying growth by different segments. The process to procure was simple and easy, with sample reports and regular contact to ensure we had what we needed. Succinct detail on their sources & methodologies is also greatly received, allowing transparency in this respect helps build trust in the detail you pay for. Joseph in particular was fantastic, and helped ensure efficient provision of the insight pack – thank you NMSC!”.

Pratyush Kumar Das

PRATYUSH KUMAR DAS

Assistant Manager

Polycab India Limited

We would like to express our appreciation for the data and insights provided by nextmsc. We are very pleased with the quality and depth of the information, which has proven to be highly valuable and beneficial for our business decision-making.

Gustaf Hummel Burstrom

GUSTAF HUMMEL BURSTROM

Founder

Revline Tools AB

Joseph and the team at Next Move Strategy Consulting have been excellent to work with, in supplying us with relevant market data and forecasts for our specific category. We had some special requirements and they were able to do a custom package to suit our needs. We would definitely recommend them to any other company needing market data and forecasts

Semih Kavaklioglu

SEMIH KAVAKLIOGLU

Co-Founder & Sales Manager

Decortie

I work a lot in the marketing industry and I know that research is an essential part of any campaign. I have used Market research reports for my own products and I found them to be very informative and well-researched. The team here produces insightful reports for a good price

Custom Market Research Services

We will customize the research for you if the listed report does not fully match your requirements.

Get 30% Free Customization

Select License

This website uses cookies to ensure you get the best experience on our website. Learn more