Key Takeaways
- Two separate regimes, not one tariff. Proclamation 11002 (effective Jan 15, 2026) sets a 25% duty on narrowly defined advanced logic chips; Proclamation 11021 (effective Apr 6) and 11032 (effective Jun 8) govern steel, aluminum and copper at 50%, 25%, 15% or 10%.
- The June revision matters more than April. Steel racks became a dutiable 25% derivative on June 8, 2026, and the U.S.-origin threshold for the 10% rate fell from 95% to 85%.
- Modeled exposure is concentrated in Core & Shell. On a $1.13B, 100MW reference build, a 50% imported-steel assumption implies about $39.6M, or 3.5% of facility cost. This is a labeled scenario, not an observed tariff bill.
- Domestic melt-and-pour is the largest lever. At a 10% rate the same exposure falls from $79.1M to $15.8M at 100% imported share, an 80% reduction, if classification and origin documentation qualify.
- Section 232 is not the dominant cost driver. Transformer lead times of about 36 months, skilled-labor shortages and power availability weigh more for most projects.
Two Section 232 Regimes, One Facility
Treating "Section 232" as a single tariff with a single rate is the most common error in public commentary. A 100MW data hall sits under two programs that were investigated separately, enacted on different timelines and amended independently. A facility can clear the GPU exemption and still owe full derivative duty on the steel rack that holds the GPU.
Semiconductors: 25% unless an exception applies
Proclamation 11002 (January 14, 2026) applies a 25% duty under HTSUS 9903.79.01 to logic integrated circuits that meet specific Tensor Processing Performance and DRAM-bandwidth thresholds. A 0% treatment under 9903.79.03 applies to covered chips imported for a qualifying U.S. data center requiring more than 100MW of new load dedicated to AI training, inference, simulation or synthetic data generation. The test is facility-level and load-based, not campus nameplate capacity, and a facility at exactly 100MW does not meet the literal threshold.
Metals: enumeration, not metal content
The metals framework works by HTSUS classification. A product is dutiable only if its classification appears on a covered annex, and containing steel is necessary but not sufficient. CBP guidance confirms that steel content inside a finished electrical assembly does not by itself make the assembly dutiable at the metal rate.
| Date | Event |
|---|---|
| Mar 8, 2018 | Proclamations 9704 (aluminum) and 9705 (steel) create the national-security finding and derivative-product mechanism |
| Jul 30, 2025 | Proclamation 10962 extends the architecture to copper and copper derivatives |
| Dec 22, 2025 | Commerce transmits the semiconductor Section 232 report |
| Jan 14–15, 2026 | Proclamation 11002 imposes the 25% semiconductor duty, effective Jan 15; U.S.–Taiwan reshoring agreement announced |
| Apr 2–6, 2026 | Proclamation 11021 restructures the metals regime on a full-customs-value basis, effective Apr 6 |
| Jun 1–8, 2026 | Proclamation 11032 adds steel racks and aluminum lithographic plates and lowers the U.S.-origin threshold to 85%, effective Jun 8 |
| Dec 31, 2027 | Sunset of the temporary 15% Annex III reduced-rate categories |
Source basis: Federal Register proclamations and CBP CSMS #67400472 and #68855869, as compiled in the NextMSC research file.
Source: https://www.nextmsc.com/industry-deep-dive/section-232-100mw-data-hall-cost
Two metals revisions arrived about nine weeks apart on top of a semiconductor program that did not exist before January. For a multi-year build, that cadence is itself a planning variable: duty attaches at entry for consumption, so equipment ordered under one version of the rules can arrive under another.
Statutory Rate Structure
| Metals category | Rate | Instrument |
|---|---|---|
| Articles entirely or almost entirely of steel, aluminum or copper (e.g. structural beams) | 50% | Proc. 11021 |
| Covered derivatives on the annexes, including steel racks since Jun 8, 2026 | 25% | Proc. 11021 as amended by 11032 |
| Temporary: agricultural equipment, residential HVAC, select industrial machinery | 15% | Sunsets Dec 31, 2027 |
| Derivatives with at least 85% U.S.-melted-and-poured or smelted-and-cast content | 10% | Threshold lowered from 95% |
Source: Proclamations 11021 and 11032; CBP CSMS #68855869. Applicable rate depends on the specific HTSUS and Chapter 99 heading.
Source: https://www.nextmsc.com/industry-deep-dive/section-232-100mw-data-hall-cost
Figure 1. Section 232 Metals Rate Tiers (% ad valorem)
Unit: additional duty, % of full customs value; Proclamation 11021 as amended.
Source: https://www.nextmsc.com/industry-deep-dive/section-232-100mw-data-hall-cost
Semiconductor schedule: nine HTSUS lines, one dutiable
| HTSUS | Covers | Rate |
|---|---|---|
| 9903.79.01 | Covered logic ICs meeting TPP and DRAM-bandwidth thresholds | 25% |
| 9903.79.02 | Same provisions, technical parameters not met | 0% |
| 9903.79.03 | Use in a qualifying data center with more than 100MW of new dedicated AI load | 0% |
| 9903.79.04–.06 | Repair or replacement, R&D, qualifying U.S. startup use | 0% |
| 9903.79.07–.09 | Consumer electronics, civil industrial use, U.S. public-sector use | 0% |
Source: CBP CSMS #67400472. No drawback is available for semiconductor duties, and Foreign Trade Zone admission requires privileged foreign status.
Source: https://www.nextmsc.com/industry-deep-dive/section-232-100mw-data-hall-cost
Myth versus record
Steel racks were outside the derivative scope for a five-week window, April 6 to June 7, 2026. Since June 8 they are enumerated at 25% under HTSUS 9403.20.0075, 9403.20.0082 and 9403.99.9040. Analyses dated before June 2026 that call racks excluded describe a superseded snapshot.
Component-Level Classification
This matrix summarizes how common data-hall categories resolve. It deliberately assigns no blended dollar figure to equipment whose treatment depends on the actual imported article.
| Component | Treatment under the framework | What to confirm |
|---|---|---|
| Structural steel | Generally the 50% "almost entirely steel" tier; potentially 10% with documented 85% U.S. melt-and-pour origin | Classification and origin documentation |
| Steel server racks | 25% derivative since Jun 8, 2026 | Update IT fit-out cost models still using April assumptions |
| Generators | HTSUS 8502.20.00 (spark-ignition sets) is enumerated; diesel sets may classify elsewhere | Engine type and exact HTSUS line |
| UPS and switchgear | No blanket rate; classification-specific | Binding ruling for high-value, long-lead items |
| Chillers, CRAH, compressors | Case-specific by refrigerant, capacity class and assembly form | Specified models, not category averages |
| Transformers | No blanket category rate; lead times about 36 months | Entry date versus order date |
| GPUs and accelerators | 25% unless a 9903.79 exception applies, e.g. the >100MW data-center use | Technical thresholds and qualifying end use, confirmed separately |
Source: NextMSC synthesis of CBP guidance and Proclamations 11002, 11021 and 11032.
Source: https://www.nextmsc.com/industry-deep-dive/section-232-100mw-data-hall-cost
| Element | April 2026 (Proc. 11021) | June 2026 (Proc. 11032, eff. Jun 8) |
|---|---|---|
| Steel racks | Not separately enumerated | Added under HTSUS 9403.20.0075, .0082, 9403.99.9040 at 25% |
| Aluminum lithographic plates | Not separately enumerated | Added under HTSUS 3701.30.00 |
| U.S.-origin threshold for 10% rate | 95% of relevant metal weight | Lowered to 85% |
| Reduced 15% rate scope | Narrower industrial machinery set | Expanded to agricultural equipment, residential HVAC and an Annex I-C mobile-equipment framework |
Source: Proclamations 11021 and 11032; CBP CSMS #68855869.
Source: https://www.nextmsc.com/industry-deep-dive/section-232-100mw-data-hall-cost
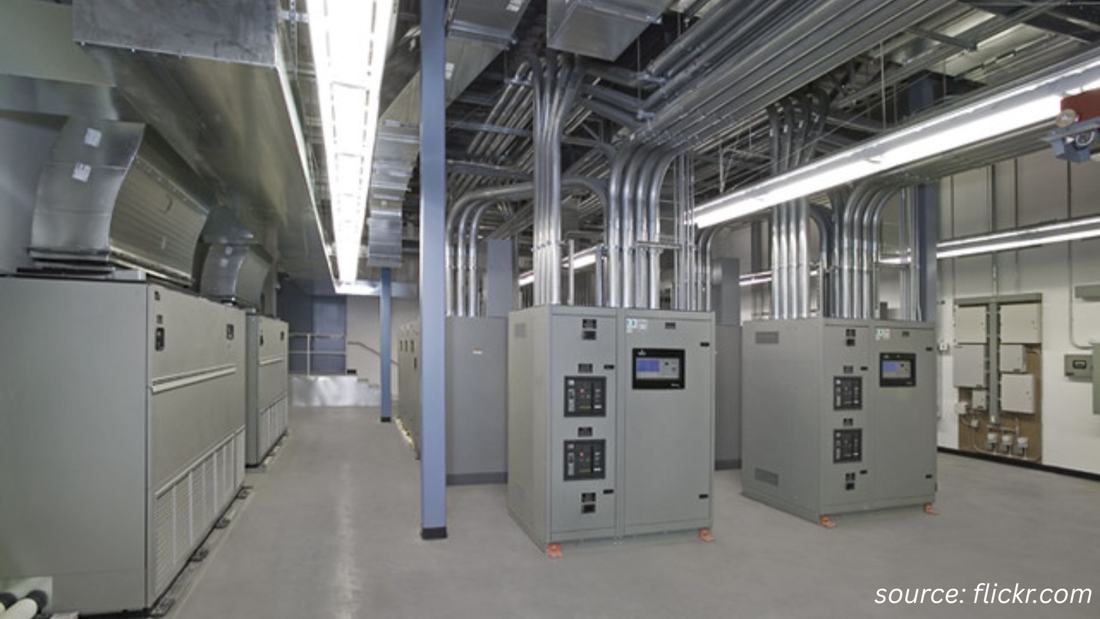
Source: https://www.nextmsc.com/industry-deep-dive/section-232-100mw-data-hall-cost
The Exposure Model
Every input is tiered. Tier A is regulatory or government data, Tier B is a named third-party benchmark, and Model is a calculation from those inputs. The one input with no public source, the imported share of a project's structural steel, is tested across its full range.
Step 1 and 2: benchmark and cost-category split
JLL reports a 2026 global shell-and-core cost of $11.3M per MW, up from $10.7M in 2025 (Tier B). Scaled to 100MW this gives a $1.13B reference base; JLL does not publish a 100MW project cost, so this is a scaled calculation. Turner & Townsend's air-cooled split allocates the base as follows.
| Category | Share | $M of $1,130M | Statutory treatment |
|---|---|---|---|
| Electrical | 54% | 610.2 | Mixed, case-specific by HTSUS classification |
| Mechanical | 22% | 248.6 | Mixed, case-specific by HTSUS classification |
| Core & Shell | 14% | 158.2 | Structural steel at 50% (10% if 85% U.S. origin documented) |
| GC / Preliminaries | 10% | 113.0 | Largely labor and overhead |
Source: JLL Global Data Center Outlook 2026; Turner & Townsend Data Centre Construction Cost Index 2025–2026; NextMSC calculation.
Source: https://www.nextmsc.com/industry-deep-dive/section-232-100mw-data-hall-cost
Step 3 and 4: formula and sensitivity
Exposure = Core & Shell cost × imported share × statutory rate. Because no benchmark isolates structural steel inside Core & Shell, the full $158.2M allocation serves as the modeled tariff-exposed base, so results are upper-bound-style scenarios.
| Imported share | Exposure at 50% rate ($M) | Exposure at 10% rate ($M) | % of facility cost (50% rate) |
|---|---|---|---|
| 0% | 0.00 | 0.00 | 0.00% |
| 25% | 19.77 | 3.96 | 1.75% |
| 50% | 39.55 | 7.91 | 3.50% |
| 75% | 59.32 | 11.87 | 5.25% |
| 100% | 79.10 | 15.82 | 7.00% |
Source: NextMSC model on the Tier B benchmark; imported shares are scenario assumptions, not sourced observations.
Source: https://www.nextmsc.com/industry-deep-dive/section-232-100mw-data-hall-cost
Figure 2. Modeled Structural-Steel Exposure by Imported Share ($M)
Unit: $M on a $1.13B, 100MW reference facility; Core & Shell base $158.2M.
Source: https://www.nextmsc.com/industry-deep-dive/section-232-100mw-data-hall-cost
Reading the lever. If at least 85% of the steel is U.S.-melted-and-poured and classification supports it, the rate is one-fifth of the base: $15.8M instead of $79.1M at full import share. A reduced rate is not an exemption.
Step 5: scaling to other facility sizes
| Facility size | Modeled cost ($M) | Core & Shell 14% ($M) | Exposure at 50% imported ($M) |
|---|---|---|---|
| 50 MW | 565 | 79.1 | 19.78 |
| 100 MW (reference) | 1,130 | 158.2 | 39.55 |
| 300 MW | 3,390 | 474.6 | 118.65 |
| 500 MW | 5,650 | 791.0 | 197.75 |
Source: NextMSC model; constant 14% Core & Shell share is an extrapolation of Turner & Townsend's air-cooled reference facility.
Source: https://www.nextmsc.com/industry-deep-dive/section-232-100mw-data-hall-cost
The ratio stays at 3.5% of facility cost because the inputs do not change with size. Real projects will differ with cooling architecture, procurement mix and import share, which is why line-item classification review beats a blended percentage. The model does not price racks or IT fit-out, which JLL excludes from its benchmark and prices separately at up to $25M per MW.
Macro Indicators: Spending and Steel Prices
Census data show private data-center construction spending at a seasonally adjusted annual rate of $50.7B in April 2026, up 28.0% from $39.6B a year earlier and 79.2% above April 2024. The series is recent, with limited historical depth, and April 2025 appears at roughly $39.6–39.8B across data vintages.
Figure 3. U.S. Data-Center Construction Spending, April of Each Year ($B, SAAR)
Unit: $B, seasonally adjusted annual rate, not inflation-adjusted; private sector. Table C30.
Source: https://www.nextmsc.com/industry-deep-dive/section-232-100mw-data-hall-cost
The BLS producer price index for fabricated structural iron and steel rose from 202.8 in October 2025 to 251.3 in August 2026, a 23.9% increase; the June 2026 reading of 236.5 was already 16.6% higher. The series is not seasonally adjusted and subject to revision.
Figure 4. BLS Structural-Steel PPI, Oct 2025–Aug 2026 (Index, Jun 2011 = 100)
Unit: index, Jun 2011 = 100, not seasonally adjusted; FRED vintage retrieved Sep 16, 2026. Series PCU33231233231212.
Source: https://www.nextmsc.com/industry-deep-dive/section-232-100mw-data-hall-cost
Both series rise around the April and June proclamations, consistent with tighter steel input costs on top of strong demand. The data cannot assign a causal share to Section 232, because the PPI also reflects broader steel-market conditions and general inflation.
What else drives cost
Industry research reports monthly data-center construction starts averaging about $10.1B through March 2026 and average equipment lead times near 33 weeks, about 50% above pre-2020 levels. JLL expects AI workloads to approach half of global data-center capacity by 2030. Power availability is repeatedly cited as the binding constraint, ahead of tariffs.
Procurement Playbook
- Classify before award. For transformers and switchgear, a CBP binding ruling is the most authoritative resolution, and ruling timing should be built into the schedule.
- Document domestic content. The 85% threshold is a real pathway for specified derivative steel articles, but should not be assumed for structural steel or every steel-containing item.
- Track entry dates, not order dates. Duty attaches at entry for consumption; April 6, June 8 and December 31, 2027 are the dates to map against deliveries.
- Keep the two tracks separate. Do not blend GPU and physical-infrastructure tariff exposure into one line.
- Name the proclamation in contracts and assign who bears reclassification risk, with a change-in-law clause tied to HTSUS lines.
- Coordinate construction and IT procurement. Rack sourcing often sits outside construction teams and was exposed by the June change.
- Keep origin records. A reduced-rate claim without retrievable melt-and-pour documentation is a compliance exposure on its own.
Where this does not travel
Section 232 is U.S.-specific. The EU's Carbon Border Adjustment Mechanism taxes embedded carbon rather than national-security exposure, so a domestic melt-and-pour strategy does not transfer to a European project. Construction costs also vary widely: JLL cites premium markets above $15M per MW and some emerging markets below $8M. U.S. duty rates do not vary by metro; the dollar base does.
What This Analysis Does Not Claim
- It produces no single "total Section 232 cost of a 100MW data hall," because that needs imported-share and electrical and mechanical rate assumptions no public source supports.
- It assigns no blanket rate to generators, UPS systems or switchgear.
- It does not attribute a specific share of the steel PPI rise to Section 232.
- It does not treat the 100MW exemption or the reduced-rate schedule as permanent; both remain open to Commerce reporting and the December 31, 2027 sunset.
- It is a screening framework, not customs or legal advice, and not a substitute for a CBP binding ruling or a licensed customs broker.
Need this model run on your own build?
NextMSC analysts can apply your cooling architecture, procurement mix and import shares. See also the NextMSC Data Center Cooling Market report.
Dataset Explorer and Export
Filter the company, policy, procurement, fleet and supply data compiled for this article, then export the full dataset as CSV. Every record is labeled as reported, calculated, forecast or target.
0 records shown
| Category | Entity | Metric | Value | Unit | Period | Type | Source |
|---|
The CSV includes all 13 fields, including source document, source date and notes. NextMSC calculations are marked "Calculated".
Source: https://www.nextmsc.com/industry-deep-dive/section-232-100mw-data-hall-cost
Methodology and Data Note
Data cut-off: September 16, 2026 (workbook retrieval); published October 1, 2026; planned refresh quarterly. Tier A: Federal Register proclamations, CBP CSMS guidance, Census Table C30 and BLS series PCU33231233231212 via FRED. Tier B: JLL and Turner & Townsend benchmarks, named inline. Model: calculations from those inputs, with the formula Exposure = customs value × applicable rate on enumerated lines only. JLL's benchmark covers shell-and-core for a single-tenant 50MW air-cooled facility and excludes land and active IT equipment; liquid cooling carries about a 10% premium and multistory AMER builds about 20%. Modeled figures illustrate exposure mechanics and are not a classification review of any actual procurement package.
About the Author
 Mihul Sharma
— Mihul Sharma is Research Associate at Next Move Strategy Consulting, where he has covered technology, industrial, and healthcare markets for 3 years. His work applies structured business research, market analysis, and secondary-source review to assess market trends, competitive developments, and growth opportunities. He supports report development by fully synthesizing industry data, company information, and market signals into concise findings for strategy and investment-focused research teams.
Mihul Sharma
— Mihul Sharma is Research Associate at Next Move Strategy Consulting, where he has covered technology, industrial, and healthcare markets for 3 years. His work applies structured business research, market analysis, and secondary-source review to assess market trends, competitive developments, and growth opportunities. He supports report development by fully synthesizing industry data, company information, and market signals into concise findings for strategy and investment-focused research teams.
About the Reviewer
 Debashree Dey
— Debashree Dey is Assistant Manager at Next Move Strategy Consulting, where she supports cross-vertical market content and communications across diverse industries for 6 years. Her professional background includes senior content writing, communications, and published manuscript authorship, with experience developing audience-focused business narratives and maintaining clear, consistent messaging. Her role supports research-led content development and editorial quality across NextMSC publications.
Debashree Dey
— Debashree Dey is Assistant Manager at Next Move Strategy Consulting, where she supports cross-vertical market content and communications across diverse industries for 6 years. Her professional background includes senior content writing, communications, and published manuscript authorship, with experience developing audience-focused business narratives and maintaining clear, consistent messaging. Her role supports research-led content development and editorial quality across NextMSC publications.
Corrections and source challenges: contact NMSC research.