Key Takeaways
- Prices are about 90% above January 2020. BLS producer-price data re-based by NextMSC show transformers up 91.4% (July 2026) and switchgear up 89.4% (August 2026), a measure of producer prices, not project quotes.
- Time is the larger cost. Large power transformers that took 12–18 months now take about 30–36 months, up to about 60 months for extra-high-voltage units, with high-voltage bushings alone reaching about 130 weeks.
- Imports are accelerating, not receding. U.S. imports of transformers above 100,000 kVA rose from 617 units ($0.62B) in 2019 to 2,268 units ($2.77B) in 2025, a 3.7x increase in units (Census-derived; secondary source).
- New U.S. capacity arrives late. Hitachi Energy's $528M Mississippi plant is scheduled to start production in 2029, and the $457M South Boston expansion only broke ground in June 2026.
- Demand is still rising. EIA forecasts U.S. electricity sales of 4,135 BkWh in 2026 and 4,211 BkWh in 2027, with data centers and manufacturing as drivers, while the April 2026 Defense Production Act determination named transformers and core steel strategically essential.
Why This Question Is Live in 2026
| Date (2026) | Event | Type |
|---|---|---|
| Feb 3 | Siemens Energy announces $1B of U.S. manufacturing investment, including a new switchgear plant in Mississippi and more than 1,500 jobs | Company announcement |
| Apr 20 | White House determination under Defense Production Act Section 303 covers transformers, substations, high-voltage circuit breakers, protective relays and electrical core steel | Federal policy |
| May | National Laboratory of the Rockies publishes its Large Power Transformer Supply Chain Gap Analysis: more than 80% of U.S. LPT demand met through imports | Federal laboratory |
| Jun | Lawrence Berkeley National Laboratory publishes Speed to Power, identifying 40+ solutions for connecting large loads | Federal laboratory |
| Jun 29 | Hitachi Energy breaks ground on a $457M South Boston, Virginia expansion (about 825 jobs) | Company announcement |
| Sep | EIA September Short-Term Energy Outlook: 4,135 BkWh sales in 2026 | Official forecast |
| Sep 15 | Hitachi Energy announces a $528M Gallman, Mississippi plant; production scheduled for 2029 | Company announcement |
Source basis: U.S. White House, EIA, NLR, LBNL and company releases as compiled in the NextMSC research file.
Source: https://www.nextmsc.com/industry-deep-dive/us-transformer-switchgear-prices-lead-times-2026
These events share one timing problem: announced capacity is not delivered capacity. Construction, equipment installation, workforce development and qualification all precede output.
Price Spectrum: How Far and How Fast
BLS publishes separate producer-price series for power and distribution transformers (WPU117409, December 1999 = 100) and for switchgear and switchboard apparatus (PCU335313335313, June 1985 = 100). Because the bases differ, NextMSC compares percentage movement from January 2020 rather than index levels.
| Equipment | BLS series | Jan 2020 | Latest observation | Change vs Jan 2020 |
|---|---|---|---|---|
| Power and distribution transformers | WPU117409 | 199.5 | 381.783 (Jul 2026) | +91.4% |
| Switchgear and switchboard apparatus | PCU335313335313 | 217.2 | 411.453 (Aug 2026) | +89.4% |
Source: U.S. Bureau of Labor Statistics via FRED; NextMSC calculation. Same-month year-on-year: transformers +8.7% (Jul 2026), switchgear +13.3% (Aug 2026).
Source: https://www.nextmsc.com/industry-deep-dive/us-transformer-switchgear-prices-lead-times-2026
Annual averages: transformers spiked in 2021–2022; switchgear kept climbing
| Year | Transformer PPI | YoY | Switchgear PPI | YoY |
|---|---|---|---|---|
| 2019 | 195.4 | — | 211.6 | — |
| 2020 | 198.0 | 1.3% | 219.1 | 3.5% |
| 2021 | 232.3 | 17.3% | 231.4 | 5.6% |
| 2022 | 312.6 | 34.6% | 274.1 | 18.5% |
| 2023 | 333.4 | 6.7% | 299.8 | 9.4% |
| 2024 | 342.5 | 2.7% | 322.6 | 7.6% |
| 2025 | 352.9 | 3.0% | 353.2 | 9.5% |
| 2026 YTD | 366.3 | +5.0%* | 391.4 | +12.9%* |
Source: NextMSC calculations from BLS monthly data via FRED. *YoY on comparable months: Jan–Jul 2026 vs Jan–Jul 2025 (transformers); Jan–Aug (switchgear).
Source: https://www.nextmsc.com/industry-deep-dive/us-transformer-switchgear-prices-lead-times-2026
Figure 1. Annual-Average Producer Prices, Re-based (2019 = 100)
Unit: index, 2019 = 100, NextMSC re-basing of BLS series; 2026 excluded (partial year).
Source: https://www.nextmsc.com/industry-deep-dive/us-transformer-switchgear-prices-lead-times-2026
Reading the chart. Between 2019 and 2025 transformer prices rose 80.6% and switchgear 66.9% on an annual-average basis. Transformers front-loaded their increase; switchgear reaccelerated in 2025 and 2026, so the two product lines are in different phases of the cycle. DOE separately reports 4–9x increases for some specific transformer equipment over five years; NextMSC does not combine that figure with the PPI because they measure different things.
Unit-price benchmarks
| Benchmark | Indicative value | Basis |
|---|---|---|
| New large-power-transformer procurement price | $15,000–$21,000 per MVA | USITC via NLR |
| 100 MVA unit | $1.5M–$2.1M | NextMSC calculation |
| Highly customized 100 MVA unit | Up to about $4M | NLR |
| Upper single-unit benchmark | About $10M | USITC via NLR |
| Core steel and copper share of cost | About 50% (each roughly 25%) | DOE citing 2020 U.S. Commerce survey |
| Logistics share of cost | 3–20% | NLR |
Source: NLR Large Power Transformer Supply Chain Gap Analysis (May 2026); DOE. Benchmarks are indicative and vary by rating, voltage, origin and customization.
Source: https://www.nextmsc.com/industry-deep-dive/us-transformer-switchgear-prices-lead-times-2026
Four Pillars of the Bottleneck: Price, Time, Components, Capacity
NextMSC keeps the four indicators separate and traceable rather than collapsing them into one shortage score, since no standardized national measure makes them comparable.
Pillar 2: Lead times
| Equipment | Lead time | Basis |
|---|---|---|
| Large power transformer, pre-shortage | 12–18 months | NLR (order to receipt) |
| Large power transformer, current | 30–36 months | NLR |
| Extra-high-voltage transformer | Up to 60 months | DOE/NLR |
| Distribution transformer, 2020–2022 increase | 22–33 months | DOE industry reporting |
| Generator step-up transformer, Q2 2025 | About 143 weeks | Wood Mackenzie survey |
| Power transformer, Q2 2025 | About 128 weeks | Wood Mackenzie survey |
| Switchgear, Q2 2025 | About 44 weeks | Wood Mackenzie survey |
| Some large transformers, customer-reported (Apr 2026 testimony) | 120–210 weeks | NEMA testimony to House committee |
Source: NLR, DOE, Wood Mackenzie Q2 2025 survey, April 2026 House testimony. Survey and testimony figures are not interchangeable with NLR estimates.
Source: https://www.nextmsc.com/industry-deep-dive/us-transformer-switchgear-prices-lead-times-2026
Pillar 3: Upstream components
| Constraint | Evidence |
|---|---|
| High-voltage bushings | Up to about 130 weeks for some units (NLR interviews) |
| On-load tap changers | About 80–90 weeks (NLR) |
| Grain-oriented electrical steel | About 90% import reliance for high-grade GOES; 2024 imports 45% from South Korea, 41% from Japan (NLR) |
| Copper | About 45% refined-copper net import reliance (USGS via NLR; not transformer-only) |
Source: NLR Large Power Transformer Supply Chain Gap Analysis, May 2026, citing USGS.
Source: https://www.nextmsc.com/industry-deep-dive/us-transformer-switchgear-prices-lead-times-2026
A transformer can be delayed by a single missing bushing even when tank, core and winding production are on schedule, so adding assembly capacity alone does not clear the constraint.
Pillar 4: Domestic capacity and announced investment
| Company | Development | Investment | Timing |
|---|---|---|---|
| Hitachi Energy | South Boston, Virginia large-power-transformer facility | $457M | Groundbreaking Jun 29, 2026; about 825 jobs |
| Hitachi Energy | Gallman, Mississippi transformer facility | $528M | Construction expected late 2026; production 2029; 700+ jobs |
| Siemens Energy | U.S. grid and switchgear expansion, new Mississippi switchgear plant | $1B | Announced Feb 2026; 1,500+ jobs |
| Pennsylvania Transformer Technology | Raeford, North Carolina expansion | $102.5M+ | Groundbreaking Dec 2025; 217 jobs |
Source: company releases and North Carolina Governor's office, per the NextMSC dataset. Announced investment is not operating capacity.
Source: https://www.nextmsc.com/industry-deep-dive/us-transformer-switchgear-prices-lead-times-2026
NLR reports domestic LPT capacity grew 11% between 2011 and 2023 while apparent consumption grew 28%, with capacity utilization rising from 40% to 78%. The import-dependence figures differ by method: NLR states that more than 80% of demand is imported, while a USITC-based figure in the same dataset puts domestic producers' 2023 share at about 30% on a different denominator.
Trade: Imports Surge, and China Is a Small Direct Supplier
Using HTS 8504.23.0080 (liquid dielectric transformers above 100,000 kVA) as a narrow large-power-transformer proxy, U.S. imports rose from 617 units and $620M in 2019 to 2,268 units and $2.77B in 2025. That is 4.5x the value and 3.7x the units; average declared unit value rose 22% to $1.22M. 2026 is incomplete, with 2,901 units for the twelve months to June 30, 2026.
Figure 2. U.S. Imports of Liquid Dielectric Transformers >100,000 kVA ($B and Units)
Unit: customs value ($B, bars) and units (line); HTS 8504.23.0080; annual, 2019–2025.
Source: https://www.nextmsc.com/industry-deep-dive/us-transformer-switchgear-prices-lead-times-2026
Three origins supplied 57% of 2025 units and 50% of 2025 value: Mexico (630 units), Brazil (343) and South Korea (323). Declared unit values vary widely, from about $0.71M for Mexico to about $2.43M for Austria, a 3.4x spread that reflects product mix as much as price.
Figure 3. 2025 Import Units by Origin (% of Units)
Unit: % of 2,268 units. China is reported at 2.2% of units; other origins is the residual (NextMSC calculation).
Source: https://www.nextmsc.com/industry-deep-dive/us-transformer-switchgear-prices-lead-times-2026
The China-Vietnam question. On the broad HTS 8504 heading (transformers, converters and inductors), China's share of U.S. imports fell from about 27% in 2020 to about 10% in 2025 ($3.6B of $35.4B), while Vietnam-to-U.S. flows rose from $0.6B to $2.1B and China-to-Vietnam flows from $1.5B to $3.0B. That pattern is consistent with shifting supply chains but does not by itself prove rerouting. Establishing that would require product-level and origin evidence, and the broad heading covers far more than large power transformers.
Source: Energy Factbook using U.S. Census trade data (narrow proxy); Coalition for a Prosperous America (broad HTS 8504). Both are secondary, advocacy or derived sources.
Source: https://www.nextmsc.com/industry-deep-dive/us-transformer-switchgear-prices-lead-times-2026
Demand and the AI Power Bottleneck
| Indicator | Value | Source |
|---|---|---|
| U.S. electricity sales, 2026 / 2027 | 4,135 / 4,211 BkWh | EIA STEO, Sep 2026 |
| Commercial sales growth, 2026 / 2027 | 3.3% / 2.7% | EIA STEO |
| Industrial sales growth, 2026 / 2027 | 1.6% / 2.6% | EIA STEO |
| Average annual demand growth, last five years | 2.1% | EIA AEO2026 |
| Projected growth through 2050 | 0.9–1.6% per year | EIA AEO2026 |
| Data-center server use, 2050 | 446–818 BkWh | EIA AEO2026 |
| Data-center electricity, 2023 | 176 TWh (4.4% of U.S.) | Lawrence Berkeley National Laboratory |
| Data-center electricity, 2028 scenarios | 325–580 TWh (6.7–12.0%) | Lawrence Berkeley National Laboratory |
Source: EIA Short-Term Energy Outlook (Sep 2026) and AEO2026; Lawrence Berkeley National Laboratory data-center report.
Source: https://www.nextmsc.com/industry-deep-dive/us-transformer-switchgear-prices-lead-times-2026
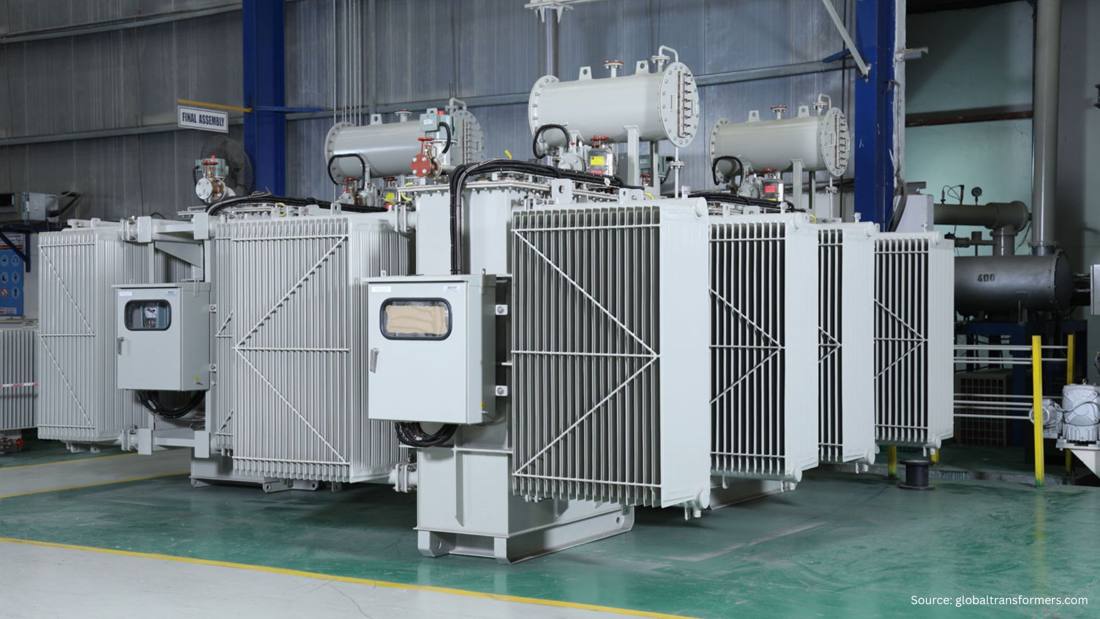
Source: https://www.nextmsc.com/industry-deep-dive/us-transformer-switchgear-prices-lead-times-2026
The AI connection runs through the grid, not the chip: more computing needs more power, which needs substations, transformers and switchgear that can be delivered on schedule. Data centers are one driver among several; transmission expansion, replacement of aging equipment, renewables and industrial loads also generate transformer demand, and NextMSC does not claim data centers alone caused the shortage. Over 2011–2023 NLR also estimates about 700 new LPTs per year versus about 170 reaching design life annually.
Policy: Emergency Powers and Standardization
The April 20, 2026 Presidential Determination under DPA Section 303 finds that limited domestic capacity, long procurement timelines, foreign supply dependence and insufficient capital investment prevent industry from supplying grid equipment in time. It authorizes DOE to use purchases, purchase commitments and other support, but it does not itself add capacity or shorten lead times.
DOE separately outlines a program of up to $375M for domestic transformer and component supply chains, notes more than 80,000 distribution-transformer varieties, and funds modular transformer designs. Standardization could shorten production cycles, but only if utilities adopt common configurations.
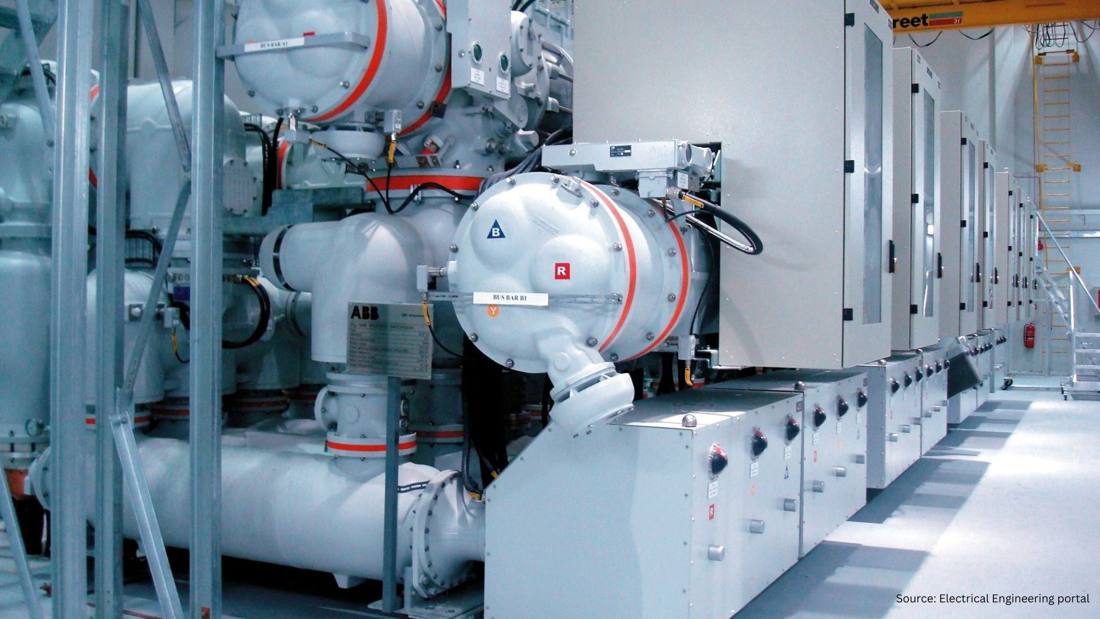
Source: https://www.nextmsc.com/industry-deep-dive/us-transformer-switchgear-prices-lead-times-2026
What to Watch Next
- BLS PPI, October 15, 2026: September observations for both series; whether transformer and switchgear momentum diverge further.
- Factory commissioning dates: the gap between announced investment and operating capacity, starting with Hitachi South Boston and the 2029 Mississippi start.
- Component lead times: bushings (about 130 weeks), tap changers (80–90 weeks), GOES and copper availability.
- Large-load announcements: geographic concentration of data-center and manufacturing projects that need new substations.
- DPA implementation: funding commitments, supplier development and, eventually, falling lead times.
- Trade data by narrow HTS code: whether the 2025 import surge continues into the 2026 full-year data.
Data Limitations
- PPI measures producer-price movement and is not a quote for any specific transformer or switchgear unit.
- Lead times vary by class, voltage and contract; no single national figure exists, so NextMSC presents each source separately.
- Import-dependence figures depend on product scope and method (more than 80% imported per NLR versus about 30% domestic share in a USITC-based figure).
- The Wood Mackenzie 2024 benchmark of 120–210 weeks is a 2024 industry figure, not a 2026 average; the Q2 2025 survey is a later benchmark.
- Company investments are announced or planned capacity, not available capacity.
- The framework deliberately produces no single shortage score.
Need this analysis for your grid or data-center project?
NextMSC analysts can map your equipment list against price, lead-time and import exposure. See also the Switchgear Monitoring System Market report and the Data Center Market report.
Dataset Explorer and Export
Filter the company, policy, procurement, fleet and supply data compiled for this article, then export the full dataset as CSV. Every record is labeled as reported, calculated, forecast or target.
0 records shown
| Category | Entity | Metric | Value | Unit | Period | Type | Source |
|---|
The CSV includes all 13 fields, including source document, source date and notes. NextMSC calculations are marked "Calculated".
Source: https://www.nextmsc.com/industry-deep-dive/us-transformer-switchgear-prices-lead-times-2026
Methodology and Data Note
Data cut-off: September 22, 2026; planned refresh quarterly. Government and federal-laboratory sources (BLS, EIA, DOE, NLR, LBNL, White House) take priority; industry research (Wood Mackenzie, Coalition for a Prosperous America, Energy Factbook) is labeled as such. Price indexes are re-based to January 2020 = 100 by NextMSC; annual averages come from monthly BLS data (the monthly series are not in the supplied workbook, so annual averages and the 2026 YTD figures rest on the source document). Trade analysis separates broad HTS 8504 from narrow HTS 8504.23.0080, and 2026 trade data are incomplete. Known inconsistencies: the source document gives Wood Mackenzie's generator step-up lead time as both 143 and 144 weeks (143 used, per the dataset); import dependence is reported as more than 80% (NLR) and as a roughly 30% domestic share (USITC-based) on different denominators.
About the Author
 Liza Phukan
— Liza Phukan is Research Associate at Next Move Strategy Consulting, where she has covered emerging industries and market research across sectors for 3.5 years. Her work includes analyzing industry developments, validating market data, and developing structured business content from research findings. She uses secondary research and data-validation practices to turn complex market information into clear decision-useful market analysis for business audiences and support report development and B2B.
Liza Phukan
— Liza Phukan is Research Associate at Next Move Strategy Consulting, where she has covered emerging industries and market research across sectors for 3.5 years. Her work includes analyzing industry developments, validating market data, and developing structured business content from research findings. She uses secondary research and data-validation practices to turn complex market information into clear decision-useful market analysis for business audiences and support report development and B2B.
About the Reviewer
 Debashree Dey
— Debashree Dey is Assistant Manager at Next Move Strategy Consulting, where she supports cross-vertical market content and communications across diverse industries for 6 years. Her professional background includes senior content writing, communications, and published manuscript authorship, with experience developing audience-focused business narratives and maintaining clear, consistent messaging. Her role supports research-led content development and editorial quality across NextMSC publications.
Debashree Dey
— Debashree Dey is Assistant Manager at Next Move Strategy Consulting, where she supports cross-vertical market content and communications across diverse industries for 6 years. Her professional background includes senior content writing, communications, and published manuscript authorship, with experience developing audience-focused business narratives and maintaining clear, consistent messaging. Her role supports research-led content development and editorial quality across NextMSC publications.
Data cut-off: September 22, 2026 • Corrections and source challenges: contact NMSC research.