Verisk's USD 171 Billion Loss Benchmark Reframes Climate Risk Modeling

Verisk's USD 171 Billion Loss Benchmark, MSCI's First Street Deal and the PRA's SS5/25 Rules Push Climate Risk Models From Disclosure Exercise to Pricing Input
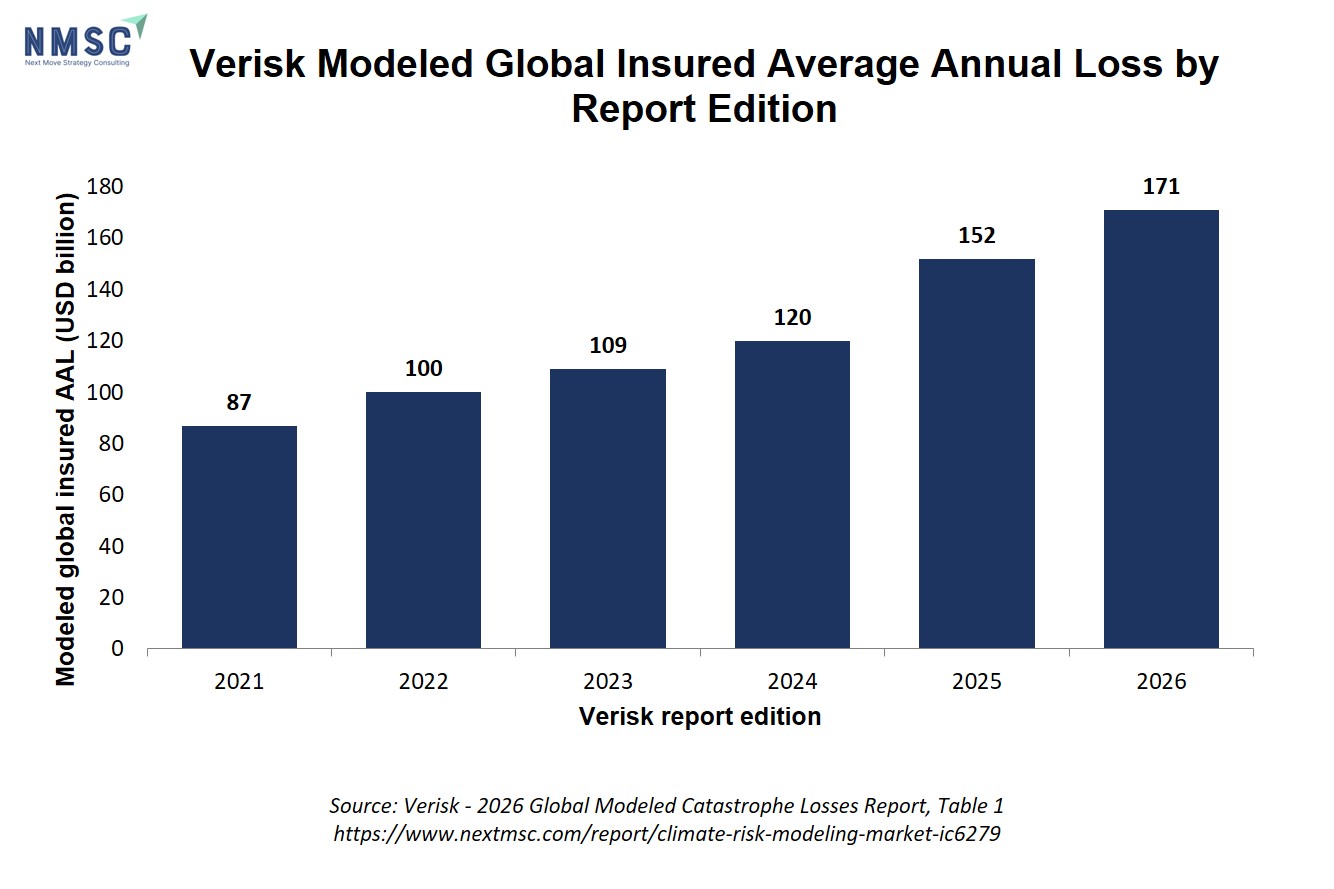
On 1 September 2026, the catastrophe modeling business of Verisk released its 2026 Global Modeled Catastrophe Losses Report, which puts the modeled global insured average annual loss (AAL) from natural catastrophes at USD 171 billion. The figure is USD 19 billion above the USD 152 billion in the previous edition and the highest Verisk has reported, and it rose even though 2025 passed without a hurricane landfall on the continental United States for the first time in a decade. For insurers, reinsurers, lenders and supervisors that price or oversee physical climate exposure, the report treats a quiet loss year as a favorable draw, not as evidence of a lower-risk baseline.
According to Next Move Strategy Consulting's Climate Risk Modeling Market report, the global climate risk modeling market was valued at USD 2.90 billion in 2025 and is projected to reach USD 12.70 billion by 2035, growing at a CAGR of 15.8% from 2026 to 2035. NextMSC primary research and analysis shows demand arriving from three directions at once: insurers recalibrating catastrophe benchmarks, banks and asset managers pricing physical risk at property level, and disclosure and supervisory regimes that now require documented scenario analysis.
For More Information: Download FREE Sample on Climate Risk Modeling Market Report
Verisk's Benchmark: Frequency Perils, Not One Storm, Set the Number
Verisk attributes USD 117 billion, or 68%, of the global modeled insured AAL to the United States. By peril, severe thunderstorm accounts for 40% of the modeled insured AAL, ahead of tropical cyclone at 27%, earthquake at 10%, winter storm at 9%, flood at 7% and wildfire at 6%. The report also places the 1-in-100-year aggregate insured loss at USD 477 billion and the 1-in-250-year loss at USD 606 billion. Verisk states that the AAL is a long-term modeled benchmark built from simulations across its global suite of models, not a prediction of losses in 2026 or in any individual year.
The benchmark has climbed in every edition shown in Table 1 of the Verisk report: USD 87 billion in 2021, USD 100 billion in 2022, USD 109 billion in 2023, USD 120 billion in 2024, USD 152 billion in 2025 and USD 171 billion in 2026. Verisk links the 2026 movement to updated models for U.S. tropical cyclone, U.S. inland flood, Central America, the Caribbean, Mexico and U.S. winter storm, a refreshed global industry exposure database and changes to its demand surge calculations. It adds that property exposure in the countries it models has grown roughly 7% a year since 2021 and that U.S. residential reconstruction costs have risen about 5% a year over the same period. Because each edition reflects the model versions and exposure data of its year, the series combines hazard views, model coverage and asset values, and Verisk itself describes the rise since its first report in 2012, from USD 59 billion in 2012 dollars to USD 171 billion, as reflecting all three.
Verisk's leadership argues that a benign hurricane season can push pricing, retention and capital behavior in the wrong direction. Rob Newbold, president of Verisk Catastrophe and Risk Solutions, said in the company's 1 September 2026 release:
“no longer signal a quieter catastrophe environment”
- Rob Newbold, President, Verisk Catastrophe and Risk Solutions, Verisk, Verisk release on the 2026 Global Modeled Catastrophe Losses Report, describing years without significant U.S. hurricane losses, 1 September 2026.
Protection Gaps Show Where Modeled Risk Meets Uninsured Loss
Verisk compares insured losses with reported economic losses for natural disasters since 2015 and concludes that insured losses make up more than 38% of global economic losses once adjusted for inflation. Applied to its modeled insured AAL, that share implies an economic AAL of more than USD 450 billion. The insured share differs sharply by region in Verisk's Table 3: 53% in North America, 46% in Oceania, 33% in Latin America, 22% in Europe and 14% in Asia. Verisk illustrates the spread with the March 2025 Myanmar earthquake, which caused approximately USD 12 billion in economic loss while insurers covered less than USD 100 million, and with the July 2025 Central Texas floods, where the national flood insurance take-up rate is 3% and Kerr County's is 2.5%. Verisk cautions that there is considerable uncertainty in the estimated insured share because reported economic losses for actual catastrophes are themselves uncertain.
Modeled Insured and Economic Average Annual Loss by Region
|
Region |
Insured AAL (USD billion) |
Share of economic losses insured |
Economic AAL (USD billion) |
|
Asia |
10 |
14% |
71 |
|
Europe |
24 |
22% |
110 |
|
Latin America |
7 |
33% |
23 |
|
North America |
124 |
53% |
235 |
|
Oceania |
5 |
46% |
11 |
|
All exposed areas |
171 |
38% |
450 (sum of regional losses) |
The regional tails are far heavier than the averages suggest. In Verisk's Table 2, Latin America carries a modeled insured AAL of USD 7 billion but an aggregate insured loss of USD 100 billion at the 250-year return period, while North America's USD 124 billion AAL rises to USD 565 billion at the same return period. Verisk notes that aggregate exceedance probability losses are not additive across regions, so the regional tail figures do not sum to the all-areas total. For capital providers that set retentions and reinsurance limits against tail metrics rather than averages, those ratios are the working output of a catastrophe model.
Modeled Aggregate Insured Loss by Region and Return Period
|
Region |
AAL (USD billion) |
1.0% exceedance, 100-year return period (USD billion) |
0.4% exceedance, 250-year return period (USD billion) |
|
Asia |
10 |
58 |
79 |
|
Europe |
24 |
101 |
128 |
|
Latin America |
7 |
67 |
100 |
|
North America |
124 |
433 |
565 |
|
Oceania |
5 |
35 |
46 |
|
All exposed areas |
171 |
477 |
606 |
Swiss Re Institute: Secondary Perils Carry the Modeling Gap
Swiss Re Institute's sigma No 1/2026, "Natural catastrophes in 2025: the persistent rise of wildfire and storm risk", published in March 2026, puts global insured natural catastrophe losses at USD 107 billion for 2025, below the long-term trend because no major U.S. hurricane made landfall. Secondary perils, among them wildfires, severe convective storms and floods, accounted for a record 92% of those insured losses, and the Los Angeles wildfires, at USD 40 billion in combined insured losses, are the largest insured wildfire event on sigma records. The institute reports that exposure growth explains more than 80% of the long-term increase in global weather-related insured losses between 1970 and 2025, and that insured losses from North American wildfires and European severe convective storms are growing twice as fast as exposure. Its long-term trend implies an insured loss of USD 148 billion for 2026, or USD 320 billion in a peak-loss scenario.
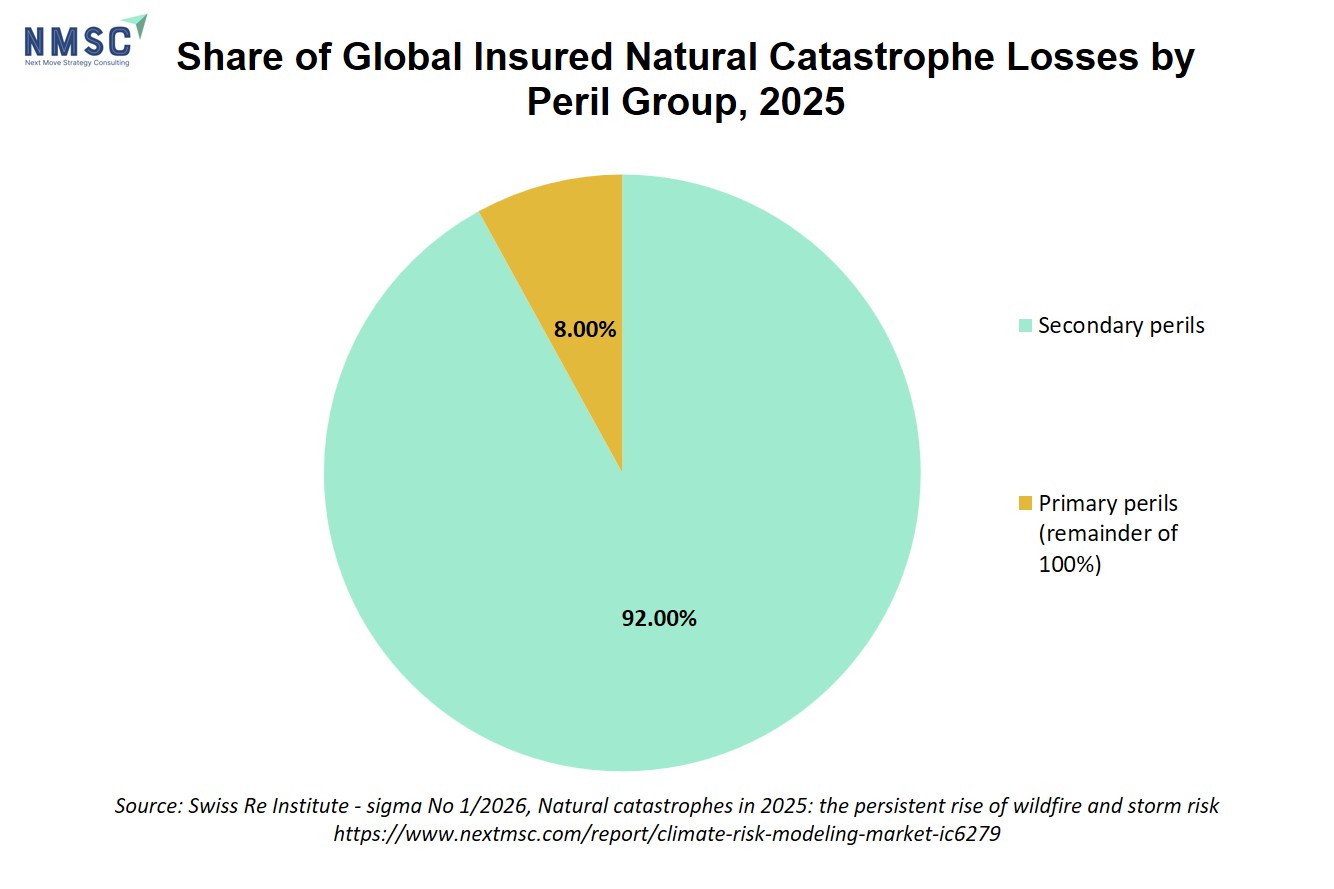
Swiss Re Institute argues that sustained investment in modeling secondary perils is a prerequisite for keeping premiums and capital commensurate with the underlying risk, and that catastrophe models extend assessment beyond the observed historical record, which matters most where historical hazard data is sparse. Verisk's finding that severe thunderstorm and wildfire together account for 46% of its modeled insured AAL points to the same exposure from a different data set.
Capital and Supervisors Move Toward Asset-Level Climate Models
On 24 June 2026, MSCI announced that it would acquire First Street, a provider of physics-based climate risk data and analytics, and on 3 August 2026 MSCI completed the transaction, stating that First Street's coverage spans more than 2.4 billion structures worldwide. The consideration included USD 120 million in cash at closing, with potential additional cash payments during the first two years if revenue thresholds are met. The deal moves property-level hazard modeling inside a large provider of investment and risk analytics that serves asset managers and asset owners.
Regulators and standard setters are tightening the demand side. The Prudential Regulation Authority published Supervisory Statement 5/25 on 3 December 2025, setting out its expectations for how banks and insurers manage climate-related risks. In November 2026, the IFRS Foundation told its Sustainability Consultative Committee that nearly 50 jurisdictions are on the journey to using ISSB Standards, that companies in 13 jurisdictions are applying them for FY2025 and that companies in 6 more jurisdictions will follow from FY2026.
Dated Regulatory and Benchmark Developments Referenced in This Article
|
Date |
Development |
Issuer |
|
3 December 2025 |
Supervisory Statement 5/25 sets expectations for how banks and insurers manage climate-related risks |
Prudential Regulation Authority |
|
1 September 2026 |
Global modeled insured AAL reported at USD 171 billion, up USD 19 billion from the prior edition |
Verisk |
|
November 2026 |
Nearly 50 jurisdictions on the journey to using ISSB Standards; companies in 13 jurisdictions applying them for FY2025 and 6 more from FY2026 |
IFRS Foundation |
Segment and Regional Dynamics
According to NextMSC primary research and analysis, software and models is the largest offering at USD 1.15 billion in 2025, rising to USD 5.10 billion by 2035, while advisory and managed services is the fastest-growing offering at a CAGR of 16.7%, from USD 0.70 billion to USD 3.20 billion over the same period. By risk type, physical risk is the largest segment at USD 1.98 billion in 2025 and USD 8.55 billion by 2035, and transition risk is the fastest-growing at a CAGR of 16.1% from 2026 to 2035. Insurance and reinsurance is the largest end user at USD 1.02 billion in 2025 and USD 3.90 billion by 2035, whereas the government and public sector grows fastest at a CAGR of 17.7% from 2026 to 2035.
NextMSC primary research and analysis places North America first by region, with approximately 38% of 2025 revenue and a value of USD 1.10 billion in 2025 rising to USD 4.45 billion by 2035. Middle East & Africa is the fastest-growing region at a CAGR of 18.0%, from USD 0.15 billion in 2025 to USD 0.80 billion by 2035. In the United States, NextMSC analysis values the market at USD 0.90 billion in 2025 and USD 3.60 billion by 2035, and India is the fastest-growing major country at a CAGR of 21.0%, from USD 0.07 billion to USD 0.50 billion over the same period.
NMSC Strategic Perspective: Modeled Benchmarks Are Becoming Pricing and Disclosure Infrastructure
NextMSC primary research and analysis reads the Verisk release as evidence that the purchase case for climate risk models has moved from forecasting the next event to defending a pricing and capital baseline. A USD 19 billion rise in a modeled AAL in a single edition, published after a year without a U.S. hurricane landfall, gives risk committees a concrete reason to re-run portfolios against near-present-climate catalogs instead of historical loss experience. That strengthens the position of software and models, which NextMSC analysis sizes as the largest offering at USD 1.15 billion in 2025.
The second shift is from portfolio averages to individual assets. MSCI paid USD 120 million in cash at closing for a provider covering more than 2.4 billion structures, and the Prudential Regulation Authority's Supervisory Statement 5/25 gives banks and insurers a documented standard to demonstrate how they manage climate-related risks. NextMSC analysis indicates that these two developments reinforce each other: supervisors ask for scenario evidence, and financial-data vendors are buying property-level hazard science to supply it. The same logic supports the 16.7% CAGR NextMSC analysis assigns to advisory and managed services, because many lenders and public bodies lack the in-house capability to validate or operate models.
The third shift is geographic. Verisk's protection-gap data show the widest unmet need in Asia, where 14% of modeled economic loss is insured, against 53% in North America. NextMSC primary research and analysis finds the fastest growth from small bases in Middle East & Africa at 18.0% and in India at 21.0%, which suggests that early demand there will come from government and public-sector buyers, the end-user segment growing at 17.7%, before commercial insurance penetration deepens.
NextMSC primary research and analysis also identifies constraints that will slow conversion of this demand into revenue: scientific uncertainty and divergence between models, gaps in exposure data and the cost of acquiring it, and regulatory fragmentation across jurisdictions. Verisk's own caution about uncertainty in the insured share of economic loss illustrates the first of these, and the IFRS Foundation's count of nearly 50 jurisdictions at different stages of adopting ISSB Standards illustrates the third.
Vendor Activity: Acquisitions and Open Model Access
Vendor activity in 2026 centers on broadening model coverage and distribution. NextMSC lists Verisk and MSCI among the leading participants in the report. KatRisk announced its acquisition of RED on 6 April 2026, expanding its global catastrophe modeling capabilities, and Verisk announced on 26 May 2026 that KatRisk had agreed to join Verisk Model Exchange, which the announcement describes as advancing open access to the catastrophe risk modeling ecosystem. Verisk's 2026 report adds that its model expansion since 2012 now covers more than 20 additional countries and regions, and MSCI's completed purchase of First Street adds property-level hazard data to its sustainability and climate segment.
Bottom Line
Verisk's USD 171 billion modeled insured loss benchmark, the highest in its report series, arrived after a year without a continental U.S. hurricane landfall, which shows that frequency perils now set the baseline that insurers, reinsurers and lenders must price against. Swiss Re Institute found that secondary perils produced 92% of 2025 insured losses, while Verisk's protection-gap data show that 14% of economic losses in Asia are insured against 53% in North America. MSCI's completed First Street acquisition and the Prudential Regulation Authority's SS5/25 supervisory statement tie asset-level hazard modeling to capital allocation and supervision. According to NextMSC primary research and analysis, the global climate risk modeling market will expand from USD 2.90 billion in 2025 to USD 12.70 billion by 2035 at a CAGR of 15.8%, with advisory and managed services the fastest-growing offering at 16.7%, Middle East & Africa the fastest-growing region at 18.0% and India the fastest-growing major country at 21.0%. Vendors that pair reproducible models with property-level data and advisory support are best placed to capture that demand.
About Next Move Strategy Consulting
Next Move Strategy Consulting is a premier market research and management consulting firm that has been committed to provide strategically analysed well documented latest research reports to its clients. The research industry is flooded with many firms to choose from, what makes NMSC different from the rest is its top-quality research and the obsession of turning data into knowledge by dissecting every bit of it and providing fact-based research recommendation that is supported by information collected from over 500 million websites, paid databases, industry journals and one on one consultations with industry experts across a diverse range of industry sectors. The high-quality customized research reports with actionable insights and excellent end-to-end customer service help our clients to take critical business decisions that enables them to move beyond time and have competitive edge in the industry.
We have been servicing over 1000 customers globally that includes 90% of the Fortune 500 companies over a decade. Our analysts are constantly tracking various high growth markets and identifying hidden opportunities in each sector or the industry. We provide one of the industry’s best quality syndicate as well as custom research reports across 10 different industry verticals. We are committed to deliver high quality research solutions in accordance to your business needs. Our industry standard delivery solutions that ranges from the pre consultation to after-sales services, provide an excellent client experience and ensure right strategic decision making for businesses.
For more information, please contact:
Next Move Strategy Consulting
5th Floor 867 Boylston St, STE 500,
Boston, MA 02116, U.S.
E-Mail: [email protected]
Direct: +1-217-650-7991
Website: www.nextmsc.com
About the Author
 Sanyukta Deb
— Sanyukta Deb is Digital Marketing Team Lead at Next Move Strategy Consulting, where she has led content strategy and technical SEO for the firm's B2B market research publications for over 2 years. Her editorial process translates NextMSC's primary and secondary research — spanning technology, industrial, and consumer sectors — into commercial narratives, backed by search-intent, keyword, and competitive analysis. She brings 5 years of overall experience in digital marketing and content strategy.
About the Reviewer
 Debashree Dey
— Debashree Dey is Assistant Manager at Next Move Strategy Consulting, where she supports cross-vertical market content and communications across diverse industries for 6 years. Her professional background includes senior content writing, communications, and published manuscript authorship, with experience developing audience-focused business narratives and maintaining clear, consistent messaging. Her role supports research-led content development and editorial quality across NextMSC publications.














Add Comment