Climate Risk Modeling Market Analysis and Forecast (2026–2035)

The global Climate Risk Modeling Market is estimated at USD 3.38 Billion in 2026 and is projected to reach USD 12.70 Billion by 2035, growing at a CAGR of 15.8% from 2026 to 2035. Growth is driven by mandatory climate disclosures, rising insured catastrophe losses, and increasing demand for property-level analytics, with North America leading the market.

Download Free Sample PDF
Base Year (2025)
$2.90 Billion
Forecast (2035)
$12.70 Billion
CAGR (2026-2035)
15.8%
Top Region
North America

What Is the Climate Risk Modeling Market Size?

The global Climate Risk Modeling Market reached USD 2.90 Billion in 2025 and is estimated at USD 3.38 Billion in 2026, forecast to reach USD 12.70 Billion by 2035 at a 15.8% CAGR from 2026–2035. North America leads with approximately 38% share, while software and models dominate with approximately 40% of revenue.

We observed that regulators, lenders, and insurers now treat forward-looking loss quantification as an operating requirement rather than a disclosure exercise. Buyers want hazard science, exposure data, and financial translation delivered in one workflow, which favors platforms that connect catastrophe engines with scenario libraries and portfolio analytics. That shift explains why spending is moving from one off assessments to recurring subscriptions and managed services.

During our market evaluation, we noticed that three conditions anchor the forecast. Climate disclosure rules are spreading across jurisdictions, insured losses remain structurally high, and property-level data now reaches billions of buildings. Together these conditions widen the buyer base from catastrophe insurers to banks, asset managers, corporates, and public agencies, each of which needs defensible loss estimates under several warming scenarios.

Climate Risk Modeling Market Analysis and Forecast (2026–2035) Revenue Forecast

Values in USD Billion

2025 $2.90 Billion
2025
2026 $3.38 Billion
2026
2027 $3.91 Billion
2027
2028 $4.53 Billion
2028
2029 $5.25 Billion
2029
2030 $6.08 Billion
2030
2031 $7.04 Billion
2031
2032 $8.15 Billion
2032
2033 $9.44 Billion
2033
2034 $10.93 Billion
2034
2035 $12.70 Billion
2035

Key Takeaways

By Offering: Software and models held the largest share, expanding from USD 1.15 Billion in 2025 to USD 5.10 Billion by 2035; Advisory and managed services is the fastest growing at 16.7% CAGR from 2026–2035.

By Risk Type: Physical risk held the largest share, expanding from USD 1.98 Billion in 2025 to USD 8.55 Billion by 2035; Transition risk is the fastest growing at 16.1% CAGR from 2026–2035.

By End User: Insurance and reinsurance held the largest share, expanding from USD 1.02 Billion in 2025 to USD 3.90 Billion by 2035; Government and public sector is the fastest growing at 17.7% CAGR from 2026–2035.

Dominant Region: North America dominated with approximately 38% revenue share in 2025, anchored by U.S. insurers and lenders that buy catastrophe and climate analytics at scale.

Fastest-Growing Region: Middle East & Africa is expected to register the highest CAGR of 18.0% during 2026–2035, driven by sovereign resilience programs and expanding disclosure rules.

Dominant Country: The U.S. led the market with an estimated USD 0.90 Billion in 2025, supported by the deepest insured loss base and the most mature modeling vendor ecosystem.

Fastest-Growing Country: India is projected to expand from USD 0.07 Billion in 2025 at a CAGR of 21.0%, driven by urban flood exposure and rising insurance penetration.

The Climate Risk Modeling Market is projected to generate an incremental revenue increase of approximately USD 9.32 Billion between 2026 and 2035. This represents the difference between the estimated 2026 market size of USD 3.38 Billion and the projected 2035 market size of USD 12.70 Billion. Software platforms and property-level data are the most capital efficient entry points for investors.
According to NMSC analysis, an important market development is the increasing demand for financial loss metrics alongside conventional hazard scores. Supervisors and auditors increasingly ask vendors to show validation against observed events rather than only scenario outputs. Vendors that provide transparent model validation, back-testing methodologies, and loss calibration evidence may strengthen their competitive positioning and build greater client confidence.

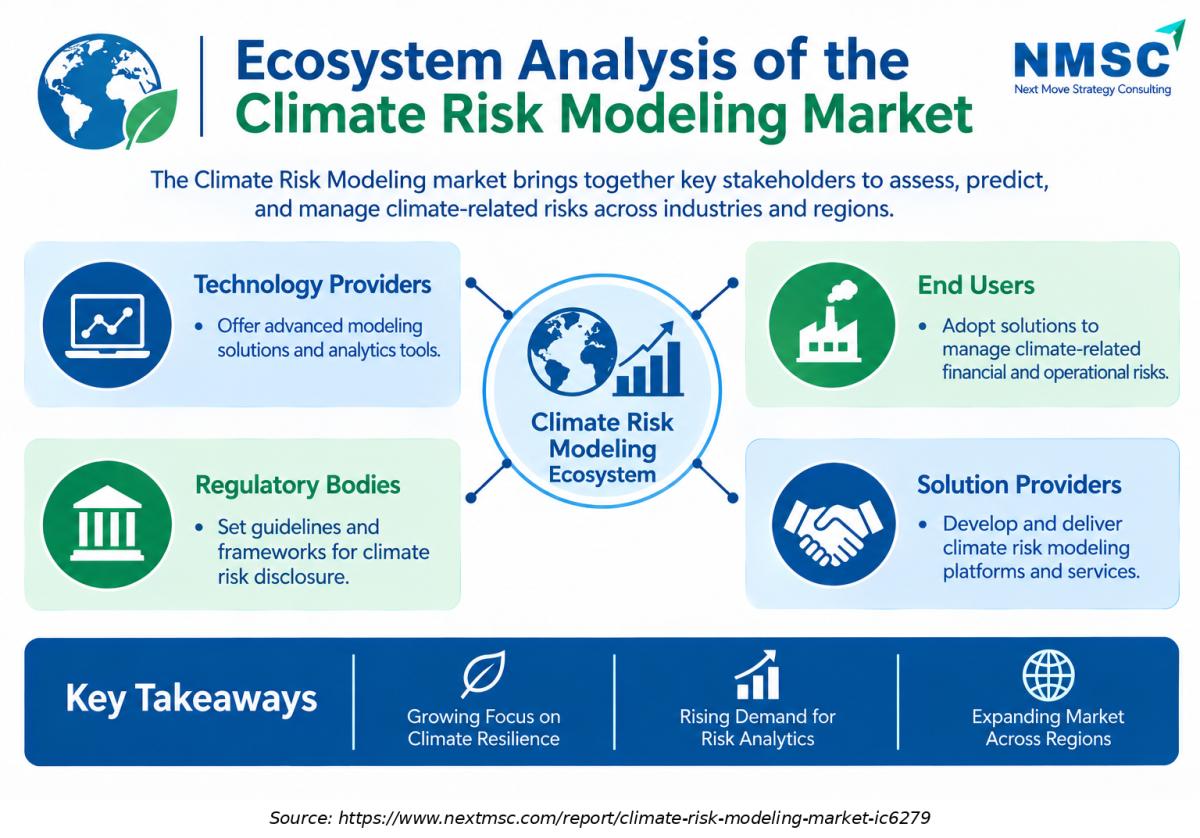
Ecosystem Analysis of the Climate Risk Modeling Market
The infographic outlines the Ecosystem Analysis of the Climate Risk Modeling Market, highlighting key stakeholders such as technology providers, regulatory bodies, end users, and solution providers. It emphasizes how advanced modeling technologies, climate risk disclosure frameworks, data analytics, and industry collaboration support climate risk assessment, strengthen resilience planning, improve risk management, and drive market growth across different regions

What Does the Climate Risk Modeling Market Encompass?
The market covers software platforms, hazard and exposure data, and advisory services that quantify how physical hazards and the low carbon transition translate into financial loss. Buyers include insurers, banks, asset managers, corporates, and public agencies. Our findings suggest that scope now extends beyond catastrophe models, because lenders and investors want asset-level loss estimates under several warming scenarios. Products range from probabilistic catastrophe engines to property scoring tools delivered through cloud interfaces.

Structural evolution is shaped by regulation and loss experience. The IFRS Foundation reports that 36 jurisdictions are adopting or aligning with ISSB standards, which require disclosure of the financial effects of material climate risks. Insured natural catastrophe losses reached USD 127 Billion in 2025, which keeps pricing and capital models under scrutiny. Our assessment indicates that vendors now pair scientific hazard views with vulnerability and financial modules so outputs can feed stress tests, credit decisions, and portfolio allocation.

Market Drivers & Dynamics

Interactive Dataset
Mandatory climate disclosure aligned with ISSB standards driver +3.1% Global, strongest in Europe and APAC 2026–2030
Elevated insured losses and protection gaps driver +2.6% North America, Europe, Asia 2026–2032
Supervisory climate stress testing by central banks driver +2.2% Europe, UK, APAC 2026–2031
Property-level data and AI-enabled analytics driver +2.4% Global 2026–2035
Scientific uncertainty and model divergence restraint −1.9% Global 2026–2033
Exposure data gaps and high data acquisition cost restraint −1.6% Emerging markets 2026–2031
Regulatory fragmentation across jurisdictions restraint −1.4% North America, Global 2026–2029
Source: Next Move Strategy Consulting

Growth Drivers

What Is the Primary Growth Driver of the Climate Risk Modeling Market?

Disclosure rules are the clearest demand engine. The IFRS Foundation reports that 36 jurisdictions are adopting or aligning with ISSB standards, and IFRS S2 requires companies to describe the current and anticipated financial effects of material climate risks. Our analysis shows that this wording pushes issuers toward quantified scenario analysis, which in turn raises demand for licensed models, asset-level data, and audit-ready outputs across listed companies, banks, and insurers.

How Is Rising Insured Loss Experience Driving Climate Risk Modeling Market Growth?
Aon estimates that global insured natural catastrophe losses reached USD 127 Billion in 2025, marking the sixth consecutive year in which insured catastrophe losses exceeded USD 100 Billion. The global insurance protection gap stood at 51%. Verisk models an average annual insured loss of USD 152 Billion for the industry. We found that such figures keep capital models, reinsurance purchasing, and underwriting guidelines dependent on frequent model updates.

Growth Inhibitors

What Is Restraining the Climate Risk Modeling Market?

Scientific attribution remains the main restraint. Verisk reports that only about 1% of annual increases in modeled average annual loss comes from long-term climate effects, with exposure growth explaining most of the rest. Buyers therefore question the incremental value of climate-adjusted views. Aon also finds that more than 90% of assets in Asia remain uninsured, which limits insurer-funded demand in the fastest growing economies.

What Are the Growth Opportunities?

Where Does Asset-level Adaptation Finance Create Demand?

Lenders that price resilience upgrades need building level loss estimates before and after retrofits. Vendors that offer digital twin style asset models can show avoided loss from flood defenses or cooling upgrades. Banking and lending and Corporates and real estate benefit most, with combined 2035 revenue of USD 5.05 Billion.

How Can Emerging Market Protection Gaps Open New Buyers?

Aon finds that Jamaica secured more than USD 0.65 Billion of liquidity within two months of Hurricane Melissa through a parametric catastrophe bond. Governments in underinsured regions want models that set triggers, size layers, and prove basis risk. The Government and public sector segment benefits, with revenue rising from USD 0.23 Billion in 2026 to USD 1.00 Billion by 2035.

Can Transition Risk Analytics Expand Beyond Large Banks?

Smaller lenders, private credit funds, and wealth managers now seek the same emissions and scenario data used by global banks. Cloud-based platforms that integrate transition risk metrics into portfolio management tools can lower adoption costs for smaller lenders, private credit funds, and wealth managers. Transition risk revenue is projected to reach USD 4.15 Billion by 2035, led by Asset management and investing.

Segmentation Analysis

2025 (USD Billion)
2035 (USD Billion)
Software and models 2025: $1.15 Billion | 2035: $5.10 Billion
Software and
Data and analytics 2025: $1.05 Billion | 2035: $4.40 Billion
Data and ana
Advisory and managed services 2025: $0.70 Billion | 2035: $3.20 Billion
Advisory and
Software and models $1.15 Billion $5.10 Billion 15.8%
Data and analytics $1.05 Billion $4.40 Billion 15.3%
Advisory and managed services $0.70 Billion $3.20 Billion 16.7%

Which Offering Leads the Climate Risk Modeling Market?

Software and models are estimated to have accounted for the largest offering share in 2025, with revenue projected to increase from USD 1.15 Billion to USD 5.10 Billion by 2035. The advisory and managed services segment is projected to grow at the fastest CAGR of 16.7% during 2026–2035. Moody's RMS alone operates about 400 risk models, and platforms built on machine learning now downscale those outputs to individual assets. Advisory and managed services grow faster because disclosure teams lack in house modeling skills.

2025 (USD Billion)
2035 (USD Billion)
Category A
Category B
Category C
Category D
Segment Item 2025 (USD Billion) 2035 (USD Billion) CAGR
Category A $10.0 USD Billion $40.0 USD Billion 25.0%
Category B $17.1 USD Billion $51.1 USD Billion 15.0%
Category C $24.2 USD Billion $62.2 USD Billion 25.0%
Category D $31.3 USD Billion $73.3 USD Billion 11.0%

Segment-wise data is locked

Unlock complete segment-wise numbers for By Risk Type.

Unlock Full Data

Physical risk held the largest share, expanding from USD 1.98 Billion in 2025 to USD 8.55 Billion by 2035; Transition risk is the fastest growing at 16.1% CAGR from 2026–2035.

2025 (USD Billion)
2035 (USD Billion)
Category A
Category B
Category C
Category D
Segment Item 2025 (USD Billion) 2035 (USD Billion) CAGR
Category A $10.0 USD Billion $40.0 USD Billion 26.0%
Category B $17.1 USD Billion $51.1 USD Billion 16.0%
Category C $24.2 USD Billion $62.2 USD Billion 18.0%
Category D $31.3 USD Billion $73.3 USD Billion 8.0%

Segment-wise data is locked

Unlock complete segment-wise numbers for By End User.

Unlock Full Data

Insurance and reinsurance held the largest share, expanding from USD 1.02 Billion in 2025 to USD 3.90 Billion by 2035; Government and public sector is the fastest growing at 17.7% CAGR from 2026–2035.

Growth Opportunities

Our findings suggest that three opportunities offer the clearest revenue paths in the Climate Risk Modeling Market through 2035.
Where Does Asset-level Adaptation Finance Create Demand?

Lenders that price resilience upgrades need building level loss estimates before and after retrofits. Vendors that offer digital twin style asset models can show avoided loss from flood defenses or cooling upgrades. Banking and lending and Corporates and real estate benefit most, with combined 2035 revenue of USD 5.05 Billion.

How Can Emerging Market Protection Gaps Open New Buyers?

Aon finds that Jamaica secured more than USD 0.65 Billion of liquidity within two months of Hurricane Melissa through a parametric catastrophe bond. Governments in underinsured regions want models that set triggers, size layers, and prove basis risk. The Government and public sector segment benefits, with revenue rising from USD 0.23 Billion in 2026 to USD 1.00 Billion by 2035.

Can Transition Risk Analytics Expand Beyond Large Banks?

Smaller lenders, private credit funds, and wealth managers now seek the same emissions and scenario data used by global banks. Cloud-based platforms that integrate transition risk metrics into portfolio management tools can lower adoption costs for smaller lenders, private credit funds, and wealth managers. Transition risk revenue is projected to reach USD 4.15 Billion by 2035, led by Asset management and investing.

Regional Outlook

2025 (USD Billion)
2035 (USD Billion)
North Americ
Europe
Asia-Pacific
Middle East
Latin Americ
Region 2025 (USD Billion) 2035 (USD Billion) CAGR (%)
North America $10.0 USD Billion $40.0 USD Billion 9.0%
Europe $17.1 USD Billion $51.1 USD Billion 27.0%
Asia-Pacific $24.2 USD Billion $62.2 USD Billion 25.0%
Middle East & Africa $31.3 USD Billion $73.3 USD Billion 23.0%
Latin America $38.4 USD Billion $84.4 USD Billion 12.0%

Regional data is locked

Unlock complete regional numbers for this market.

Unlock Full Data

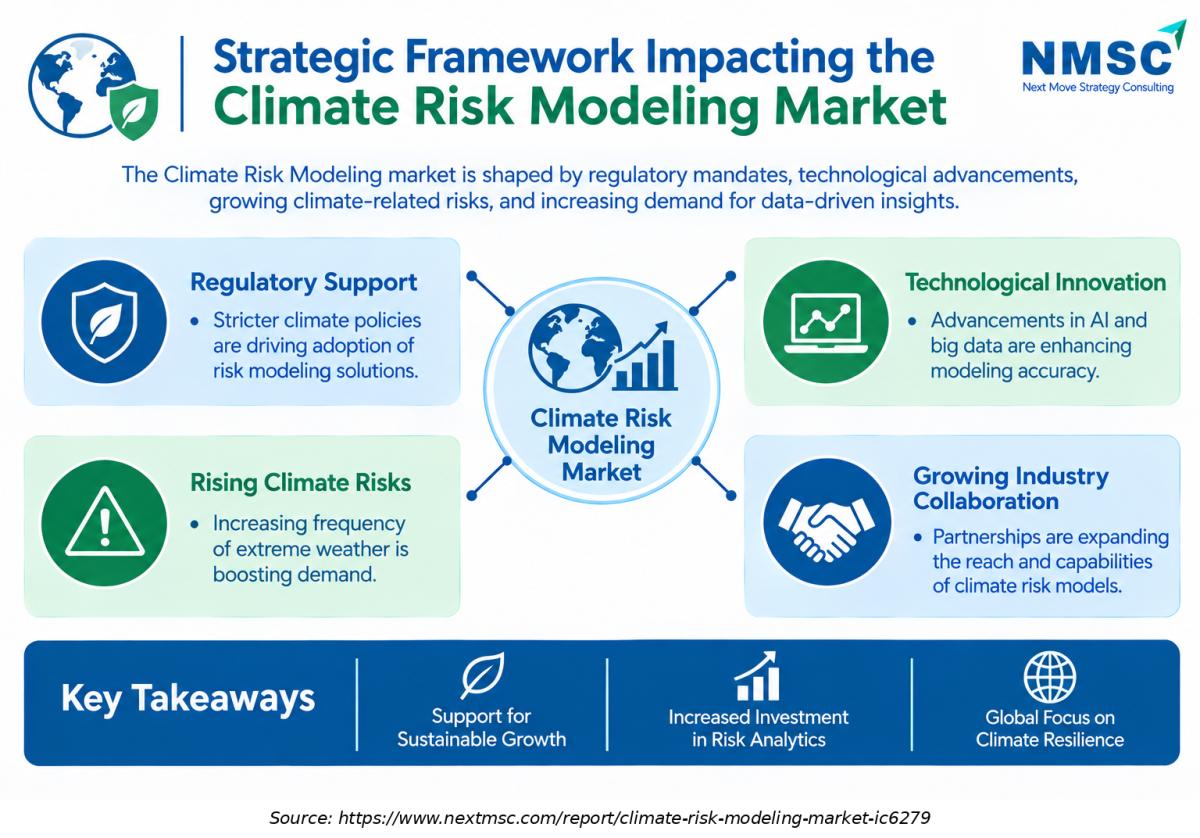
Strategic Framework Impacting the Climate Risk Modeling Market
Strategic Framework Impacting the Climate Risk Modeling Market

The infographic highlights the Strategic Framework Impacting the Climate Risk Modeling Market, focusing on regulatory support, technological innovation, rising climate risks, and growing industry collaboration. It illustrates how stricter climate policies, AI and big data advancements, increasing extreme weather events, and strategic partnerships support the adoption of advanced risk modeling solutions, strengthen climate resilience, encourage investment in risk analytics, and drive long-term market growth

Competitive Landscape

Our analysis shows that the Climate Risk Modeling Market blends data and ratings groups, catastrophe model specialists, and young analytics firms.

How Do Companies Compete in the Climate Risk Modeling Industry?

Competition turns on scientific credibility, coverage, and workflow fit. Established groups such as Moody's, Verisk, MSCI, S&P Global, and ICE bundle climate analytics with ratings, index, or catastrophe franchises, which gives them distribution to banks and insurers. Specialists compete on depth for particular perils or geographies. Pricing follows subscription tiers tied to portfolio size, and global vendors expand through regional partners and local data agreements.

Which Archetypes Dominate the Risk Modeling Market?

Three archetypes dominate. Catastrophe model providers differentiate on validated loss engines and insurer trust. Financial data platforms differentiate on portfolio integration and regulatory reporting. Analytics startups differentiate on speed, resolution, and flexible application programming interfaces. We found that the boundaries are blurring, since each group is adding the strengths of the others through partnerships and acquisitions.

How Are Vendors Differentiating Through Innovation?

Vendors invest in climate conditioned catastrophe models, property-level physics, and financial metrics validated against observed losses. Aon added forward-looking projections from its Climate Risk Monitor to its 2026 loss report, and Climate X markets a digital twin of the Earth. Differentiation increasingly rests on transparent methodology, because buyers must defend model choices to supervisors and auditors.

What Does M&A Activity Show About Market Direction?

Consolidation is focused on physical risk specialists. MSCI agreed to acquire First Street for USD 0.12 Billion in cash in June 2026, and KatRisk acquired RED in April 2026 to add earthquake and flood models. Moody's bought RMS in 2021 for about USD 2.00 Billion. Our assessment indicates that scale buyers want proprietary hazard science rather than licensed data, which will keep deal activity high.

Key Market Players

Based on research conducted by NMSC, the following verified companies lead the market, listed in ranked order.

Moody's Corporation Verisk Analytics, Inc. MSCI Inc. S&P Global Inc. Intercontinental Exchange, Inc. Aon plc KatRisk (a Technosylva company) Jupiter Intelligence Risk Frontiers Climate X

Latest Developments

We observed that 2025 and 2026 announcements in the Climate Risk Modeling Market cluster around acquisitions, platform openness, and data partnerships.

Date Event
August 2025 ICE launched physical and transition climate risk data for more than five million private companies.
January 2026 Aon released its 2026 Climate and Catastrophe Insight report with forward-looking climate projections from its Climate Risk Monitor.
February 2026 Verisk and S&P Global Energy announced a data collaboration to integrate Verisk climate catastrophe data into Climanomics.

Expert Insights

Dr. Ron Dembo

Dr. Ron Dembo

Founder and CEO | RiskThinking.AI

"Balance sheets are broken by the extreme events in the tail, not the averages."

Analyst Interpretation

The comment emphasizes the importance of modelling extreme climate events rather than relying exclusively on average climate conditions. Financial institutions, insurers and asset owners increasingly require granular risk assessments to evaluate exposure to floods, hurricanes, wildfires and other extreme weather events. This is supporting demand for AI-enabled climate risk platforms, asset-level simulation tools and forward-looking probabilistic modelling solutions.

Investment Opportunities

Where Are Capital Inflows Concentrating?

Capital is flowing to physical risk specialists and platforms that own proprietary hazard science. MSCI's USD 0.12 Billion cash offer for First Street and KatRisk's purchase of RED show that strategic buyers pay for validated models and building level data. Investors can target the software and models segment, which is estimated at USD 1.36 Billion in 2026 and projected to reach USD 5.10 Billion by 2035, supported by demand for recurring software subscriptions and advanced climate risk analytics.

Which Infrastructure Investments Support Growth?

Cloud native modeling platforms, open model exchanges, and building footprint databases are the core infrastructure. Verisk Synergy Studio and Verisk Model Exchange unify exposure management and model access, while ICE draws on 1.6 billion building footprints. Our assessment indicates that investment in data pipelines and computing capacity will raise gross margins for scale vendors, and it will lower entry costs for specialists.

How Do ESG Considerations Shape Investment?

ESG and adaptation mandates convert climate risk modeling into a procurement requirement. Asset managers want evidence that holdings withstand physical hazards, and lenders link pricing to resilience. Our findings suggest that vendors with transparent, externally validated methods attract longer contracts. Asset management and investing spending is projected to reach USD 2.75 Billion by 2035, which signals sustained appetite for portfolio level analytics.

Key Benefits for Stakeholders

How Do Enterprise and Industry Leaders Benefit?

Enterprise leaders gain a quantified view of asset exposure, supplier concentration, and insurance needs. This report's forecasts and segment data help executives size budgets for modeling tools, compare delivery models, and plan resilience capital spending. Corporates and real estate spending reaches USD 2.20 Billion by 2035, which shows how quickly demand is spreading beyond financial institutions.

How Do Investors and Financial Analysts Benefit?

Investors receive reconciled market sizes, growth rates by offering, risk type, end user, and region, along with a ranked list of verified vendors. Our analysis shows that these data points allow cleaner comparison of valuation multiples against segment growth. Analysts can also track acquisitions and partnerships that signal consolidation, and they can test scenarios for regulatory change.

How Do Technology Vendors and Product Teams Benefit?

Product teams can use the segment forecasts to prioritize perils, geographies, and delivery formats. The report shows that advisory and managed services grow at 16.7% CAGR, which supports investment in managed offerings. Competitive profiles and development timelines also help vendors assess whether partnerships, acquisitions, or participation in open model exchanges would strengthen their market position.

Key Market Segments Evaluated

By Offering

  • Software and models
  • Data and analytics
  • Advisory and managed services

By Risk Type

  • Physical risk
  • Transition risk

By End User

  • Insurance and reinsurance
  • Banking and lending
  • Asset management and investing
  • Corporates and real estate
  • Government and public sector

By Region

  • North America 
    • U.S.
    • Canada
    • Mexico
  • Europe 
    • UK
    • Germany
    • France
    • Italy
    • Spain
    • Sweden
    • Denmark
    • Finland
    • Netherlands
    • Rest of Europe
  • Asia-Pacific 
    • China
    • India
    • Japan
    • South Korea
    • Taiwan
    • Indonesia
    • Vietnam
    • Australia
    • Philippines
    • Malaysia
    • Rest of APAC
  • Middle East & Africa 
    • Saudi Arabia
    • UAE
    • Egypt
    • Israel
    • Turkey
    • Nigeria
    • South Africa
    • Rest of MEA
  • Latin America 
    • Brazil
    • Argentina
    • Chile
    • Colombia
    • Rest of LATAM

Conclusion & Recommendations

The outlook is strong, with revenue rising from USD 3.38 Billion in 2026 to USD 12.70 Billion by 2035. Disclosure requirements, insured catastrophe losses, and increasing availability of property-level data are expected to support double-digit market growth, although scientific uncertainty and regulatory fragmentation may moderate regional adoption. Our findings suggest that the market will mature into a recurring subscription industry anchored by validated financial loss metrics.

What Strategic Positioning Recommendations Does NMSC Offer?

Vendors should invest in validation against observed losses, publish clear methods, and connect outputs to regulatory reports. Insurers and banks should hold more than one model view to reduce model risk. Corporates should begin with critical sites and suppliers before extending coverage. NMSC's analysis indicates that partnerships with data platforms deliver faster reach than building direct sales teams in new regions.

What Is the Investment Attractiveness of the Climate Risk Modeling Market?

Attractiveness is high for software, models, and property data, where recurring revenue and switching costs support margins. Strategic acquirers are paying for proprietary science, which lifts valuations for credible specialists. Risks include dependence on regulatory timelines and the cost of data licensing. Our assessment indicates that investors should favor platforms with insurer validated models and multi region client bases.

What Are the Market Shifts and Key Risks in the Climate Risk Modeling Market?

Key shifts include open model exchanges, natural language interfaces, and insurance adjusted climate data for lenders. Main risks are scientific uncertainty, uneven regulation, and data gaps in emerging markets, which together could slow expansion in a weak case. We found that vendors with transparent validation will be better protected against these pressures.

What Are the Primary Growth Pathways Through 2035?

Growth will come from three pathways. Banks and asset managers will extend scenario analysis across portfolios, governments will fund adaptation and parametric programs, and corporates will model site and supplier exposure. Asia and Africa offer the fastest gains, with APAC reaching USD 3.20 Billion by 2035. Advisory and managed services will help new buyers adopt these tools.

FAQs

Sources & References

1.

IFRS Foundation: Jurisdictional profiles for ISSB Standards

ifrs.org
2.

Aon: 2026 Climate and Catastrophe Insight report (Australia release)

aon.com
3.

Aon: Climate and Catastrophe Insight

aon.com
4.

Verisk: 2026 Global Modeled Catastrophe Losses Report

verisk.com
5.

Verisk: KatRisk joins Verisk Model Exchange (26 May 2026)

s29.q4cdn.com
6.

S&P Global: Verisk and S&P Global Energy collaboration (17 February 2026)

press.spglobal.com
7.

Verisk: Models and climate change documentation

docs.risksolutions.verisk.com
8.

Verisk: Extreme event solutions newsroom

verisk.com
9.

MSCI: Acquisition of First Street (24 June 2026)

ir.msci.com/node/22796
10.

MSCI: Form 8-K, second quarter 2026 results (SEC)

sec.gov
11.

Moody's: Physical climate risk modeling at Moody's RMS

moodys.com
12.

Moody's: Covéa and the RMS HD severe convective storm model

moodys.com
13.

Moody's: Announcement to acquire RMS (Business Wire)

businesswire.com
14.

KatRisk: Acquisition of RED (7 April 2026)

prnewswire.com
15.

ICE: Climate risk data for private companies (12 August 2025)

ir.theice.com
16.

ICE: Geospatial platform expansion (2025)

ir.theice.com
17.

Jupiter Intelligence: ClimateScore Global

jupiterintel.com/climatescore-global
18.

Risk Frontiers: Climate change physical risk modelling

riskfrontiers.com
19.

Climate X: Seed funding announcement and Spectra platform

climate-x.com

About the Author

Mayurima Roy

Mayurima Roy

Mayurima Roy is Research Analyst at Next Move Strategy Consulting, where she has spent 4 years working across the firm's full industry coverage rather than a single fixed vertical. Her work centers on structured research, ongoing trend tracking, competitive assessment, and insight-led content development, translating complex market data into clear, decision-ready narratives that support informed client decision-making across diverse global industries, market sectors, and world regions every day.

About the Reviewer

Supradip Baul

Supradip Baul

Supradip Baul is an accomplished business consultant and strategist with over a decade of rich experience in market intelligence, strategy, technology, and business transformation. His work has included rigorous qualitative and quantitative analysis across multiple industries, helping clients shape investment decisions and long-term roadmaps. Earlier in his career, he was associated with Gartner, where he contributed to industry-leading reports and market share analyses. He has worked with leading global companies and holds an MBA with a dual specialization in Marketing and Finance.

Download Free Sample

Pratyush Kumar Das

PRATYUSH KUMAR DAS

Assistant Manager

Polycab India Limited

We would like to express our appreciation for the data and insights provided by nextmsc. We are very pleased with the quality and depth of the information, which has proven to be highly valuable and beneficial for our business decision-making.

Semih Kavaklioglu

SEMIH KAVAKLIOGLU

Co-Founder & Sales Manager

Decortie

I work a lot in the marketing industry and I know that research is an essential part of any campaign. I have used Market research reports for my own products and I found them to be very informative and well-researched. The team here produces insightful reports for a good price

Rishabh Jogani

RISHABH JOGANI

Strategy Analyst

Accenture Japan

We are incredibly impressed with the market report on the real estate market in India provided by Next Move Strategy Consulting. The report was thorough, insightful, and well-structured, offering deep analysis and actionable recommendations. It not only captured the current trends and dynamics but also provided a forward-looking perspective that has been invaluable for our strategic planning. Their team demonstrated exceptional professionalism, attention to detail, and a profound understanding of the industry. The data-driven insights and clarity of presentation exceeded our expectations, making complex market trends easy to understand. We highly recommend Next Move Strategy Consulting to anyone looking for reliable and comprehensive market research services. Their expertise has given us the confidence to navigate the complexities of the Indian real estate market with clarity and foresight.

Henri Knyphausen

HENRI KNYPHAUSEN

Partner at Singulier [Ex-BCG]

Singulier

I recently engaged NEXTMSC.com for a commercial due diligence project within the intralogistics sector, and I am pleased to provide a reference based on my experience. In utilizing NEXTMSC.com's services, I found their report to offer valuable insights into market dynamics and key industry players. The initial report provided a solid foundation for our analysis. However, as we were investigating a smaller target in the market, and I had specific customization requests requiring additional research. These requests included detailed information on product portfolios of various players and sub-market sizes, both inclusive and exclusive of certain product categories. NEXTMSC.com demonstrated commendable responsiveness and agility in accommodating these customization requests. Within a timeframe of 1-2 weeks, they delivered a revised report that met our specific needs. Furthermore, they were receptive to my follow-up inquiries, ensuring clarity and understanding of the data provided. The final deliverable significantly contributed to our due diligence efforts. One of NEXTMSC.com's notable strengths lies in their qualitative research capabilities. However, for future engagements, I would recommend the inclusion of a quantified market model in Excel format. Such a model would offer the ability to conduct in-depth analyses and explore various market segments, including country-specific data and subcomponent breakdowns. Based on my positive experience, I would not hesitate to work with NEXTMSC.com again. Their responsiveness, willingness to accommodate customization requests, and commitment to delivering actionable insights make them a reliable partner for commercial research projects.

Melanie Samko

MELANIE SAMKO

Director of Marketing

TOSOH BIOSCIENCE, INC.

The information provided by NMSC is incredibly valuable, thank you so much for such a excellent work. I really appreciate it. I will make sure to reference all of it, in my summary document.

Custom Market Research Services

We will customize the research for you if the listed report does not fully match your requirements.

Get 30% Free Customization

Select License

This website uses cookies to ensure you get the best experience on our website. Learn more

✖