Catalyst Market Size & Share Forecast, 2026-2035

Catalyst Market size was USD 44.45 Billion in 2025, projected to reach USD 71.14 Billion by 2035, growing at a CAGR of 5.0% from 2026 to 2035. Key drivers include expanding refining and petrochemical capacity, tightening emission regulations, and rising catalyst replacement demand, with Asia-Pacific leading the market.

Download Free Sample PDF
Base Year (2025)
$44.45 Billion
Forecast (2035)
$71.14 Billion
CAGR (2026-2035)
5.0%
Top Region
Asia-Pacific

What Is the Catalyst Market Size?

The global catalyst market size was valued at USD 44.45 billion in 2025 and is estimated at USD 47.12 billion in 2026, forecast to reach USD 71.14 billion by 2035, expanding at a 5.0% CAGR between 2026 and 2035. Asia-Pacific leads with approximately 40% share, while heterogeneous catalysts dominate all other product types with approximately 68% share.

We observed that growth is broad-based across every segmentation axis, with biocatalysts and precious metal recycling driving the most pronounced structural shifts through 2035.

Catalyst Market Size & Share Forecast, 2026-2035 Revenue Forecast
Values in USD Billion

2025 $44.45 Billion
2025
2026 $46.67 Billion
2026
2027 $49.01 Billion
2027
2028 $51.46 Billion
2028
2029 $54.03 Billion
2029
2030 $56.73 Billion
2030
2031 $59.57 Billion
2031
2032 $62.55 Billion
2032
2033 $65.67 Billion
2033
2034 $68.96 Billion
2034
2035 $71.14 Billion
2035

Key Takeaways

By Product Type: Heterogeneous Catalyst held the largest share of approximately 68% (USD 30.23 billion) in 2025; Biocatalyst is the fastest-growing sub-segment at 8.8% CAGR from 2026–2035.

By Raw Material: Metals held the largest share of approximately 34% (USD 15.11 billion) in 2025; Composite and Advanced Materials is the fastest-growing sub-segment at approximately 9.0% CAGR from 2026–2035.

By Application: Petroleum Refining held the largest share of approximately 34% (USD 15.11 billion) in 2025; Energy and Fuels is the fastest-growing sub-segment at 10.1% CAGR from 2026–2035.

By Process: Fresh Catalyst Supply held the largest share of approximately 58% (USD 25.78 billion) in 2025; Recycling and Metal Recovery is the fastest-growing sub-segment at approximately 8.5% CAGR from 2026–2035.

By Form: Pellets and Extrudates held the largest share of approximately 40% (USD 17.78 billion) in 2025; Coated Substrates and Washcoats is the fastest-growing sub-segment at approximately 7.8% CAGR from 2026–2035.

By Reactor Technology: Fixed Bed Systems held the largest share of approximately 52% (USD 23.11 billion) in 2025; Microreactors and Process Intensification is the fastest-growing sub-segment at approximately 9.3% CAGR from 2026–2035.

By Distribution Channel: Direct OEM and Plant Supply held the largest share of approximately 48% (USD 21.34 billion) in 2025; Licensing Partners is the fastest-growing sub-segment at approximately 7.5% CAGR from 2026–2035.

By End-Use Industry: Oil and Gas held the largest share of approximately 32% (USD 14.22 billion) in 2025; Energy and Power is the fastest-growing sub-segment at 9.5% CAGR from 2026–2035.

Dominant Region: Asia-Pacific dominated with approximately 40% revenue share (USD 17.78 billion) in 2025.

Fastest-Growing Region: Middle East & Africa is expected to register the highest CAGR of 8.6% during 2026–2035.

Dominant Country: China led with approximately USD 8.18 billion in 2025.

Fastest-Growing Country: UAE is the fastest-growing country at approximately 9.2% CAGR from 2026–2035.

Market Opportunity: The catalyst market is expected to create an absolute dollar opportunity of USD 24.02 billion between 2026 and 2035, presenting significant investment potential across refining, petrochemical, and emission-control catalyst value chains.

According to NMSC analysis, refiners and petrochemical producers are increasingly consolidating catalyst vendor panels around suppliers offering integrated fresh-catalyst supply, regeneration, and precious metal recovery services, a shift that favors full-lifecycle providers over single-product specialists as emission and hydrogen-economy regulations tighten through 2035.

What Does the Catalyst Market Encompass?

The catalyst market encompasses heterogeneous, homogeneous, and biocatalyst products, along with the raw materials, reactor technologies, and services used to accelerate chemical reactions across refining, petrochemical, environmental, and specialty manufacturing processes. Our assessment indicates that the scope spans supported metal, zeolite , metal oxide, single atom, and nanocatalyst formulations supplied to oil and gas, chemical and petrochemical, automotive, pharmaceutical, and energy and power end users worldwide. The category has evolved from a commodity refining input into a technology-differentiated market, driven by tightening emission standards, hydrogen economy investment, and precious metal recovery economics.
Regulatory frameworks such as the U.S. Environmental Protection Agency's emission control standards and the European Chemicals Agency's REACH regulation shape catalyst formulation and precious metal handling requirements, while national energy agencies increasingly reference catalytic hydrogen production in decarbonization roadmaps. We observed that technology adoption is shifting toward single atom and nanocatalyst architectures that improve selectivity and reduce precious metal loading. NMSC's analysis indicates that this structural shift, combined with growing hydrogen production capacity, is redefining sourcing criteria across the market.

Ecosystem Analysis Of The Catalyst Market

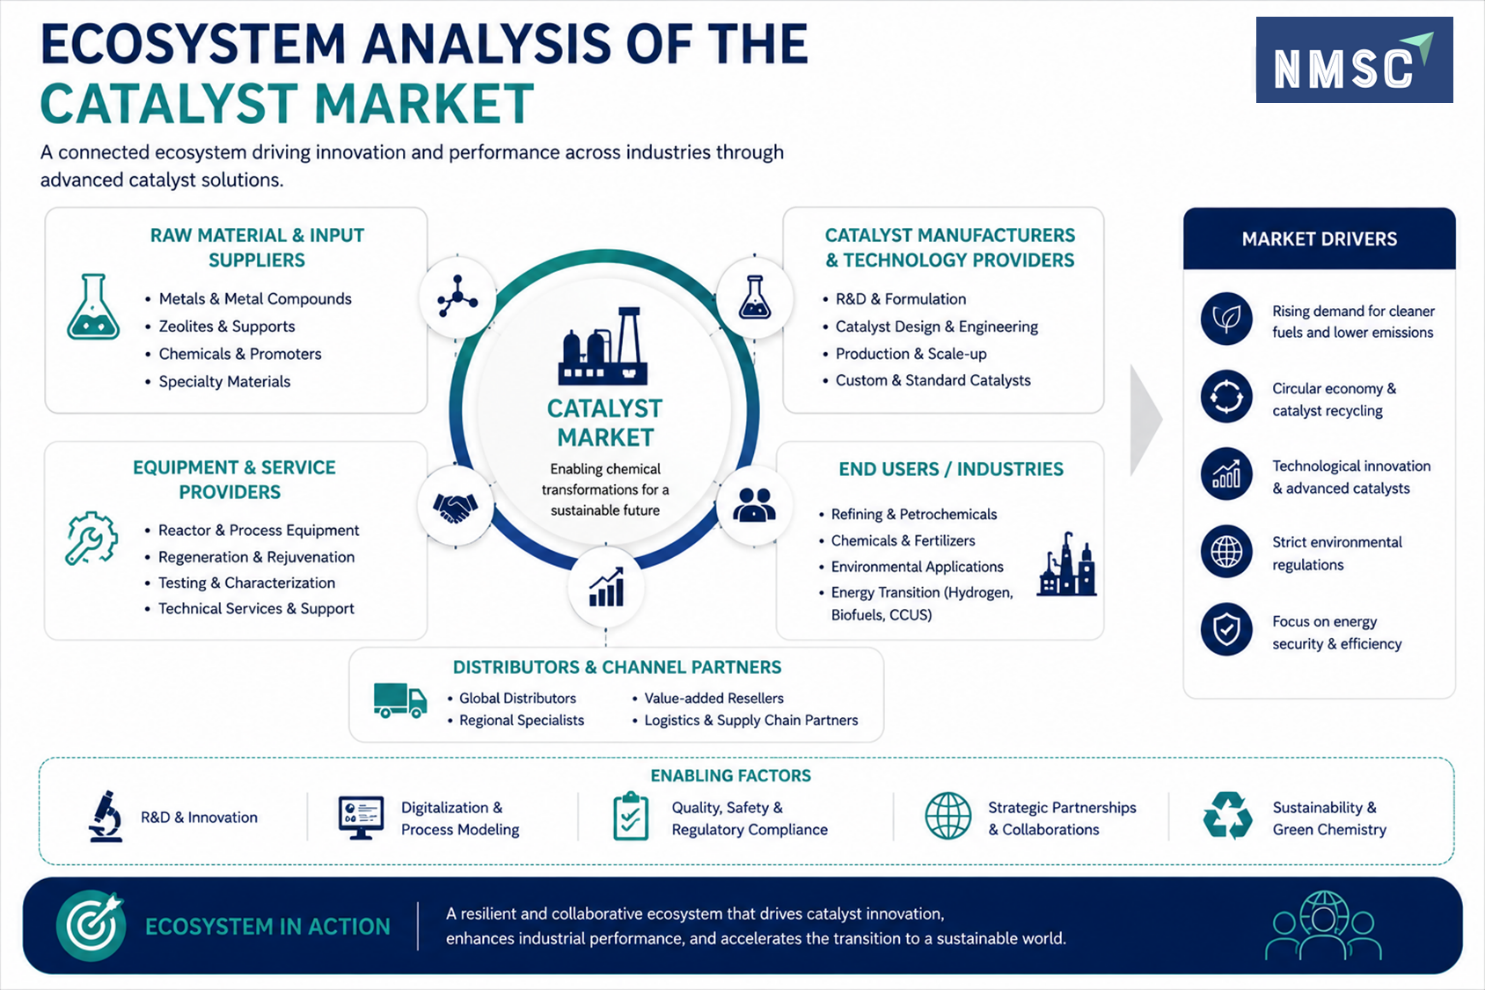
The infographic presents the Ecosystem Analysis of the Market, showing how raw material suppliers, catalyst manufacturers, technology providers, equipment and service companies, distributors, and end-use industries interact across the market. It highlights major applications in refining, petrochemicals, chemicals, fertilizers, environmental solutions, and energy-transition technologies, while emphasizing key drivers such as sustainability, catalyst recycling, innovation, environmental regulations, and energy efficiency.

Market Drivers & Dynamics

Interactive Dataset
Expanding petrochemical and refining capacity in Asia-Pacific driver +1.2% Asia-Pacific 2026–2035
Tightening emission control regulations driver +0.9% Global 2026–2035
Rising hydrogen economy and fuel cell investment driver +0.8% Global 2026–2032
Growing biocatalyst adoption in pharma and fine chemicals driver +0.6% North America, Europe 2026–2035
Precious metal recovery and recycling economics driver +0.5% Global 2026–2035
Middle East petrochemical and refining investment driver +0.7% Middle East & Africa 2026–2035
Volatile precious metal and raw material prices restraint −0.6% Global 2026–2032
Declining internal combustion engine production restraint −0.4% Europe, North America 2026–2035
High cost of advanced catalyst R&D and qualification cycles restraint −0.3% Global 2026–2032
Source: Next Move Strategy Consulting

Growth Drivers

What Is the Primary Growth Driver of the Catalyst Market?

Expanding petrochemical and refining capacity across Asia-Pacific is the primary driver of the market. National energy agencies across the region continue to approve new refining and olefin production capacity to meet rising domestic fuel and plastics demand, sustaining baseline demand for fluid catalytic cracking, hydroprocessing , and polymerization catalysts. We observed that this capacity expansion, reinforced by aging refining infrastructure elsewhere requiring catalyst replacement, continues to anchor demand across developed and emerging markets alike.

How Is Emission Regulation Driving Catalyst Market Growth?

Tightening emission control regulation is accelerating growth in environmental and automotive catalyst categories. The U.S. Environmental Protection Agency's vehicle and industrial emission standards, alongside the European Union's Euro 7 framework, require increasingly sophisticated catalytic converter and industrial emission control formulations. Our assessment indicates that this regulatory pathway is compressing replacement cycles for automotive and industrial emission catalysts across major manufacturing economies.

Growth Inhibitors

What Is Restraining Catalyst Market Expansion?

Volatile precious metal and raw material prices restrain market expansion, particularly for platinum group metal-dependent catalyst categories. The U.S. Geological Survey's mineral commodity data tracks continued price volatility in platinum, palladium, and rhodium supply chains, which directly affects catalyst manufacturing costs. We found that manufacturers lacking metal recovery and recycling capability face particular exposure, as input cost swings compress margins compared with vertically integrated suppliers offering recycling services.

What Are the Growth Opportunities?

How Can Advanced Nanocatalyst Platforms Unlock Value for Chemical Producers?

Advanced nanocatalyst platforms present a whitespace opportunity for suppliers serving fine chemical and specialty synthesis producers. Manufacturers that commercialize nanocatalyst formulations with improved selectivity and lower precious metal loading stand to capture recurring contracts as chemical producers seek to reduce both reaction byproducts and metal input costs simultaneously.

Where Do Precious Metal Recovery Services Create New Demand?

Precious metal recovery and regeneration services represent an underpenetrated opportunity for catalyst suppliers with integrated recycling capability. Providers that offer closed-loop recovery of platinum, palladium, and rhodium from spent catalyst streams can secure long-term contracts with oil and gas and chemical and petrochemical customers, benefiting from recurring service revenue tied to multi-year catalyst replacement cycles.

How Can Hydrogen Production Catalysts Benefit Energy and Power Buyers?

Catalysts engineered for green hydrogen production and purification create an opportunity for suppliers serving energy and power buyers scaling electrolysis and blue hydrogen capacity. Early movers that secure qualification with utilities and energy companies can differentiate ahead of broader hydrogen economy build-out through 2035.

Segmentation Analysis

2025 (USD Billion)
2035 (USD Billion)
Heterogeneous Catalyst 2025: $30.23 Billion | 2035: $45.17 Billion
Heterogeneou
Homogeneous Catalyst 2025: $8.89 Billion | 2035: $13.87 Billion
Homogeneous
Biocatalyst 2025: $5.33 Billion | 2035: $12.09 Billion
Biocatalyst
Heterogeneous Catalyst $30.23 Billion $45.17 Billion 3.9%
Homogeneous Catalyst $8.89 Billion $13.87 Billion 4.4%
Biocatalyst $5.33 Billion $12.09 Billion 8.8%

Which Product Type Segment Dominates the Catalyst Market?

Heterogeneous Catalyst, encompassing supported metal, zeolite, and metal oxide formulations, led the market with USD 30.23 billion in 2025, supported by its dominant role in petroleum refining and petrochemical processes. We observed that Biocatalyst is the fastest-growing product type, expanding at an 8.8% CAGR from 2026 to 2035, as pharmaceutical and fine chemical manufacturers increasingly specify enzyme-based routes for selective, low-waste synthesis.

2025 (USD Billion)
2035 (USD Billion)
Metals
Precious Met
Base Metals
Chemical Com
Acids
Segment Item 2025 (USD Billion) 2035 (USD Billion) CAGR
Metals $10.0 USD Billion $40.0 USD Billion 14.0%
Precious Metals $17.1 USD Billion $51.1 USD Billion 24.0%
Base Metals $24.2 USD Billion $62.2 USD Billion 10.0%
Chemical Compounds $31.3 USD Billion $73.3 USD Billion 16.0%
Acids $38.4 USD Billion $84.4 USD Billion 27.0%

Segment-wise data not detailed in this view

Unlock complete segment-wise numbers for By Raw Material.

Unlock Full Data
2025 (USD Billion)
2035 (USD Billion)
Petroleum Refining 2025: $15.11 Billion | 2035: $20.63 Billion
Petroleum Re
Chemical Synthesis 2025: $9.78 Billion | 2035: $15.30 Billion
Chemical Syn
Polymers and Petrochemicals 2025: $8.00 Billion | 2035: $12.45 Billion
Polymers and
Environmental Control 2025: $5.33 Billion | 2035: $8.89 Billion
Environmenta
Energy and Fuels 2025: $3.11 Billion | 2035: $7.83 Billion
Energy and F
Electronics and Specialty Manufacturing 2025: $1.78 Billion | 2035: $4.27 Billion
Electronics
Other Applications 2025: $1.33 Billion | 2035: $1.78 Billion
Other Applic
Petroleum Refining $15.11 Billion $20.63 Billion 2.8%
Chemical Synthesis $9.78 Billion $15.30 Billion 4.4%
Polymers and Petrochemicals $8.00 Billion $12.45 Billion 4.4%
Environmental Control $5.33 Billion $8.89 Billion 5.2%
Energy and Fuels $3.11 Billion $7.83 Billion 10.1%
Electronics and Specialty Manufacturing $1.78 Billion $4.27 Billion 9.5%
Other Applications $1.33 Billion $1.78 Billion 2.6%

Which Application Segment Leads Catalyst Market Demand?

Petroleum Refining remained the dominant application across the market, reaching USD 15.11 billion in 2025 due to its role in fluid catalytic cracking, hydroprocessing , and catalytic reforming across the global refining base. Our findings suggest that Energy and Fuels is the fastest-growing application, registering a 10.1% CAGR from 2026 to 2035, as hydrogen production and purification catalysts scale alongside expanding fuel cell and electrolyzer deployment.

2025 (USD Billion)
2035 (USD Billion)
Fresh Cataly
Regeneration
Recycling an
Disposal and
Segment Item 2025 (USD Billion) 2035 (USD Billion) CAGR
Fresh Catalyst Supply $10.0 USD Billion $40.0 USD Billion 10.0%
Regeneration and Rejuvenation $17.1 USD Billion $51.1 USD Billion 12.0%
Recycling and Metal Recovery $24.2 USD Billion $62.2 USD Billion 18.0%
Disposal and Waste Handling $31.3 USD Billion $73.3 USD Billion 16.0%

Segment-wise data not detailed in this view

Unlock complete segment-wise numbers for By Process.

Unlock Full Data
2025 (USD Billion)
2035 (USD Billion)
Pellets and
Powder and G
Monolith and
Coated Subst
Structured S
Segment Item 2025 (USD Billion) 2035 (USD Billion) CAGR
Pellets and Extrudates $10.0 USD Billion $40.0 USD Billion 8.0%
Powder and Granules $17.1 USD Billion $51.1 USD Billion 10.0%
Monolith and Honeycomb $24.2 USD Billion $62.2 USD Billion 16.0%
Coated Substrates and Washcoats $31.3 USD Billion $73.3 USD Billion 22.0%
Structured Shapes $38.4 USD Billion $84.4 USD Billion 9.0%

Segment-wise data not detailed in this view

Unlock complete segment-wise numbers for By Form.

Unlock Full Data
2025 (USD Billion)
2035 (USD Billion)
Fixed Bed Sy
Fluidized Be
Monolith Rea
Moving Bed a
Membrane Rea
Segment Item 2025 (USD Billion) 2035 (USD Billion) CAGR
Fixed Bed Systems $10.0 USD Billion $40.0 USD Billion 8.0%
Fluidized Bed Reactors $17.1 USD Billion $51.1 USD Billion 14.0%
Monolith Reactors $24.2 USD Billion $62.2 USD Billion 24.0%
Moving Bed and Circulating Systems $31.3 USD Billion $73.3 USD Billion 26.0%
Membrane Reactor Systems $38.4 USD Billion $84.4 USD Billion 17.0%

Segment-wise data not detailed in this view

Unlock complete segment-wise numbers for By Reactor Technology.

Unlock Full Data
2025 (USD Billion)
2035 (USD Billion)
Direct OEM a
Aftermarket
Third Party
Distributors
Licensing Pa
Segment Item 2025 (USD Billion) 2035 (USD Billion) CAGR
Direct OEM and Plant Supply $10.0 USD Billion $40.0 USD Billion 8.0%
Aftermarket and Replacement $17.1 USD Billion $51.1 USD Billion 10.0%
Third Party Service Providers $24.2 USD Billion $62.2 USD Billion 20.0%
Distributors and Repackagers $31.3 USD Billion $73.3 USD Billion 10.0%
Licensing Partners $38.4 USD Billion $84.4 USD Billion 25.0%

Segment-wise data not detailed in this view

Unlock complete segment-wise numbers for By Distribution Channel.

Unlock Full Data
2025 (USD Billion)
2035 (USD Billion)
Oil and Gas 2025: $14.22 Billion | 2035: $19.56 Billion
Oil and Gas
Chemical and Petrochemical 2025: $13.34 Billion | 2035: $20.63 Billion
Chemical and
Automotive 2025: $5.78 Billion | 2035: $8.54 Billion
Automotive
Pharmaceuticals 2025: $4.00 Billion | 2035: $8.18 Billion
Pharmaceutic
Environmental Services 2025: $3.56 Billion | 2035: $7.11 Billion
Environmenta
Energy and Power 2025: $2.22 Billion | 2035: $5.34 Billion
Energy and P
Other Manufacturing 2025: $1.33 Billion | 2035: $1.78 Billion
Other Manufa
Oil and Gas $14.22 Billion $19.56 Billion 2.9%
Chemical and Petrochemical $13.34 Billion $20.63 Billion 4.3%
Automotive $5.78 Billion $8.54 Billion 3.8%
Pharmaceuticals $4.00 Billion $8.18 Billion 7.6%
Environmental Services $3.56 Billion $7.11 Billion 7.3%
Energy and Power $2.22 Billion $5.34 Billion 9.5%
Other Manufacturing $1.33 Billion $1.78 Billion 2.6%

Which End-Use Industry Drives the Catalyst Market?

Oil and Gas remained the leading end-use industry within the market, valued at USD 14.22 billion in 2025 on sustained refining throughput and catalyst replacement demand. Based on research conducted by NMSC, we found that Energy and Power is the fastest-growing end-use industry, registering a 9.5% CAGR from 2026 to 2035, as utilities and independent power producers scale hydrogen and fuel cell catalyst deployment alongside emission control retrofits.

Growth Opportunities

Three forward-looking whitespace opportunities stand out for suppliers positioning ahead of 2035 demand across the catalyst market.

How Can Advanced Nanocatalyst Platforms Unlock Value for Chemical Producers?

Advanced nanocatalyst platforms present a whitespace opportunity for suppliers serving fine chemical and specialty synthesis producers. Manufacturers that commercialize nanocatalyst formulations with improved selectivity and lower precious metal loading stand to capture recurring contracts as chemical producers seek to reduce both reaction byproducts and metal input costs simultaneously.

Where Do Precious Metal Recovery Services Create New Demand?

Precious metal recovery and regeneration services represent an underpenetrated opportunity for catalyst suppliers with integrated recycling capability. Providers that offer closed-loop recovery of platinum, palladium, and rhodium from spent catalyst streams can secure long-term contracts with oil and gas and chemical and petrochemical customers, benefiting from recurring service revenue tied to multi-year catalyst replacement cycles.

How Can Hydrogen Production Catalysts Benefit Energy and Power Buyers?

Catalysts engineered for green hydrogen production and purification create an opportunity for suppliers serving energy and power buyers scaling electrolysis and blue hydrogen capacity. Early movers that secure qualification with utilities and energy companies can differentiate ahead of broader hydrogen economy build-out through 2035.

Price Point Analysis of the Catalyst Market

Price Point Analysis of the Catalyst Market
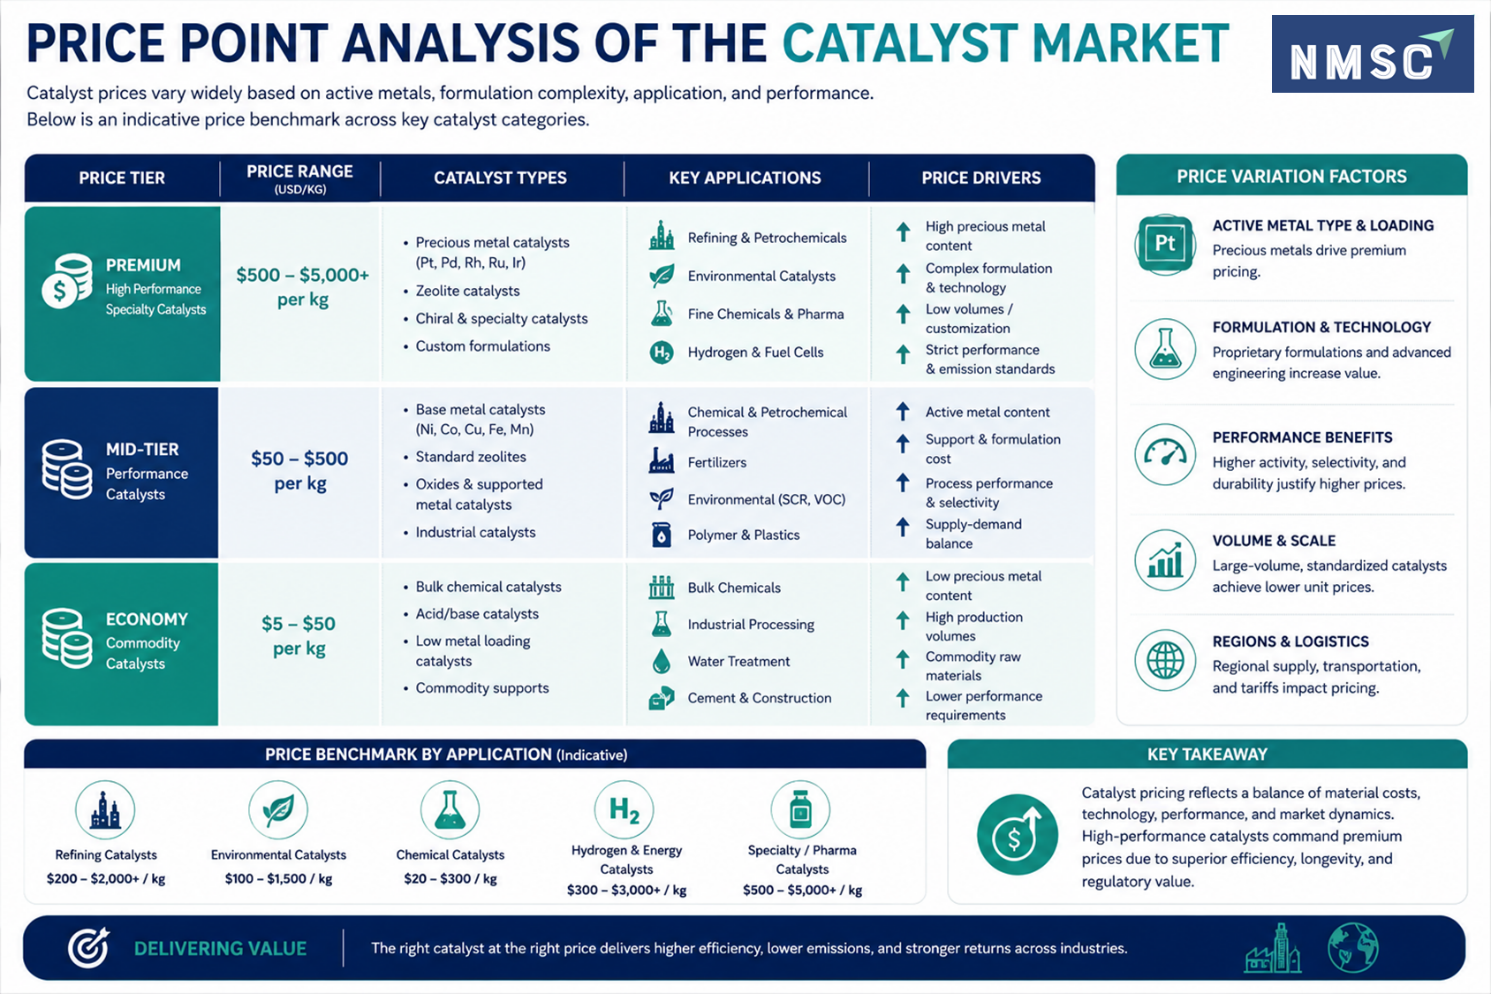
The infographic presents a Price Point Analysis of the Market, categorizing catalysts into premium, mid-tier, and economy price segments based on catalyst type, application, and performance. It highlights major pricing factors such as precious metal content, formulation complexity, catalyst performance, production scale, supply-demand conditions, and regional logistics. An indicative application benchmark further illustrates pricing differences across refining, environmental, chemical, hydrogen, energy, and specialty catalyst applications.

Regional Outlook

North America $10.67 Billion $14.58 Billion 2.9%
Europe $9.33 Billion $12.45 Billion 2.6%
Asia-Pacific $17.78 Billion $29.88 Billion 5.3%
Middle East & Africa $4.00 Billion $8.89 Billion 8.6%
Latin America $2.67 Billion $5.34 Billion 7.3%

Competitive Landscape

We observed that the market features a moderately consolidated competitive landscape, with diversified chemical majors competing alongside specialized catalyst technology licensors on precious metal efficiency, recycling capability, and process licensing credentials. Dimension | Assessment Market Structure | Moderately consolidated; leading companies profiled in this report account for a substantial share of Industry revenue, while numerous regional Asia-Pacific catalyst manufacturers serve cost-sensitive refining and petrochemical demand. Innovation Focus | Single atom catalysts, nanocatalyst formulations, precious metal recovery, and hydrogen production catalyst integration dominate current innovation pipelines across leading suppliers. M&A Activity | Active consolidation through strategic acquisitions, exemplified by Honeywell's completed acquisition of Johnson Matthey's Catalyst Technologies business, broadening its refining, petrochemical, and renewable fuels catalyst portfolio. Source: www.nextmsc.com

How Do Companies Compete in the Catalyst Market?

Companies compete primarily on precious metal efficiency, process licensing depth, and recycling capability across the Industry . Global players such as BASF SE and Honeywell International Inc. leverage integrated catalyst manufacturing and process technology licensing to serve multinational refiners, while regional Asia-Pacific manufacturers compete on cost efficiency and rapid production turnaround for standard heterogeneous catalyst formats supplied to smaller regional refiners and chemical producers.

Which Competitive Archetypes Dominate the Catalyst Market?

Two archetypes dominate the market: diversified chemical majors offering full-spectrum catalyst portfolios alongside process technology licensing, and specialized precious metal and recovery-focused suppliers serving niche recycling and metal chemistry needs. BASF SE and Honeywell International Inc. exemplify the diversified chemical major archetype, while Umicore NV/SA and Heraeus Holding GmbH exemplify the specialized precious metal archetype serving technically demanding recovery and chemistry missions.

How Are Companies Differentiating Through Innovation in Catalysts?

Innovation and differentiation strategy increasingly center on precious metal loading reduction and hydrogen production catalyst engineering. Topsoe A/S's SK-501 Flex high temperature shift catalyst and Umicore's expanded homogeneous catalyst production both replace conventional formulations with more efficient, process-flexible alternatives. Our analysis shows that suppliers unable to demonstrate credible metal-efficiency and recycling pathways risk exclusion from refiner and chemical producer request-for-proposal shortlists in North America and Europe.

What M&A and Expansion Activity Is Shaping the Catalyst Market?

Strategic acquisitions, capacity expansion, and process technology partnerships continue to consolidate catalyst capabilities within the Industry . Honeywell's completion of its Johnson Matthey Catalyst Technologies acquisition in July 2026 illustrates how process technology providers pursue end-to-end catalyst and licensing integration, while Umicore's expansion of homogeneous catalyst production capacity demonstrates how precious metal specialists pursue geographic and product-line expansion across industrial applications.

Key Market Players

Our assessment indicates that the following 20 companies are actively shaping product innovation, precious metal efficiency, and process technology licensing within the global catalyst market.

BASF SE Honeywell International Inc. (UOP) Clariant AG W. R. Grace & Co. Shell plc (Shell Catalysts & Technologies) Sinopec Catalyst Co., Ltd. Topsoe A/S Umicore NV/SA Axens SA Ketjen Group B.V. LyondellBasell Industries N.V. Evonik Industries AG Technip Energies N.V. INEOS Group Limited Mitsubishi Chemical Corporation Heraeus Holding GmbH Tanaka Kikinzoku Kogyo K.K. ExxonMobil Chemical Company Sumitomo Chemical Co., Ltd. Mitsui Chemicals, Inc.

Latest Developments

We observed that recent company activity centers on strategic acquisitions, catalyst product launches, and precious metal recovery capacity expansion across the catalyst market.

Date Event
May 2025 Umicore announced an expansion of homogeneous catalyst production at its Catoosa, Oklahoma, facility. Construction was scheduled to begin in 2025, with production expected in early 2027, adding multi-ton supply capacity for specialty-chemical customers and strengthening its Grubbs Catalyst® manufacturing position.

Expert Insights

Maurits van Tol

Maurits van Tol

CEO, Catalyst Technologies | Johnson Matthey

"The next phase of the energy transition will be defined less by conceptual breakthroughs and more by delivery of energy security."

Analyst Interpretation

The statement indicates a shift in the energy-transition landscape from developing new concepts toward commercial-scale deployment of proven technologies. For the catalyst market, this is particularly relevant because catalysts are essential to improving conversion efficiency, managing alternative feedstocks and enabling lower-carbon production of fuels and chemicals. Van Tol further emphasizes that scaling these technologies will require robust catalysts, well-designed processes and reliable execution, particularly for sustainable aviation fuel, hydrogen and other low-carbon applications

Investment Opportunities

What Capital Inflows Are Targeting the Catalyst Market?

Capital inflows into the market are increasingly directed toward precious metal efficiency technology and hydrogen production catalyst development. Strategic investors continue to fund platform expansion, as seen in Honeywell's acquisition of Johnson Matthey's Catalyst Technologies business, valued at up to £1.8 billion, and Umicore's homogeneous catalyst capacity expansion, both announced in 2025. We observed that investors favor suppliers demonstrating validated recycling and metal-recovery credentials, viewing precious metal cost management as a proxy for long-term margin retention.

How Is Infrastructure Investment Supporting Catalyst Manufacturing?

Infrastructure investment is expanding catalyst production and research capacity across Asia-Pacific, Europe, and the Middle East to serve rising refining and petrochemical demand. Our findings suggest that suppliers are investing in semiconductor -grade catalyst manufacturing and expanded precious metal recovery facilities, along with new innovation centers such as Umicore's Shanghai catalysis facility, to improve regional responsiveness for automotive and industrial applications.

What ESG Considerations Are Shaping Catalyst Investment Decisions?

Environmental, social, and governance considerations are central to investment decisions across the Industry , with reduced precious metal consumption and lower process emissions as key criteria. The U.S. Environmental Protection Agency continues to track industrial emission data that informs asset owner sustainability disclosures. We found that investors increasingly favor manufacturers demonstrating measurable reductions in metal loading and energy intensity, treating it as a governance indicator alongside labor and safety compliance.

Key Benefits for Stakeholders

How Does This Report Benefit Enterprise and Industry Leaders?

Enterprise and industry leaders gain access to validated segmentation, competitive benchmarking, and regional demand forecasts that support sourcing and vendor-selection decisions across the catalyst Industry. Our analysis shows that detailed product type, application, and end-use industry breakdowns help procurement teams align specifications with regulatory and process requirements while identifying underserved raw material and reactor technology segments for portfolio expansion.

How Does This Report Benefit Investors and Financial Analysts?

Investors and financial analysts benefit from consistent, single-point market size and CAGR estimates that support valuation and capital-allocation decisions across the catalyst supply chain. We observed that the report's regional and segment-level growth differentials help identify which catalyst suppliers and recovery specialists are best positioned to capture above-market growth in biocatalyst and hydrogen-linked categories through 2035.

How Does This Report Benefit Technology Vendors and Product Teams?

Technology vendors and product teams gain insight into emerging design requirements, including single atom architectures and precious metal recovery integration, that are reshaping the Industry . Our findings suggest that this analysis helps R&D teams prioritize development roadmaps around metal-efficiency certification and hydrogen production catalysts increasingly required by refiner and chemical producer request-for-proposal processes.

Key Market Segments Evaluated

By Product Type

  • Heterogeneous Catalyst
  • Homogeneous Catalyst
  • Biocatalyst

By Raw Material

  • Metals
  • Precious Metals
  • Base Metals
  • Chemical Compounds
  • Acids
  • Amines
  • Peroxides
  • Phosphoric Class
  • Zeolites and Molecular Sieves
  • Supports and Carriers
  • Alumina
  • Silica
  • Carbon
  • Ceria and Mixed Oxides
  • Organometallic Precursors
  • Composite and Advanced Materials
  • Metal Organic Frameworks
  • Carbon Nanotubes and Graphene
  • Hybrid Supports

By Application

  • Petroleum Refining
  • Chemical Synthesis
  • Polymers and Petrochemicals
  • Environmental Control
  • Energy and Fuels
  • Electronics and Specialty Manufacturing
  • Other Applications

By Process

  • Fresh Catalyst Supply
  • Regeneration and Rejuvenation
  • Recycling and Metal Recovery
  • Disposal and Waste Handling

By Form

  • Pellets and Extrudates
  • Powder and Granules
  • Monolith and Honeycomb
  • Coated Substrates and Washcoats
  • Structured Shapes
  • Membrane and Thin Film

By Reactor Technology

  • Fixed Bed Systems
  • Fluidized Bed Reactors
  • Monolith Reactors
  • Moving Bed and Circulating Systems
  • Membrane Reactor Systems
  • Microreactors and Process Intensification
  • Electrochemical and Photoreactor Systems

By Distribution Channel

  • Direct OEM and Plant Supply
  • Aftermarket and Replacement
  • Third Party Service Providers
  • Distributors and Repackagers
  • Licensing Partners

By End-Use Industry

  • Oil and Gas
  • Chemical and Petrochemical
  • Automotive
  • Pharmaceuticals
  • Environmental Services
  • Energy and Power
  • Other Manufacturing

Conclusion & Recommendations

The long-term outlook for the market remains positive, supported by a USD 24.02 billion absolute dollar opportunity between 2026 and 2035 and sustained Asia-Pacific refining and petrochemical capacity growth. NMSC's analysis indicates that suppliers combining precious metal efficiency with recycling capability will be best positioned to capture the market's projected growth from USD 47.12 billion in 2026 to USD 71.14 billion by 2035.

What Strategic Positioning Should Suppliers Pursue in the Catalyst Market?

Suppliers should prioritize precious metal recovery and single atom catalyst capability to secure long-term refiner and chemical producer contracts. Our assessment indicates that suppliers investing early in biocatalyst and hydrogen production catalyst capability, alongside expanded recycling infrastructure, will be best positioned to capture premium pricing within the market as emission regulation tightens and hydrogen economy investment scales.

How Attractive Is the Catalyst Market for New Investment?

The catalyst Industry presents an attractive investment case, supported by a USD 24.02 billion absolute dollar opportunity between 2026 and 2035 and above-average growth in Middle East & Africa and biocatalyst categories. We found that investment attractiveness is highest for providers combining precious metal recovery credentials with scaled process technology licensing, positioning them to serve both cost-sensitive and premium refiner segments simultaneously.

What Market Shifts and Key Risks Should Stakeholders Monitor?

Stakeholders should monitor precious metal price volatility, declining internal combustion engine production, and competitive pressure from low-cost regional manufacturers as key risks to the market. Our analysis shows that suppliers unable to adapt to evolving EPA and REACH requirements risk losing contracts to competitors with certified recycling and metal-recovery platforms, particularly within increasingly regulated North American and European markets.

What Are the Key Growth Pathways for the Catalyst Market?

Key growth pathways include expanding biocatalyst and single atom catalyst portfolios, scaling precious metal recovery infrastructure, and deepening penetration into Middle East & Africa and Asia-Pacific refining channels. NMSC's analysis indicates that suppliers pursuing these pathways while maintaining cost competitiveness in standard heterogeneous catalyst categories will be best positioned to capture the catalyst market's projected growth through 2035.

FAQs

About the Author

Sikha Haritwal

Sikha Haritwal

Sikha Haritwal is an assistant manager with strong expertise in market research, data analysis, and cross-functional coordination. She plays a key role in leading complex research initiatives, strengthening analytical rigor, and enabling data-driven decision-making across teams. Known for her leadership mindset and structured problem-solving approach, she supports process improvement, enhances operational efficiency, and contributes to building scalable frameworks that drive long-term strategic outcomes and organizational effectiveness.

About the Reviewer

Supradip Baul

Supradip Baul

Supradip Baul is an accomplished business consultant and strategist with over a decade of rich experience in market intelligence, strategy, technology, and business transformation. His work has included rigorous qualitative and quantitative analysis across multiple industries, helping clients shape investment decisions and long-term roadmaps. Earlier in his career, he was associated with Gartner, where he contributed to industry-leading reports and market share analyses. He has worked with leading global companies and holds an MBA with a dual specialization in Marketing and Finance.

Download Free Sample

Kevin Coker

KEVIN COKER

Founder, CEO and Board Diector

Proxima Clinical Research

I have been using Next MSC reports for product positioning in a new geography for a long time. They have by far the best reports I have found and the price is reasonable too!

Semih Kavaklioglu

SEMIH KAVAKLIOGLU

Co-Founder & Sales Manager

Decortie

I work a lot in the marketing industry and I know that research is an essential part of any campaign. I have used Market research reports for my own products and I found them to be very informative and well-researched. The team here produces insightful reports for a good price

Pratyush Kumar Das

PRATYUSH KUMAR DAS

Assistant Manager

Polycab India Limited

We would like to express our appreciation for the data and insights provided by nextmsc. We are very pleased with the quality and depth of the information, which has proven to be highly valuable and beneficial for our business decision-making.

Amos Chang

AMOS CHANG

Strategy Consultant

Kardex Group

I have bought the intralogistics market reports from NMSC two times so far. Joseph and his team are always very helpful and flexible in responding to any customization requirements on the report. Their expertise in market reports really helps us steer the day-to-day business. I will definitely recommend and come back myself whenever there is a need.

Gaurav Jaiswal

GAURAV JAISWAL

Founder & CEO

Yano Charge Private Limited

The EV Charging market research report provided by the NextMSC was exceptionally detailed and insightful. It offered a comprehensive analysis that proved to be a game-changer for our strategic planning. Truly a testament to the NextMSC’s expertise and thoroughness in EV market landscape & analysis.

Custom Market Research Services

We will customize the research for you if the listed report does not fully match your requirements.

Get 30% Free Customization

Select License

This website uses cookies to ensure you get the best experience on our website. Learn more

✖