Systems Market")
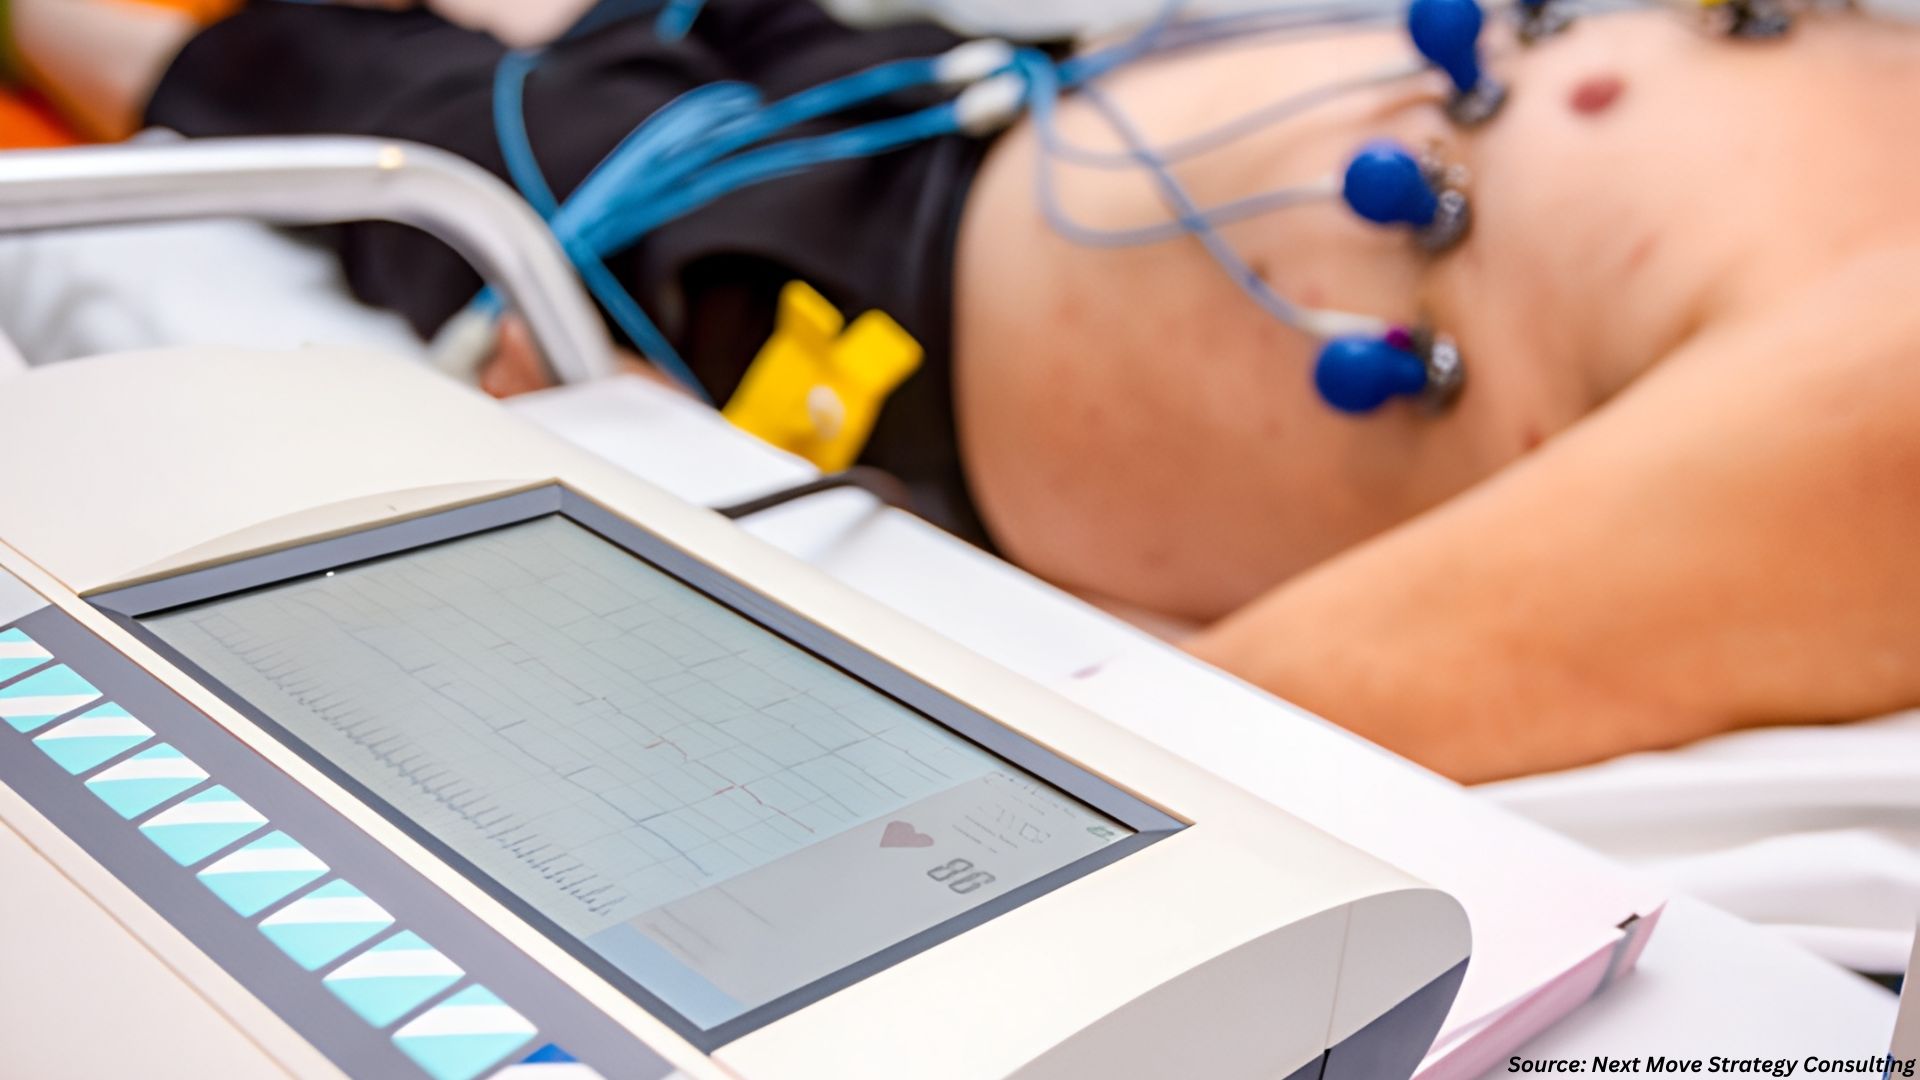
Cone-Beam Computed Tomography (CBCT) Systems Market by Type (Floor Mounted and Wall Mounted), by Patient Position (Seated, Supine, and Standing), by Detector Type (Image Intensifier and Flat-Panel Detector), by Field of View (Small FOV Systems, Medium FOV Systems, and Large FOV Systems), by Application (Dental, ENT Applications, Orthopedic Conditions, and Others), and by End-Users (Dental Clinics, Hospitals, and Others)– Global Opportunity Analysis and Industry Forecast, 2025–2030
Industry: Healthcare | Lastest Edition: January 31, 2026 | No of Pages: 702 | No. of Tables: 708 | No. of Figures: 633 | Format: PDF | Report Code : HC343
Cone-Beam Computed Tomography (CBCT) Systems Market Overview
The global Cone-Beam Computed Tomography (CBCT) Systems Market size was valued at USD 1.50 billion in 2024 and is predicted to reach USD 3.45 billion by 2030, with a CAGR of 10.3% from 2025 to 2030. In terms of volume the market size was 19.69 thousand units in 2024 and is projected to reach 53.72 thousand units by 2030, with a CAGR of 13.9% from 2025 to 2030.
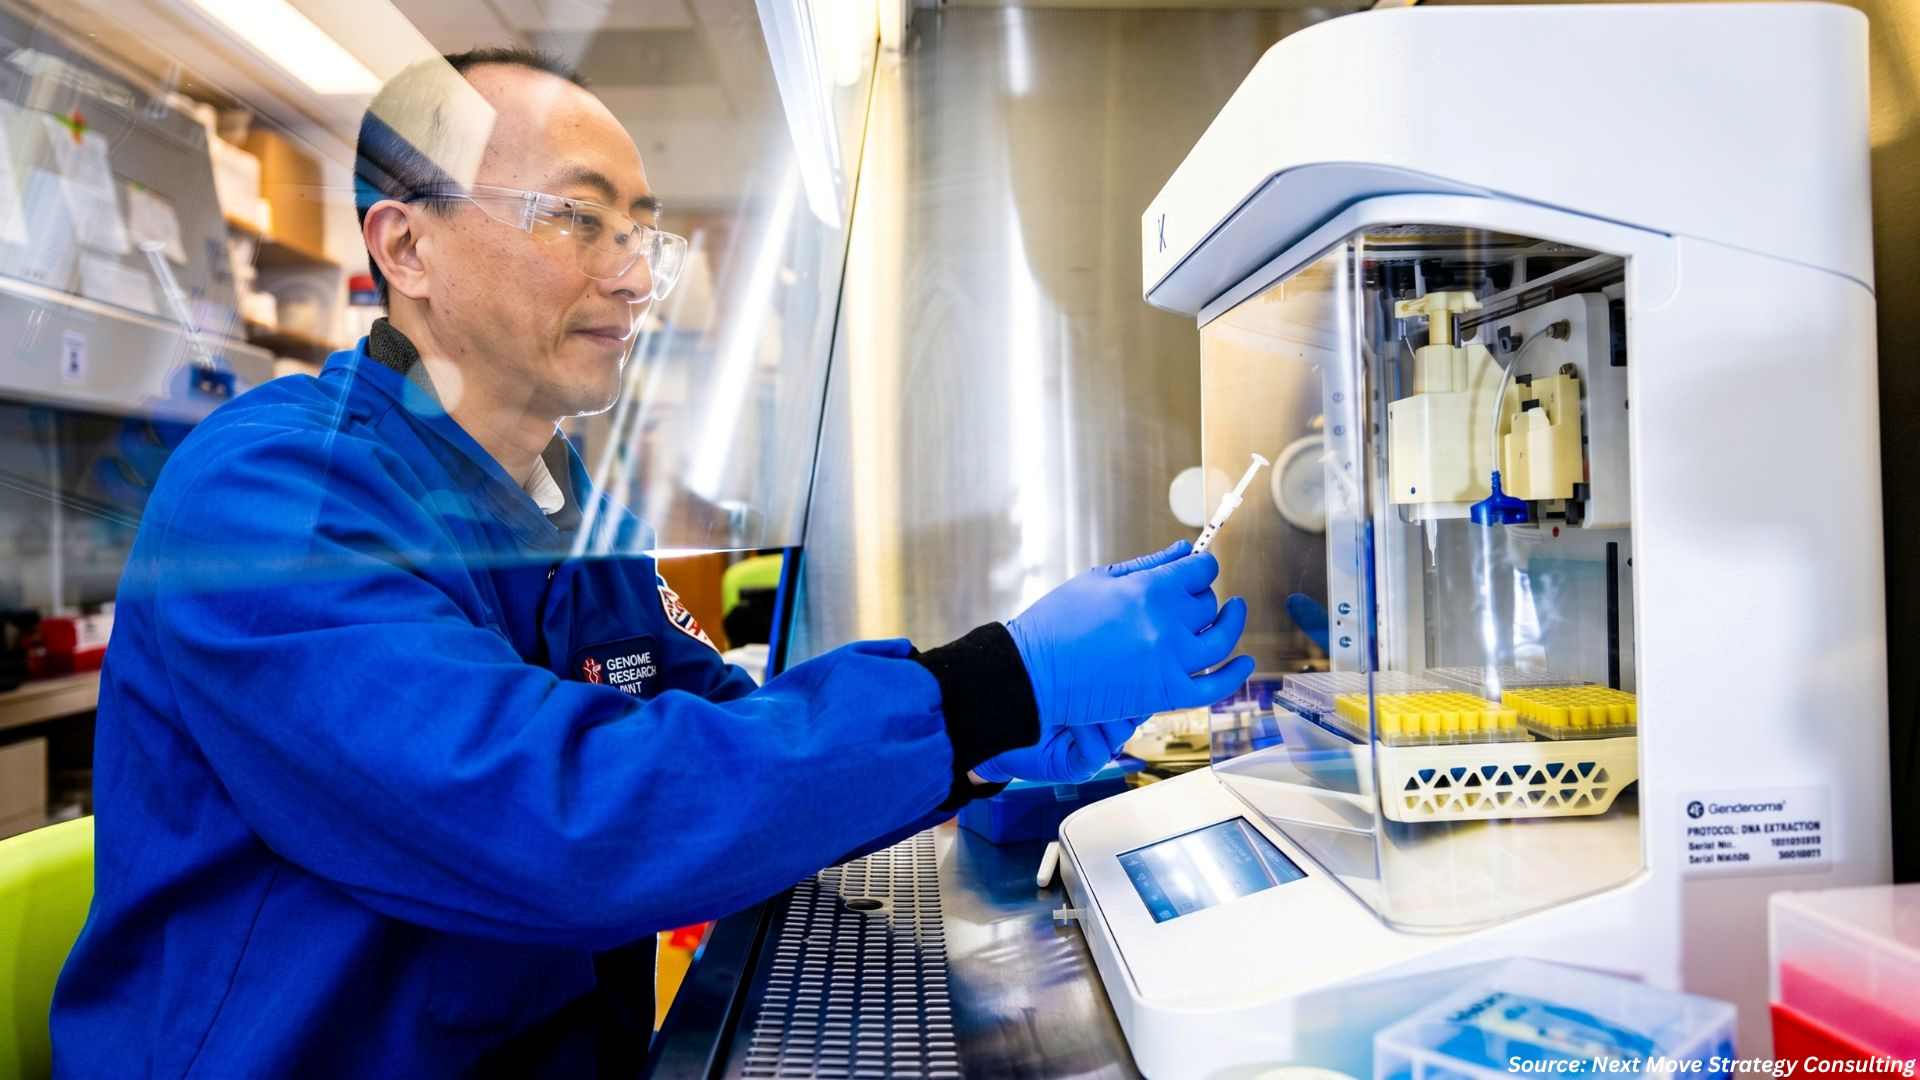
The factors such as expansion of diagnostic imaging, high prevenance of oral health issues along with ongoing technological advancements in the CBCT system by key players accelerates the market growth at global level. However, availability of alternative imaging technologies, such as MRI and traditional CT scans, poses a significant challenge to the growth of the CBCT system market. On the contrary, the incorporation of artificial intelligence (AI) into CBCT systems offers promising future opportunities for market growth by improving diagnostic accuracy and efficiency that is expected to enhance the market expansion in the forthcoming years.
Moreover, the key players such as Planmeca OY, Koninklijke Philips N.V., Vatech Co., Ltd., Dentsply Sirona Inc., Envista Holdings, and others are taking various initiatives such as product launches, and collaboration across various countries and regions to maintain their competitive position in the market. These initiatives are fueling the growth of the market by enhancing the diagnostic and imaging capability of CBCT systems that caters to the vary changing needs of patient diagnostics and treatment planning. With advancements in CBCT systems, the scope of imaging by CBCT system is enhancing as it is no more limited to dental imaging rather it is also used for diagnosis and imaging of other body parts such as ENT, neural and spine, orthopaedic condition along with veterinary applications, ultimately accelerating the adoption of CBCT system by healthcare and diagnosis centres.
Expansion of the Diagnostic Imaging Market Boosts Market Growth
The growing healthcare industry of the diagnostic imaging segment is increasing the growth of CBCT systems, that involve advanced imaging solutions in the service of healthcare to provide diagnostic accuracy and also enhanced patient care. As stated by McKinsey & Company's report, diagnostic imaging market now accounts for USD 27.4 billion in the year 2022 and goes up to 41.6 billion in the year 2030. This expansion in the field of diagnostic imaging, increases the demand for CBCT systems by healthcare institutions to facilitate the changing needs of patient diagnosis and treatment planning.
Increasing Oral Health Concerns Drive the Demand for CBCT Systems
Increasing prevalence of oral diseases such as tooth decay, periodontal disease, and oral cancers increases the use of CBCT systems for dental diagnostics and treatment planning. The WHO 2023 reported states that nearly 3.5 billion people around the world suffer from oral diseases, and while the three out of four cases of dental disease patients stayed in middle-income countries during 2022. Such rise in oral health problems as it facilitates effective patient care and preventive dental care through precise diagnosis and imaging.
Technological Advancement in CBCT Systems Drives Market Expansion
Advances in CBCT systems are highly driving the market growth by improving diagnostic accuracy and workflow efficiency in medical imaging. Many key players such as Dentsply Sirona, Carestream Dental, Philips, and others in the market are continuously innovating, introducing CBCT products that enhance diagnostic accuracy and streamline workflow efficiency.
For example, in February 2024, NewTom introduced its 7G multi-scan body CBCT system, that enhances diagnostic capabilities by allowing simultaneous imaging of various anatomical areas. The introduction of such advanced CBCT systems addresses essential patient safety concerns and aligns with the increasing demand for non-invasive imaging solutions across diverse medical fields, further boosting cone-beam computed tomography (CBCT) systems market growth.
Alternative Imaging Technologies Prevent the Growth of the CBCT System Market
The availability of alternative imaging technologies, that encompasses MRI and traditional CT scans, poses a great challenge to the growth of the CBCT system industry. Additionally, alternative imaging technologies tend to offer more cost-effective solutions for healthcare facilities. This financial benefit leads many healthcare providers to choose MRI or conventional CT over CBCT, thereby limiting overall cone-beam computed tomography (CBCT) systems market expansion.
Incorporation of AI in CBCT systems holds much promise for further market expansion.
The integration of AI into CBCT systems is supposed to open great growth opportunities within the market in terms of high diagnostic accuracy and efficiency. It is also furthered by applications of machine learning for image optimization and predictive analytics, that should simplify workflows and reduce manual labor while enhancing efficiency and precision overall in a broad range of medical applications of CBCT imaging.
By Patient Position, Floor Mounted CBCT system Dominates the Market
In the seg market, floor-mounted systems hold a dominating share of about 63% of the market. This substantial share indicates the widespread adoption and preference for floor-mounted CBCT systems in various medical imaging applications. These systems are favored for their stability, ease of access, and efficient workflow integration in healthcare settings. Floor-mounted CBCT systems are essential for providing high-quality imaging capabilities, supporting accurate diagnostics, and improving patient care. The dominance of floor-mounted systems highlights their critical role in advancing medical imaging technology and enhancing operational efficiency in clinical environments.
By Application, Orthopedic Conditions Holds the Highest CAGR Of 13.25%
Orthopedic conditions will be the most growth-intensive segment, based on an approximately 13.3% projected CAGR of 2025-2030 period mainly because of growing musculoskeletal disorders, sport injuries, and bone-related cases. Moreover, demand for non-invasive treatment with better and more advanced image resolution is highly supporting the trend for CBCT system adoption in orthopedics.
North America holds the dominant share in the CBCT system market
North America includes the largest cone-beam computed tomography (CBCT) systems market share, due to high healthcare expenditure in the region that spurs providers to invest in such advanced diagnostic technologies to enhance patient care and outcomes. As indicated in the AMA report 2024, spending by the U.S. on healthcare rose to 4.1% in 2022 and hit USD 4.5 trillion in 2023.
This immense expenditure provides the opportunity for healthcare institutions to employ the latest technology such as CBCT that ensures highly accurate 3D images for critical anatomical examinations. This increased healthcare spending accelerates CBCT adoption for enhancing diagnostic accuracy and operational efficiency in the region.
Moreover, increase in government investment towards clinical trials further boosts the adoption of CBCT systems in the region by providing funding for advanced diagnostic tools essential for research. CBCT offer precise, high-resolution imaging, critical for evaluating treatment outcomes and improving clinical trial accuracy.
According to the Canadian Institutes of Health Research, over USD 76.15 million is allocated to 36 clinical trials through the CIHR Clinical Trials Fund since 2022. Such investments enable healthcare providers and research institutions to integrate CBCT technology into their protocols, enhancing diagnostic capabilities and supporting innovative medical research. This integration improves trial efficiency and drives the broader adoption of CBCT systems in clinical and healthcare settings in the region.
Asia-Pacific is Expected to Show a Steady Growth in the CBCT System Market with a CAGR of 12.2% till 2030
Asia-Pacific CBCT system industry is experiencing growth due to the fact that the region is aging, hence vulnerable to complex medical conditions demanding accurate diagnosis and thereby fueling market growth. CBCT delivers high-resolution 3D imaging, that becomes very important for detecting age-related health problems, such as degeneration of joints, bone density loss, and dental issues.
The World Economic Forum published a report that states that in 2023, two-thirds percent of the population of Japan is above 65 years numbering 36.23 million. The need for advance diagnostic tools, such as CBCT, would be more poignant with an elderly population increase in the region due to its application in early diagnosis and improved care for the region's aging populations.
In addition, the oral diseases prevalence within the region that includes tooth decay, periodontal conditions, and oral cancer is further leading to an increasing cone-beam computed tomography (CBCT) systems market demand. According to the latest report by the National Board of Examinations, within India, the severe periodontal disease affected 221 million in 2022, that further accounts for 20.3% of global cases. The growing number of oral diseases in the region means that high-tech diagnostic equipment such as CBCT systems are required for proper diagnosis and treatment of dental conditions.
Competitive Landscape
Several key players operating in the cone-beam computed tomography (CBCT) systems industry include Planmeca OY, Koninklijke Philips N.V., Vatech Co., Ltd., Dentsply Sirona Inc., Envista Holdings, Cefla Medical NA (Newtom), Osstem Implant Co. Ltd., Carestream Dental Technology Limited, J. Morita Mfg. Corp., Hitachi High-Tech Group, Hefei Meyer Optoelectronic Technology Inc., Acteon Group, Genoray Co., Ltd., Xoran Technologies, LLC., Largev Instrument Corp. Ltd, Prexion Inc., HDX WILL, Apteryx Imaging Inc., CurveBeam AI, and 3Shape among others.
")
Note: For the latest market share analysis and in-depth CBCT system industry insights, Request for a Sample PDF Report
These companies are adopting various strategies, including product launches, and collaboration across various countries and regions to maintain their dominance in the market.
|
Date |
Company |
Recent Developments |
|
September 2024 |
DEXIS LLC |
DEXIS, a subsidiary of Envista Holdings, introduced DEXIS Connect Pro, a new software solution tailored for integrating CBCT and intraoral sensor devices. This platform enhances the digital workflow in dental practices, streamlining data management and image capture from various imaging modalities. |
|
July 2024 |
Vatech Co., Ltd. |
Vatech America collaborated with SICAT under a software partnership aimed at enhancing the integration of their respective technologies in the dental imaging sector. This collaboration will allow for improved interoperability between SICAT's treatment planning software and Vatech's advanced imaging systems, including CBCT system. |
|
June 2024
|
Vatech Co., Ltd. |
Vatech launched artificial intelligence (AI) in its diagnostic solutions, significantly enhancing the capabilities of its imaging systems, including cone beam computed tomography (CBCT). This integration aimed to improve diagnostic accuracy by automating image analysis, that facilitate faster identification of dental issues and streamline treatment planning. |
|
February 2024 |
Carestream Dental Technology Limited |
Carestream Dental launched the CS 8200 3D imaging series that is supposed to improve the accuracy of diagnosis in dental medicine. The system was designed based on the most advanced imaging capabilities with the focus on more complicated cases, such as endodontics, surgical assessment, and implant planning. |
|
March 2023 |
Planmeca OY |
Planmeca unveiled new AI-based tools for its Romexi software, aimed at improving the functionality of its imaging systems, including CBCT. This tool installed in CBCT system leverage artificial intelligence to improve the analysis of imaging data, facilitating faster and more accurate diagnostics for dental professionals. |
|
March 2023 |
Osstem Implant Co. Ltd. |
Osstem launched the CBCT T2 Plus system in South Korea, designed to enhance dental imaging capabilities. This system features improved resolution and speed for more accurate diagnostics. |
Cone-Beam Computed Tomography (CBCT) Systems Market Key Segment
By Type
-
Floor Mounted
-
Wall Mounted
By Patient Position
-
Seated
-
Supine
-
Standing
By Detector Type
-
Image Intensifier
-
Flat-Panel Detector
By Field of View
-
Small FOV Systems
-
Medium FOV Systems
-
Large FOV Systems
By Applications
-
Dental
-
Oral and Maxillofacial surgery (OMFS)
-
Endodontics
-
Implant Dentistry
-
Orthodontics
-
General Dentistry
-
Temporomandibular Joint (TMJ)
-
Periodontics
-
Forensic Dentistry
-
-
ENT Applications
-
Orthopedic Conditions
-
Neural and Spine
-
Veterinary
-
Other Application
By End-Users
-
Dental Clinics
-
Hospitals
-
Other End-User
By Region
-
North America
-
The U.S.
-
Canada
-
Mexico
-
- Europe
-
The UK
-
Germany
-
France
-
Italy
-
Spain
-
Denmark
-
Netherlands
-
Finland
-
Sweden
-
Norway
-
Russia
-
Rest of Europe
-
-
Asia Pacific
-
China
-
Japan
-
India
-
South Korea
-
Australia
-
Indonesia
-
Singapore
-
Taiwan
-
Thailand
-
Rest of Asia Pacific
-
-
RoW
-
Latin America
-
Middle East
-
Africa
-
Key Players
-
Planmeca OY
-
Koninklijke Philips N.V.
-
Vatech Co., Ltd.
-
Dentsply Sirona Inc.
-
Envista Holdings
-
Cefla Medical NA (Newtom)
-
Osstem Implant Co. Ltd.
-
Carestream Dental Technology Limited
-
J. Morita Mfg. Corp.
-
Hitachi High-Tech Group
-
Hefei Meyer Optoelectronic Technology Inc.
-
Acteon Group
-
Genoray Co., Ltd.
-
Xoran Technologies, LLC.
-
Largev Instrument Corp. Ltd
-
Prexion Inc.
-
HDX WILL
-
Apteryx Imaging Inc.
-
CurveBeam AI
-
3Shape
Report Scope and Segmentation
|
Parameters |
Details |
|
Market Size in 2024 |
USD 1.50 Billion |
|
Revenue Forecast in 2030 |
USD 3.45 Billion |
|
Growth Rate |
CAGR of 10.3% from 2025 to 2030 |
|
Market Volume in 2024 |
19.69 Thousand Units |
|
Volume Forecast in 2030 |
53.72 Thousand Units |
|
Volume Growth Rate |
CAGR of 13.9% from 2025 to 2030 |
|
Analysis Period |
2024–2030 |
|
Base Year Considered |
2024 |
|
Forecast Period |
2025–2030 |
|
Market Size Estimation |
Billion (USD) |
|
Growth Factors |
|
|
Companies Profiled |
15 |
|
Market Share |
Available for 10 companies |
|
Customization Scope |
Free customization (equivalent up to 80 working hours of analysts) after purchase. Addition or alteration to country, regional, and segment scope. |
|
Pricing and Purchase Options |
Avail customized purchase options to meet your exact research needs. |
 Systems Market Revenue by 2030 (Billion USD)")
 Systems Market Segmentation")
 Systems Market Major Regions")
About the Author
 Sikha Haritwal is an assistant manager with strong expertise in market research, data analysis, and cross-functional coordination. She plays a key role in leading complex research initiatives, strengthening analytical rigor, and enabling data-driven decision-making across teams. Known for her leadership mindset and structured problem-solving approach, she supports process improvement, enhances operational efficiency, and contributes to building scalable frameworks that drive long-term strategic outcomes and organizational effectiveness.
About the Reviewer
 Supradip Baul is an accomplished business consultant and strategist with over a decade of rich experience in market intelligence, strategy, technology, and business transformation. His work has included rigorous qualitative and quantitative analysis across multiple industries, helping clients shape investment decisions and long-term roadmaps. Earlier in his career, he was associated with Gartner, where he contributed to industry-leading reports and market share analyses. He has worked with leading global companies and holds an MBA with a dual specialization in Marketing and Finance.
At Next Move Strategy Consulting, we understand that insightful market research is the cornerstone of successful business decisions. That's why we employ a robust and multifaceted approach, combining various methodologies to deliver the most accurate and actionable data for our clients.

Research Landscape
We navigate the world of research with two primary approaches:
Qualitative Approach
Our qualitative research methodologies involve immersive techniques such as in-depth interviews, focus groups, and observational studies. By engaging directly with individuals and stakeholders, we uncover valuable insights that quantitative data alone may overlook.

Quantitative Research
In tandem with qualitative methodologies, NMSC leverages the power of Quantitative Research to provide a robust foundation of numerical insights. Through systematic data collection and analysis, we quantify patterns, preferences, and market trends, offering a comprehensive view of the business landscape.
Our quantitative research approach employs diverse tools, including surveys, experiments, and statistical modelling. These methodologies enable us to gather data from a large and representative sample, ensuring the statistical significance of our findings. By employing structured questionnaires and standardized data collection methods, we guarantee the reliability and validity of the information we present to our clients.
Quantitative research is particularly effective in measuring the prevalence of trends, assessing market size, and gauging the impact of various factors on consumer behavior. The numerical precision attained through this approach equips our clients with actionable insights, facilitating data-driven decision-making and strategy formulation.


Our Specialized Toolbox for Industry-Specific Market Research
We deploy a specialized arsenal of techniques tailored to meet your unique requirements. Here's a glimpse into our comprehensive toolbox:

Information Procurement
The stage entails acquiring market data or relevant information through various sources and methodologies.


Market Research Approach
We utilize both top-down and bottom-up approaches in market research analysis to achieve a comprehensive understanding of the market dynamics, leveraging the broad perspective of industry trends and macroeconomic factors alongside detailed insights from specific segments and individual companies.

Porters Five Forces Analysis
We conduct Porter's Five Forces analysis to evaluate the competitive landscape of an industry, providing us with insights into factors that affect profitability and strategic positioning.

SWOT Analysis

Forecasting
We utilize a forecasting model to predict future consumption by considering parameters like population, economics, regulations, market competition, drivers, constraints, technology, and pricing. We also employ statistical techniques such as multilinear regression, exponential smoothing, moving average, ARIMA, and Monte Carlo simulations for accurate predictions. In econometric forecasting, we analyzed short-term and long-term event impacts, attributing values based on regulatory frameworks, economic factors, and market events.


 Speak to Our Analyst


 Systems Market")