Cooking Oil Market Global Industry Analysis and Forecast (2026-2035)

The global Cooking Oil Market is valued at USD 319.63 Billion in 2026 and is projected to reach USD 475.27 Billion by 2035, growing at a CAGR of 4.51% from 2026 to 2035. Key growth factors include the shift toward refined, branded, and traceability-verified oils, alongside expanding foodservice demand in emerging economies, with Asia-Pacific leading the market and Seed Oils accounting for approximately 42% share.

Download Free Sample PDF
Base Year (2025)
$302.34 Billion
Forecast (2035)
$475.27 Billion
CAGR (2026-2035)
4.5%
Top Region
Asia-Pacific

What Is the Cooking Oil Market Size?

The global cooking oil market size was valued at USD 302.34 billion in 2025 and is estimated at USD 319.63 billion in 2026. Revenue is forecast to reach USD 475.27 billion by 2035, expanding at a 4.51% CAGR between 2026 and 2035. Asia-Pacific leads with approximately 46% share. Seed Oils dominate all other product types with approximately 42% share.

We observed that growth is value-led rather than volume-led. Per capita consumption is relatively mature across many developed markets, increasing the importance of product mix, pricing, and channel expansion.

Cooking Oil Market Global Industry Analysis and Forecast (2026-2035) Revenue Forecast

Values in USD Billion

2025 $302.34 Billion
2025
2026 $315.98 Billion
2026
2027 $330.23 Billion
2027
2028 $345.12 Billion
2028
2029 $360.68 Billion
2029
2030 $376.95 Billion
2030
2031 $393.95 Billion
2031
2032 $411.72 Billion
2032
2033 $430.29 Billion
2033
2034 $449.69 Billion
2034
2035 $475.27 Billion
2035

Key Takeaways

By Product Type: Seed Oils held the largest share of approximately 42% (USD 127.00 billion) in 2025, rising to USD 190.11 billion by 2035; Nut Oils are the fastest-growing sub-segment at 7.10% CAGR from 2026–2035.

By Processing Type: Refined held the largest share of approximately 78% (USD 235.83 billion) in 2025; Unrefined is the fastest-growing sub-segment at 6.48% CAGR from 2026–2035.

By Package Type: Bottle held the largest share of approximately 42% (USD 126.98 billion) in 2025; Pouch is the fastest-growing sub-segment at 6.12% CAGR from 2026–2035.

By Distribution Channel: Retail held the largest share of approximately 49% (USD 148.15 billion) in 2025, rising to USD 223.38 billion by 2035; Industrial B2B is the fastest-growing sub-segment at 5.05% CAGR from 2026–2035.

By Buyer Type: Household Consumer held the largest share of approximately 48% (USD 145.12 billion) in 2025; Food Manufacturer is the fastest-growing sub-segment at 5.11% CAGR from 2026–2035.

By End Use: Residential Cooking held the largest share of approximately 48% (USD 145.12 billion) in 2025, rising to USD 218.62 billion by 2035; Food Processing is the fastest-growing sub-segment at 5.07% CAGR from 2026–2035.

Dominant Region: Asia-Pacific dominated with approximately 46% revenue share (USD 138.98 billion) in 2025.

Fastest-Growing Region: Middle East & Africa is expected to register the highest CAGR of 5.83% during 2026–2035.

Dominant Country: China led with approximately USD 45.35 billion in 2025.

Fastest-Growing Country: UAE is the fastest-growing country at approximately 6.67% CAGR from 2026–2035.

Market Opportunity: The cooking oil market is expected to create an absolute dollar opportunity of USD 155.64 billion between 2026 and 2035, concentrated in refining capacity, traceable sourcing, and foodservice-grade frying formats rather than in commodity volume growth.

According to NMSC analysis, margin is migrating downstream. Crush and origination remain scale businesses with thin spreads. The profit pool is shifting toward refiners and formulators who can document origin, guarantee fry-life performance, and hold specification consistency across multi-plant customer networks.

What Does the Cooking Oil Market Encompass?

The cooking oil market covers edible vegetable oils sold for culinary heat application and food formulation. Scope spans seed, grain and bran, fruit, nut, palm, and blended oils. It includes both refined and unrefined grades. Buyers range from households purchasing bottled oil to food manufacturers contracting bulk tank deliveries. The market excludes non-edible oleochemical feedstock and animal fats, which follow separate pricing and regulatory logic.
Two regulatory forces now shape sourcing decisions. The European Union Deforestation Regulation (EUDR) will require operators of covered palm and soy products to provide geolocation information demonstrating compliance with its deforestation-free requirements once the regulation becomes applicable. Separately, producing-country export levies and licensing rules alter availability and landed cost with little notice. We found that these rules have made documentation capability a commercial asset, not only a compliance cost.
Processing technology is also changing the cost base. Physical and enzymatic refining approaches can reduce processing losses and, depending on feedstock and configuration, reduce certain chemical requirements compared with conventional alkaline refining. NMSC's analysis indicates that refiners who adopt these routes gain a durable yield advantage. That advantage matters most in the Industrial B2B channel, where customers audit specification consistency rather than brand.

Market Drivers & Dynamics

Interactive Dataset
Foodservice and quick-service restaurant expansion raising frying oil throughput driver +1.2% Asia-Pacific, Middle East & Africa 2026-2035
Packaged and processed food manufacturing growth lifting bulk oil contracts driver +1.0% Global 2026-2035
Biofuel feedstock demand supporting vegetable oil price floors driver +0.8% North America, Europe 2026-2032
Retail shift from loose oil to branded packaged formats in emerging markets driver +0.7% Asia-Pacific, Latin America 2026-2035
Traceability-verified sourcing commanding contract premiums driver +0.5% Europe, North America 2026-2035
Specialty and high-oleic formulations displacing standard frying oils driver +0.4% North America, Europe 2026-2035
Feedstock price volatility from weather and crop yield variability restraint -1.1% Global 2026-2035
Export levies and licensing changes in producing countries restraint -0.7% Asia-Pacific, Latin America 2026-2032
Compliance cost of deforestation documentation for smallholder supply restraint -0.4% Asia-Pacific, Europe 2026-2032
Source: Next Move Strategy Consulting

Growth Drivers

What Is the Primary Growth Driver of the Cooking Oil Market?

Foodservice expansion is the primary growth driver. Foodservice operators typically use cooking oil more intensively than households because commercial frying requires regular oil replenishment and replacement. As quick-service chains expand across Asia-Pacific and the Gulf, per-outlet oil draw scales with cover counts. This mechanism explains why the Foodservice channel grows at 4.89% against Retail at 4.02%. Chain buyers also purchase on contract, which shifts demand from spot retail pricing toward negotiated industrial terms.

How Is Food Processing Demand Driving Cooking Oil Market Growth?

Packaged food manufacturing converts cooking oil from a household purchase into an industrial input. Snack frying, bakery shortening, and sauce emulsification each require specified oils with defined oxidative stability. Specialty formulation investments across the industry are increasingly targeting frying, bakery, and prepared-food applications. We found that this channel rewards technical service over price. Food Processing accordingly grows at 5.07% to reach USD 99.81 billion by 2035, the fastest of the three end uses.

Growth Inhibitors

What Is Restraining Cooking Oil Market Expansion?

Feedstock price volatility is the principal restraint. Vegetable oil prices respond to palm yield cycles, South American soybean weather, and Black Sea sunflower supply. Because oil is a high-share input cost for processors, sharp moves compress downstream margins faster than contracts can reprice. Biofuel demand adds a second claim on the same feedstock, tightening the balance. We observed that this volatility discourages fixed-price multi-year supply agreements, keeping procurement short and reactive.

What Are the Growth Opportunities?

How Can Traceability Infrastructure Unlock Contract Premiums?

Deforestation regulations are creating greater differentiation between suppliers with established traceability systems and those still developing compliance capabilities. Suppliers holding plot-level geolocation data will be better prepared to serve European buyers as EUDR requirements become applicable. Producers that invest in mill-level traceability can strengthen market access and improve supplier qualification prospects.

Where Does Pouch Packaging Create Value in Emerging Retail?

Loose oil dispensed from open containers still serves many low-income markets. Pouch formats convert that volume into branded, quality-assured purchase at a lower price point than rigid bottles. Pouch grows at 6.12% against Bottle's slower trajectory. The beneficiary is the Household Consumer buyer type across Asia-Pacific and Latin America, where affordability governs pack-size choice.

How Can High-Stability Frying Oils Benefit Foodservice Suppliers?

Fryer oil is replenished and replaced based on usage and oil-quality conditions, so extending usable fry-life can reduce operator costs. Oils formulated for oxidative stability let chains lengthen change intervals and reduce waste disposal volumes. Suppliers can price against demonstrated savings rather than commodity benchmarks. The beneficiary is the Foodservice Operator buyer type, particularly multi-site chains that measure cost per cover.

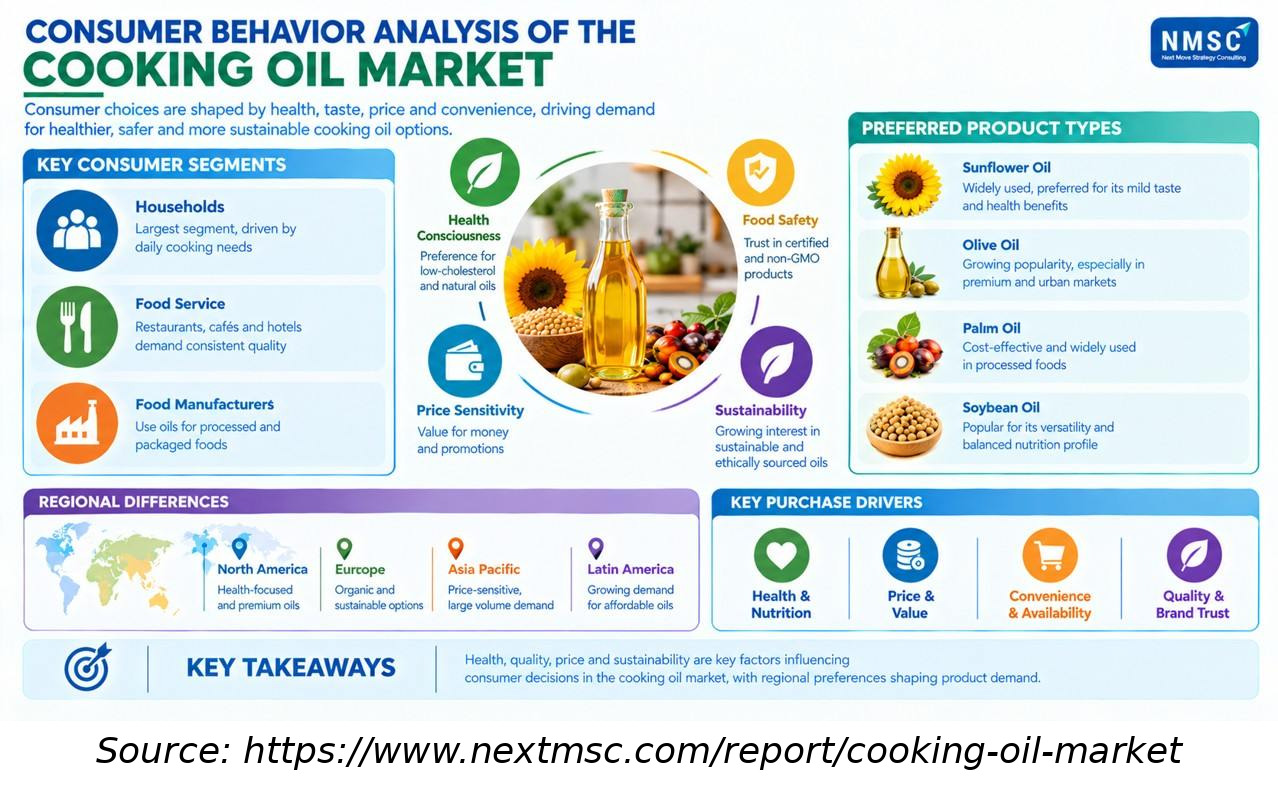
Consumer Behavior Analysis of the Cooking Oil Market

Consumer Behavior Analysis of the Cooking Oil Market

The Consumer Behavior Analysis of the Cooking Oil Market highlights how purchasing decisions are influenced by health and nutrition, price sensitivity, product quality, convenience, and sustainability. Households remain a key consumer segment, while food-service and food-manufacturing users prioritize consistency and reliability. Regional preferences further shape demand, with growing interest in premium, healthier, affordable, and responsibly sourced cooking oils.

Segmentation Analysis

2025 (USD Billion)
2035 (USD Billion)
Seed Oils 2025: $127.00 Billion | 2035: $190.11 Billion
Seed Oils
Palm Oils 2025: $90.70 Billion | 2035: $133.08 Billion
Palm Oils
Fruit Oils 2025: $33.26 Billion | 2035: $61.79 Billion
Fruit Oils
Grain and Bran Oils 2025: $24.19 Billion | 2035: $42.77 Billion
Grain and Br
Blended Oils 2025: $21.14 Billion | 2035: $35.65 Billion
Blended Oils
Nut Oils 2025: $6.05 Billion | 2035: $11.87 Billion
Nut Oils
Seed Oils $127.00 Billion $190.11 Billion 3.94%
Palm Oils $90.70 Billion $133.08 Billion 3.71%
Fruit Oils $33.26 Billion $61.79 Billion 6.46%
Grain and Bran Oils $24.19 Billion $42.77 Billion 5.88%
Blended Oils $21.14 Billion $35.65 Billion 5.32%
Nut Oils $6.05 Billion $11.87 Billion 7.10%

Which Product Type Dominates the Cooking Oil Market?

Seed Oils led at USD 127.00 billion in 2025. Soybean, sunflower, and rapeseed crush runs at industrial scale across the Americas, Europe, and the Black Sea, which keeps unit cost low and supply broadly available. That cost position secures both retail bottling and bulk manufacturing contracts. Nut Oils grow fastest at a 7.10% CAGR, but from USD 6.05 billion. Their growth reflects premium culinary positioning and constrained orchard supply, not volume displacement of seed oils.

2025 (USD Billion)
2035 (USD Billion)
Refined
Unrefined
Segment Item 2025 (USD Billion) 2035 (USD Billion) CAGR
Refined $10.0 USD Billion $40.0 USD Billion 9.0%
Unrefined $17.1 USD Billion $51.1 USD Billion 15.0%

Segment-wise data is locked

Unlock complete segment-wise numbers for By Processing Type.

Unlock Full Data
2025 (USD Billion)
2035 (USD Billion)
Bottle
Pouch
Tin
Jerrycan
Drum
Segment Item 2025 (USD Billion) 2035 (USD Billion) CAGR
Bottle $10.0 USD Billion $40.0 USD Billion 22.0%
Pouch $17.1 USD Billion $51.1 USD Billion 16.0%
Tin $24.2 USD Billion $62.2 USD Billion 22.0%
Jerrycan $31.3 USD Billion $73.3 USD Billion 20.0%
Drum $38.4 USD Billion $84.4 USD Billion 15.0%

Segment-wise data is locked

Unlock complete segment-wise numbers for By Package Type.

Unlock Full Data
2025 (USD Billion)
2035 (USD Billion)
Retail
Foodservice
Industrial B
Segment Item 2025 (USD Billion) 2035 (USD Billion) CAGR
Retail $10.0 USD Billion $40.0 USD Billion 25.0%
Foodservice $17.1 USD Billion $51.1 USD Billion 19.0%
Industrial B2B $24.2 USD Billion $62.2 USD Billion 25.0%

Segment-wise data is locked

Unlock complete segment-wise numbers for By Distribution Channel.

Unlock Full Data

Which Distribution Channel Leads Cooking Oil Market Demand?

Retail remained the largest channel at USD 148.15 billion in 2025, supported by its broad reach across household consumers worldwide. Growth is slower at 4.02% because household consumption per person has plateaued in mature markets. Industrial B2B advances fastest at 5.05%. Manufacturers buy in tank and drum formats on specification, so volumes track packaged food output rather than household budgets. That linkage makes the channel less price-elastic and more contract-driven.

2025 (USD Billion)
2035 (USD Billion)
Household Co
Foodservice
Food Manufac
Distributor
Segment Item 2025 (USD Billion) 2035 (USD Billion) CAGR
Household Consumer $10.0 USD Billion $40.0 USD Billion 22.0%
Foodservice Operator $17.1 USD Billion $51.1 USD Billion 12.0%
Food Manufacturer $24.2 USD Billion $62.2 USD Billion 14.0%
Distributor $31.3 USD Billion $73.3 USD Billion 12.0%

Segment-wise data is locked

Unlock complete segment-wise numbers for By Buyer Type.

Unlock Full Data
2025 (USD Billion)
2035 (USD Billion)
Residential
Foodservice
Food Process
Segment Item 2025 (USD Billion) 2035 (USD Billion) CAGR
Residential Cooking $10.0 USD Billion $40.0 USD Billion 15.0%
Foodservice Preparation $17.1 USD Billion $51.1 USD Billion 13.0%
Food Processing $24.2 USD Billion $62.2 USD Billion 23.0%

Segment-wise data is locked

Unlock complete segment-wise numbers for By End Use.

Unlock Full Data

Which End Use Is the Fastest-Growing in the Cooking Oil Market?

Residential Cooking held the largest position at USD 145.12 billion in 2025, reflecting the breadth of household use across every covered geography. Based on research conducted by NMSC, we found Food Processing grows fastest at a 5.07% CAGR. The mechanism is substitution of home preparation with packaged and prepared foods. When a household buys fried snacks instead of frying at home, oil demand does not disappear. It relocates to the manufacturer, where purchase scale and specification requirements are both higher.

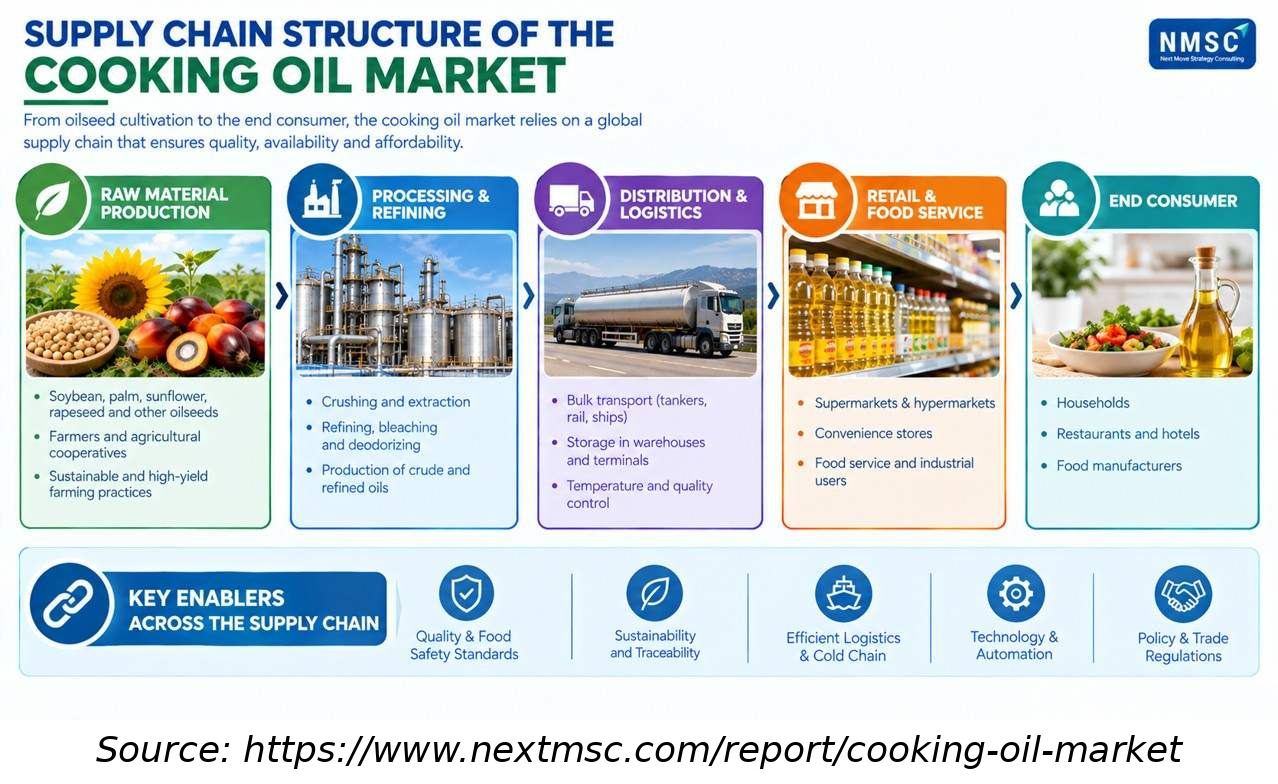
Supply Chain Structure of the Cooking Oil Market

The cooking oil supply chain spans oilseed cultivation, processing and refining, logistics, retail, food service, and end consumers. Market performance depends on reliable agricultural inputs, efficient refining, quality control, storage, transportation, and distribution. Sustainability, traceability, food safety standards, technology adoption, and trade policies increasingly influence supply continuity, cost efficiency, and product availability across regions.

Growth Opportunities

Our analysis shows that three forward-looking opportunities stand out for stakeholders positioning within the cooking oil market over the 2026–2035 forecast period.

How Can Traceability Infrastructure Unlock Contract Premiums?

Deforestation regulations are creating greater differentiation between suppliers with established traceability systems and those still developing compliance capabilities. Suppliers holding plot-level geolocation data will be better prepared to serve European buyers as EUDR requirements become applicable. Producers that invest in mill-level traceability can strengthen market access and improve supplier qualification prospects.

Where Does Pouch Packaging Create Value in Emerging Retail?

Loose oil dispensed from open containers still serves many low-income markets. Pouch formats convert that volume into branded, quality-assured purchase at a lower price point than rigid bottles. Pouch grows at 6.12% against Bottle's slower trajectory. The beneficiary is the Household Consumer buyer type across Asia-Pacific and Latin America, where affordability governs pack-size choice.

How Can High-Stability Frying Oils Benefit Foodservice Suppliers?

Fryer oil is replenished and replaced based on usage and oil-quality conditions, so extending usable fry-life can reduce operator costs. Oils formulated for oxidative stability let chains lengthen change intervals and reduce waste disposal volumes. Suppliers can price against demonstrated savings rather than commodity benchmarks. The beneficiary is the Foodservice Operator buyer type, particularly multi-site chains that measure cost per cover.

Ecosystem Analysis

Regional Outlook

2025 (USD Billion)
2035 (USD Billion)
Asia-Pacific
Europe
North Americ
Latin Americ
Middle East
Region 2025 (USD Billion) 2035 (USD Billion) CAGR (%)
Asia-Pacific $10.0 USD Billion $40.0 USD Billion 9.0%
Europe $17.1 USD Billion $51.1 USD Billion 27.0%
North America $24.2 USD Billion $62.2 USD Billion 25.0%
Latin America $31.3 USD Billion $73.3 USD Billion 23.0%
Middle East & Africa $38.4 USD Billion $84.4 USD Billion 12.0%

Regional data is locked

Unlock complete regional numbers for this market.

Unlock Full Data

Competitive Landscape

Our analysis shows the cooking oil industry is concentrated upstream and fragmented downstream, with origination scale determining who can compete for large manufacturing contracts.

Dimension Description
Dimension Assessment
Market Structure Concentrated at crush and origination, where a small group of integrated traders has significant influence over cross-border flows. Fragmented at retail, where regional brands and private label hold substantial shelf share.
Innovation Focus Specialty and high-stability fats, enzymatic and physical refining routes that cut processing losses, and traceability systems that produce plot-level origin evidence for regulated markets.
M&A Activity Portfolio reshaping rather than broad consolidation. Processors are divesting selected branded consumer businesses while continuing to invest in integrated oilseed processing and origination capabilities.

How Do Companies Compete in the Cooking Oil Market?

Competition varies by channel: feedstock access and integration are particularly important in bulk markets, while brand strength and distribution remain important in retail. Oil is largely a specification product, so buyers switch suppliers on price and documentation reliability. Companies with owned crush plants near growing regions secure supply when markets tighten. We observed that this favors Wilmar, Cargill, ADM, and Bunge, each of which controls origination, crush, refining, and logistics. Downstream-only refiners face margin compression whenever feedstock markets move against them.

Which Competitive Archetypes Dominate the Cooking Oil Industry?

Three archetypes are visible. Integrated global traders such as Wilmar, Cargill, ADM, Bunge, and Louis Dreyfus differentiate on origination reach and risk management capability. Palm-origin plantation processors including Apical, Musim Mas, Golden Agri-Resources, and SD Guthrie differentiate on estate traceability, which increasingly influences European market access and compliance readiness. Regional branded refiners such as Patanjali Foods, Deoleo, SALOV, and Acesur differentiate on consumer distribution and category authority within defined geographies.

How Are Companies Differentiating Through Innovation?

Innovation is concentrating on formulation service rather than the oil itself. Leading refiners are increasingly pairing specialty formulations with technical support for chocolate, bakery, and frying applications. That model sells performance outcomes such as fryer life and texture retention. Our findings suggest it shifts the buying conversation away from per-tonne price. Suppliers offering formulation assistance and documented specification consistency retain contracts that pure commodity sellers lose on price.

What M&A and Geographic Expansion Activity Is Shaping the Market?

Transaction activity reflects portfolio focus rather than scale consolidation, with greater emphasis on integrated oilseed value chains and business-to-business ingredients alongside selective divestment of branded consumer businesses. Geographic expansion follows feedstock and demand growth simultaneously, with capacity additions clustering in Southeast Asia for palm processing and in the Americas for oilseed crush.

Key Market Players

Our assessment identifies the following 20 companies as key participants shaping the cooking oil market through 2026.

Wilmar International Limited Cargill, Incorporated Archer-Daniels-Midland Company Bunge Global SA Apical Group Limited Musim Mas Holdings Pte Ltd COFCO Corporation Golden Agri-Resources Ltd Mewah International Inc. Olam Agri Holdings Pte. Ltd. Louis Dreyfus Company B.V. The Nisshin OilliO Group, Ltd. Fuji Oil Holdings Inc. SD Guthrie Berhad Richardson International Limited CHS Inc. Patanjali Foods Limited Deoleo Global, S.A.U. SALOV S.p.A. Acesur

Latest Developments

We observed the following verified developments shaping competitive positioning across the cooking oil market.

Date Event
July 2026 ADM announced investments at four U.S. oilseed-processing facilities to unlock approximately 700,000 metric tons of annual additional crush capacity. The company said the expansion will strengthen its ability to meet growing demand for renewable fuels and other vegetable-oil markets while increasing demand for domestic oilseed crops.
March 2026 Cargill expanded its edible-oil plant in Port Klang, Malaysia, with a new specialty-fats production line. The multi-million-dollar investment adds cocoa butter equivalents, low-trans-fat cocoa butter replacers and specialty fats for frying, baking and fillings, broadening the plant’s edible-oil processing capabilities.
May 2025 Louis Dreyfus Company inaugurated a new edible-oil packaging line at its Lampung integrated palm-oil complex in May 2025. The facility sits alongside LDC’s palm refinery and adds packaging capability for edible oils targeting both domestic Indonesian consumption and export markets, strengthening downstream integration.
June 2025 Salov introduced Filippo Berio Extra Virgin Olive Oil “For Delicate Recipes”, targeting consumers who prefer a milder sensory profile than traditionally more bitter and peppery extra-virgin olive oils. The product is SGS-certified under the company’s Berio Method and positioned for refined culinary applications.

Investment Opportunities

How Are Capital Inflows Shaping the Cooking Oil Market?

Capital is increasingly moving toward specialty processing, formulation capability, and feedstock-linked assets. Bunge is building oilseed processing capacity at Destrehan with Chevron. Recent portfolio adjustments among major traders underscore a broader capital shift toward core oilseed processing assets. We observed a consistent thesis behind these commitments: assets closer to feedstock and to technical formulation hold pricing power, whereas consumer brand positions are being sold to specialist food companies.

What Infrastructure Investment Is Required to Scale Cooking Oil Market Coverage?

Scaling coverage requires crush capacity near growing regions, port-adjacent refining in import-dependent markets, and bulk logistics including tank storage and specialized shipping. Traceability systems are now part of that infrastructure. Our findings suggest that importing regions such as Middle East & Africa offer the clearest gap, since refining and blending margin currently accrues offshore rather than at the point of consumption.

What ESG Considerations Are Relevant to Cooking Oil Market Investment?

Deforestation exposure is the central environmental issue, particularly for palm and soy sourced from tropical frontiers. EUDR compliance requirements and buyer preferences for certified sustainable palm oil are increasingly influencing supplier selection in Europe. These requirements are encouraging producers and processors to strengthen traceability, origin documentation, and supply chain transparency.

Key Benefits for Stakeholders

How Does This Report Benefit Food Industry Leaders?

Food industry leaders gain segment-level sizing across product type, channel, and end use, which supports sourcing and capacity decisions. The regional analysis identifies where import dependence creates refining margin opportunity. Our analysis shows which channels reward technical service over price, informing whether to compete on specification capability or cost position. Regulatory coverage helps anticipate documentation requirements before they become access barriers.

How Does This Report Benefit Investors and Financial Analysts?

Investors gain forecasts disaggregated by segment and geography, alongside an assessment of where margin is migrating within the value chain. We found the competitive archetype framework useful for evaluating whether a given company competes on origination scale, estate traceability, or consumer distribution. Country-level projections through 2035 support allocation decisions across mature and high-growth markets.

How Does This Report Benefit Processors and Product Teams?

Processors and product teams gain visibility into which formats and formulations are gaining share. The package type and buyer type analysis indicates where pouch and bulk formats are displacing incumbents. Our assessment indicates that high-stability frying formulations and specialty fats offer the clearest differentiation path, since both are priced against demonstrated performance rather than commodity benchmarks.

Key Market Segments Evaluated

By Product Type

  • Seed Oils 
    • Soybean Oil
    • Sunflower Oil
    • Canola and Rapeseed Oil
    • Cottonseed Oil
    • Mustard Oil
    • Sesame Oil
    • Peanut Oil
    • Other Seed Oils
  • Grain and Bran Oils 
    • Corn Oil
    • Rice Bran Oil
    • Other Grain and Bran Oils
  • Fruit Oils 
    • Olive Oil
    • Coconut Oil
    • Avocado Oil
    • Other Fruit Oils
  • Nut Oils 
    • Almond Oil
    • Walnut Oil
    • Other Nut Oils
  • Palm Oils
  • Blended Oils

By Processing Type

  • Refined
  • Unrefined

By Package Type

  • Bottle
  • Pouch
  • Tin
  • Jerrycan
  • Drum
  • Tank Container
  • Other Package Types

By Distribution Channel

  • Retail
  • Foodservice
  • Industrial B2B

By Buyer Type

  • Household Consumer
  • Foodservice Operator
  • Food Manufacturer
  • Distributor

By End Use

  • Residential Cooking
  • Foodservice Preparation
  • Food Processing

By Region

  • North America 
    • U.S.
    • Canada
    • Mexico.
  • Europe 
    • UK
    • Germany
    • France
    • Italy
    • Spain
    • Sweden
    • Denmark
    • Finland
    • Netherlands
    • Rest of Europe.
  • Asia-Pacific 
    • China
    • India
    • Japan
    • South Korea
    • Taiwan
    • Indonesia
    • Vietnam
    • Australia
    • Philippines
    • Malaysia
    • Rest of APAC.
  • Middle East & Africa 
    • Saudi Arabia
    • UAE
    • Egypt
    • Israel
    • Turkey
    • Nigeria
    • South Africa
    • Rest of MEA.
  • Latin America 
    • Brazil
    • Argentina
    • Chile
    • Colombia
    • Rest of LATAM.

Conclusion & Recommendations

The outlook is one of steady value growth without volume acceleration. Revenue rises from USD 319.63 billion in 2026 to USD 475.27 billion by 2035, a 4.51% CAGR. Our analysis shows the gain comes from mix and channel shift rather than rising per capita consumption. Food processing and foodservice absorb a growing share of total oil, moving demand from household purchase toward contracted industrial supply.

What Strategic Positioning Recommendations Apply to Processors?

Processors should secure feedstock access and build documentation capability in parallel. Origination assets protect supply during tight markets. Traceability systems protect market access in regulated destinations. We observed that neither alone is sufficient under current conditions. Companies should also assess whether branded consumer positions still fit their portfolio, given the sector's visible move toward business-to-business focus.

How Attractive Is the Cooking Oil Market for New Investment?

Attractiveness varies sharply by position in the chain. Commodity crush offers scale but thin, cyclical spreads. The USD 155.64 billion absolute opportunity between 2026 and 2035 concentrates in refining, specialty formulation, and import-market processing. We found the strongest risk-adjusted case in port-adjacent refining within Middle East & Africa, where 5.83% growth meets limited domestic processing capacity.

What Market Shifts and Key Risks Should Stakeholders Monitor?

Three shifts warrant monitoring. Biofuel policy changes can redirect large oil volumes between food and fuel with little warning. Export levy adjustments in producing countries alter landed costs quickly. Deforestation compliance deadlines determine which suppliers retain European access. Our assessment indicates that feedstock volatility remains the dominant risk, subtracting an estimated 1.1 percentage points from the forecast CAGR.

What Are the Key Growth Pathways for the Cooking Oil Market?

Three pathways offer the clearest returns. Traceability infrastructure converts compliance spending into preferential contract access. Pouch and value-pack formats formalize loose oil volume in emerging retail. High-stability frying oils let suppliers price against operator cost savings. NMSC's analysis indicates that companies combining these with secure feedstock positions are best placed to capture growth through 2035.

FAQs

About the Author

Mihul Sharma

Mihul Sharma

Mihul Sharma is Research Associate at Next Move Strategy Consulting, where he has covered technology, industrial, and healthcare markets for 3 years. His work applies structured business research, market analysis, and secondary-source review to assess market trends, competitive developments, and growth opportunities. He supports report development by fully synthesizing industry data, company information, and market signals into concise findings for strategy and investment-focused research teams.

About the Reviewer

Supradip Baul

Supradip Baul

Supradip Baul is an accomplished business consultant and strategist with over a decade of rich experience in market intelligence, strategy, technology, and business transformation. His work has included rigorous qualitative and quantitative analysis across multiple industries, helping clients shape investment decisions and long-term roadmaps. Earlier in his career, he was associated with Gartner, where he contributed to industry-leading reports and market share analyses. He has worked with leading global companies and holds an MBA with a dual specialization in Marketing and Finance.

Download Free Sample

Pratyush Kumar Das

PRATYUSH KUMAR DAS

Assistant Manager

Polycab India Limited

We would like to express our appreciation for the data and insights provided by nextmsc. We are very pleased with the quality and depth of the information, which has proven to be highly valuable and beneficial for our business decision-making.

Nishant Awate

NISHANT AWATE

Business Development Global Sales

Zehnder Group Deutschland GmbH

Our experience working with Next Move Strategy Consulting was positive. The team was responsive, professional, and open to incorporating our specific requirements throughout the project. The India AHU market study was comprehensive and well structured, covering market value and volume forecasts, product and application segments, and key industry trends. The inclusion of both AHU and residential MVHR market insights made the study particularly relevant for our strategic market assessment. Overall, the report provides a solid foundation for evaluating market potential, identifying priority segments, and supporting business-development decisions in India.

Robert Sean Trevino

ROBERT SEAN TREVINO

Sr. Director, Head of Strategic Insights & Analytics

Foundation Medicine

I realized that it was a reliable source of information. These days, there are many people who are looking for authentic data, and this is one of the only sources that can offer them with what they need;

Henri Knyphausen

HENRI KNYPHAUSEN

Partner at Singulier [Ex-BCG]

Singulier

I recently engaged NEXTMSC.com for a commercial due diligence project within the intralogistics sector, and I am pleased to provide a reference based on my experience. In utilizing NEXTMSC.com's services, I found their report to offer valuable insights into market dynamics and key industry players. The initial report provided a solid foundation for our analysis. However, as we were investigating a smaller target in the market, and I had specific customization requests requiring additional research. These requests included detailed information on product portfolios of various players and sub-market sizes, both inclusive and exclusive of certain product categories. NEXTMSC.com demonstrated commendable responsiveness and agility in accommodating these customization requests. Within a timeframe of 1-2 weeks, they delivered a revised report that met our specific needs. Furthermore, they were receptive to my follow-up inquiries, ensuring clarity and understanding of the data provided. The final deliverable significantly contributed to our due diligence efforts. One of NEXTMSC.com's notable strengths lies in their qualitative research capabilities. However, for future engagements, I would recommend the inclusion of a quantified market model in Excel format. Such a model would offer the ability to conduct in-depth analyses and explore various market segments, including country-specific data and subcomponent breakdowns. Based on my positive experience, I would not hesitate to work with NEXTMSC.com again. Their responsiveness, willingness to accommodate customization requests, and commitment to delivering actionable insights make them a reliable partner for commercial research projects.

Ross J Mckenzie

ROSS J MCKENZIE

Business Insight Manager

Staysure Group

“Next MSC have been incredibly helpful in providing detailed & robust information on our market, alongside quantifying growth by different segments. The process to procure was simple and easy, with sample reports and regular contact to ensure we had what we needed. Succinct detail on their sources & methodologies is also greatly received, allowing transparency in this respect helps build trust in the detail you pay for. Joseph in particular was fantastic, and helped ensure efficient provision of the insight pack – thank you NMSC!”.

Custom Market Research Services

We will customize the research for you if the listed report does not fully match your requirements.

Get 30% Free Customization

Select License

This website uses cookies to ensure you get the best experience on our website. Learn more

✖