Embedded Insurance Market Global Industry Analysis and Forecast (2026–2035)

Embedded Insurance Market size was USD 129.66 Billion in 2025, projected to reach USD 446.01 Billion by 2035, growing at a CAGR of 12.7% from 2026 to 2035. Key drivers include API led partner integration, manufacturer and platform embedded programs, and conversational commerce channels, with North America leading the global market.

Download Free Sample PDF
Base Year (2025)
$129.66 Billion
Forecast (2035)
$446.01 Billion
CAGR (2026-2035)
12.7%
Top Region
North America

What Is the Embedded Insurance Market Size?

The global Embedded Insurance Market reached USD 129.66 Billion in 2025 and is estimated at USD 152.48 Billion in 2026. It is forecast to reach USD 446.01 Billion by 2035 at a CAGR of 12.7% from 2026 to 2035. North America leads with approximately 38% share in 2025, while Motor and Mobility is the dominant insurance line at approximately 24%.

NMSC's analysis indicates that growth is shifting from insurer led programs toward platform led integrations, because partners with large transaction volumes want to add protection without building insurance operations.

Embedded Insurance Market Global Industry Analysis and Forecast (2026–2035) Revenue Forecast
Values in USD Billion

2025 $129.66 Billion
2025
2026 $152.48 Billion
2026
2027 $171.84 Billion
2027
2028 $193.67 Billion
2028
2029 $218.27 Billion
2029
2030 $245.98 Billion
2030
2031 $277.23 Billion
2031
2032 $312.43 Billion
2032
2033 $352.11 Billion
2033
2034 $396.83 Billion
2034
2035 $446.01 Billion
2035

Key Takeaways

By Insurance Line: Motor and Mobility held the largest share, expanding from USD 31.11 Billion in 2025 to USD 115.97 Billion by 2035; Commercial and Specialty is the fastest-growing at 23.5% CAGR from 2026–2035.

By Embedding Point: E-commerce and Retail held the largest share, expanding from USD 28.53 Billion in 2025 to USD 89.20 Billion by 2035; Mobility and Gig Platforms is the fastest-growing at 17.9% CAGR from 2026–2035.

By Purchase Mode: Checkout add-on held the largest share, expanding from USD 49.26 Billion in 2025 to USD 133.81 Billion by 2035; On-demand cover is the fastest-growing at 17.2% CAGR from 2026–2035.

By Integration Method: API based held the largest share, expanding from USD 58.35 Billion in 2025 to USD 258.69 Billion by 2035; API based is the fastest-growing at 15.5% CAGR from 2026–2035.

By Platform Model: Carrier direct held the largest share, expanding from USD 62.24 Billion in 2025 to USD 182.86 Billion by 2035; Insurtech and MGA platform is the fastest-growing at 15.0% CAGR from 2026–2035.

By Customer Type: Individual consumers held the largest share, expanding from USD 106.32 Billion in 2025 to USD 338.97 Billion by 2035; Large enterprises is the fastest-growing at 16.4% CAGR from 2026–2035.

By Policy Term: Single transaction cover held the largest share, expanding from USD 62.23 Billion in 2025 to USD 178.40 Billion by 2035; Multi year cover is the fastest-growing at 17.2% CAGR from 2026–2035.

Dominant Region: North America dominated with approximately 38% revenue share in 2025 at USD 49.27 Billion, anchored by large device protection, automotive and retail partner programs.

Fastest-Growing Region: Middle East & Africa is expected to register the highest CAGR of 16.2% during 2026–2035, rising from USD 5.19 Billion in 2025.

Dominant Country: The U.S. led the market with an estimated USD 43.36 Billion in 2025, supported by the largest base of partner programs.

Fastest-Growing Country: India is among the fastest-growing major countries, projected to expand from USD 2.41 Billion in 2025 at a CAGR of 21.7% during 2026–2035.

Investors face an absolute investment opportunity of approximately USD 293.53 Billion between 2026 and 2035, calculated as the difference between the 2035 forecast of USD 446.01 Billion and the 2026 base of USD 152.48 Billion, which makes API based platforms and partner programs in motor, health and specialty lines the most capital efficient entry points.

According to NMSC analysis, the fastest value pool sits in partner owned checkout flows where cover is bundled into the price, because Included in price cover grows at 15.0% against 10.0% for the traditional checkout add-on.

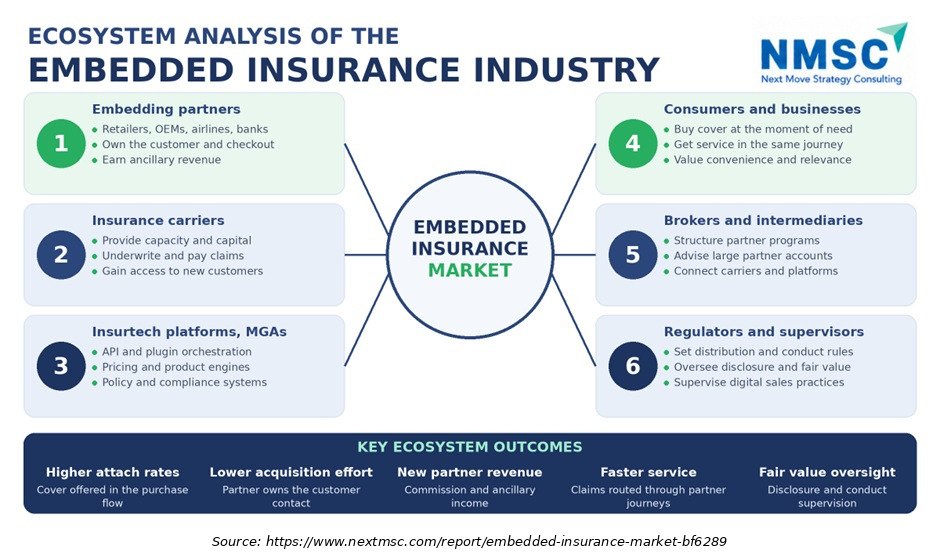
Ecosystem Analysis of the Embedded Insurance Industry

The above infographic maps six participant groups around the market: embedding partners, insurance carriers, insurtech platforms and managing general agents, brokers, customers, and supervisors. Its strategic significance is that value is created at the partner checkout but depends on carrier capacity, platform integration and supervisory acceptance, so participants that secure two of these three links gain bargaining power over the remaining participants.

What does the Embedded Insurance Market Encompass?

The Embedded Insurance Market covers insurance sold at the point of sale inside the digital or physical journey of a partner outside the insurance industry, measured as gross written premium paid by end customers. It includes personal and commercial lines delivered through API, plugin, widget and co-branded portal integrations. It excludes insurer websites, aggregator referrals, branch bancassurance, reinsurance and platform technology fees. NMSC classifies the market as growth stage, supported by sustained partnership launches through 2026.

Regulation shapes how the sector scales. EIOPA reported in March 2026 that the Insurance Distribution Directive does not comprehensively regulate digital channels, which leaves embedded sellers reliant on national interpretations of disclosure, product oversight and conduct rules. Technology adoption centers on API orchestration, automated underwriting and conversational interfaces that let partners present priced cover inside the transaction without redirecting the customer.

Market Drivers & Dynamics

Interactive Dataset
API led partner integration lowering customer acquisition friction driver +3.1% Global 2026–2035
Expansion of e-commerce, travel and mobility transactions that carry cover driver +2.3% North America, Asia-Pacific 2026–2035
Carrier and bank partnerships with specialist embedded platforms driver +1.9% Europe, Asia-Pacific 2026–2033
Electric vehicle and connected car programs embedding motor cover driver +1.5% Europe, Asia-Pacific 2026–2032
Agentic and conversational commerce channels offering cover in chat driver +0.9% North America, Asia-Pacific 2027–2035
Regulatory gaps on digital distribution and inconsistent national rules restraint −1.4% Europe, Global 2026–2032
Conduct, inducement and fair value scrutiny of partner commissions restraint −1.0% Europe, Asia-Pacific 2026–2031
Soft non life pricing limiting premium growth restraint −0.7% Global 2026–2028
Claims friction and low consumer trust in add-on cover restraint −0.5% Global 2026–2030
Source: Next Move Strategy Consulting

Growth Drivers

What Is the Primary Growth Driver in the Embedded Insurance Market?

Platform integration is the primary driver. Cover Genius reports more than 200 partners, over 50 carriers and USD 3.20 Billion in cumulative gross written sales, and says its 2025 revenue rose 50%. Each new partner adds distribution without acquisition spending by the carrier, so premium scales with partner transaction volume. Based on research conducted by NMSC, we found that partner onboarding pace now sets the growth ceiling more than consumer demand, because buyers frequently accept cover when it appears inside the journey.

How Is Ecosystem Scale Driving Market Growth?

ZhongAn recorded gross written premium of RMB 35.74 billion in 2025, up 6.9%, with more than 300 ecosystem partners across e-commerce, travel and health. Allianz Partners reported total business volume of EUR 10.1 billion for 2024, including travel volume of EUR 3.32 billion. We observed that mature programs grow more slowly than newer platforms, yet they supply the claims capability, brand trust and regulatory standing that new entrants rent through partnerships.

Growth Inhibitors

What Is Restraining the Embedded Insurance Market?

Regulatory ambiguity is the primary restraint. EIOPA found in March 2026 that the Insurance Distribution Directive does not comprehensively regulate digital channels, and it noted that misaligned incentives and weak transparency persist in life and credit protection distribution. Swiss Re forecasts real non life premium growth of only 0.6% in 2026, which limits pricing support. During our market evaluation, we noticed that conduct rules and softer pricing together cap premium growth, particularly for commission led credit protection.

What Are the Growth Opportunities?

Can Electric Vehicle Programs Unlock Motor Embedding at Scale?

Manufacturer owned purchase journeys let motor cover be priced at delivery using connected vehicle data. BYD and bolttech began this model in five European markets in 2026, and ZhongAn shows rising electric vehicle penetration inside its auto book. The beneficiary is Motor and Mobility, which grows 13.6% annually. Realization depends on data sharing agreements and carrier appetite for new vehicle risk.

Can Small Business Platforms Make Commercial Cover a Default Feature?

Software and marketplace platforms already hold the transaction data that commercial underwriters need. Attaching cover through APIs turns small business onboarding into a distribution event. Commercial and Specialty grows 23.5% annually and Small and medium businesses 15.7%, both above the market. Realization requires underwriting appetite for data led risk selection and clear disclosure rules.

Can Emerging Markets Leapfrog Through API Led Health and Accident Cover?

Mobile first ecosystems can distribute health and accident protection without branch networks. ZhongAn grew its health ecosystem premiums 22.7% to RMB 12.68 billion in 2025, showing the model at scale. India is the fastest growing major country at 21.7% and Middle East & Africa the fastest region at 16.2%. Beneficiaries are Health, Accident and Life and Banking and Fintech, subject to local licensing.

Segmentation Analysis

2025 (USD Billion)
2035 (USD Billion)
Motor and Mobility 2025: $31.11 Billion | 2035: $115.97 Billion
Motor and Mo
Property and Home 2025: $16.86 Billion | 2035: $60.21 Billion
Property and
Device and Appliance Protection 2025: $23.34 Billion | 2035: $66.90 Billion
Device and A
Travel and Event 2025: $22.04 Billion | 2035: $55.75 Billion
Travel and E
Health, Accident and Life 2025: $20.75 Billion | 2035: $80.28 Billion
Health, Acci
Credit and Payment Protection 2025: $11.67 Billion | 2035: $31.22 Billion
Credit and P
Commercial and Specialty 2025: $3.89 Billion | 2035: $35.68 Billion
Commercial a
Motor and Mobility $31.11 Billion $115.97 Billion 13.57%
Property and Home $16.86 Billion $60.21 Billion 13.09%
Device and Appliance Protection $23.34 Billion $66.90 Billion 10.61%
Travel and Event $22.04 Billion $55.75 Billion 9.20%
Health, Accident and Life $20.75 Billion $80.28 Billion 13.99%
Credit and Payment Protection $11.67 Billion $31.22 Billion 9.84%
Commercial and Specialty $3.89 Billion $35.68 Billion 23.50%

Which Insurance Line Leads the Embedded Insurance Market?

Motor and Mobility held the largest value at USD 31.11 Billion in 2025 and reaches USD 115.97 Billion by 2035, supported by manufacturer and mobility platform partnerships. Commercial and Specialty is the fastest growing line at 23.5% CAGR from a small base of USD 3.89 Billion, as software platforms and marketplaces attach cover to small business workflows. We found that Health, Accident and Life adds the most absolute value after motor.

2025 (USD Billion)
2035 (USD Billion)
E-commerce a
Automotive
Travel and H
Banking and
Telecom and
Segment Item 2025 (USD Billion) 2035 (USD Billion) CAGR
E-commerce and Retail $10.0 USD Billion $40.0 USD Billion 25.0%
Automotive $17.1 USD Billion $51.1 USD Billion 15.0%
Travel and Hospitality $24.2 USD Billion $62.2 USD Billion 13.0%
Banking and Fintech $31.3 USD Billion $73.3 USD Billion 15.0%
Telecom and Consumer Electronics $38.4 USD Billion $84.4 USD Billion 12.0%

Segment-wise data is locked

Unlock complete segment-wise numbers for By Embedding Point.

Unlock Full Data
2025 (USD Billion)
2035 (USD Billion)
Checkout add
Preselected
Included in
On-demand co
Segment Item 2025 (USD Billion) 2035 (USD Billion) CAGR
Checkout add-on $10.0 USD Billion $40.0 USD Billion 21.0%
Preselected bundle $17.1 USD Billion $51.1 USD Billion 19.0%
Included in price $24.2 USD Billion $62.2 USD Billion 13.0%
On-demand cover $31.3 USD Billion $73.3 USD Billion 27.0%

Segment-wise data is locked

Unlock complete segment-wise numbers for By Purchase Mode.

Unlock Full Data
2025 (USD Billion)
2035 (USD Billion)
API based
Plugin and w
Co-branded p
Segment Item 2025 (USD Billion) 2035 (USD Billion) CAGR
API based $10.0 USD Billion $40.0 USD Billion 18.0%
Plugin and widget $17.1 USD Billion $51.1 USD Billion 8.0%
Co-branded portal $24.2 USD Billion $62.2 USD Billion 22.0%

Segment-wise data is locked

Unlock complete segment-wise numbers for By Integration Method.

Unlock Full Data
2025 (USD Billion)
2035 (USD Billion)
Carrier dire
Insurtech an
Broker and i
Segment Item 2025 (USD Billion) 2035 (USD Billion) CAGR
Carrier direct $10.0 USD Billion $40.0 USD Billion 10.0%
Insurtech and MGA platform $17.1 USD Billion $51.1 USD Billion 24.0%
Broker and intermediary led $24.2 USD Billion $62.2 USD Billion 14.0%

Segment-wise data is locked

Unlock complete segment-wise numbers for By Platform Model.

Unlock Full Data
2025 (USD Billion)
2035 (USD Billion)
Individual c
Small and me
Large enterp
Segment Item 2025 (USD Billion) 2035 (USD Billion) CAGR
Individual consumers $10.0 USD Billion $40.0 USD Billion 12.0%
Small and medium businesses $17.1 USD Billion $51.1 USD Billion 18.0%
Large enterprises $24.2 USD Billion $62.2 USD Billion 16.0%

Segment-wise data is locked

Unlock complete segment-wise numbers for By Customer Type.

Unlock Full Data
2025 (USD Billion)
2035 (USD Billion)
Single trans
Annual cover
Multi year c
Segment Item 2025 (USD Billion) 2035 (USD Billion) CAGR
Single transaction cover $10.0 USD Billion $40.0 USD Billion 15.0%
Annual cover $17.1 USD Billion $51.1 USD Billion 25.0%
Multi year cover $24.2 USD Billion $62.2 USD Billion 23.0%

Segment-wise data is locked

Unlock complete segment-wise numbers for By Policy Term.

Unlock Full Data

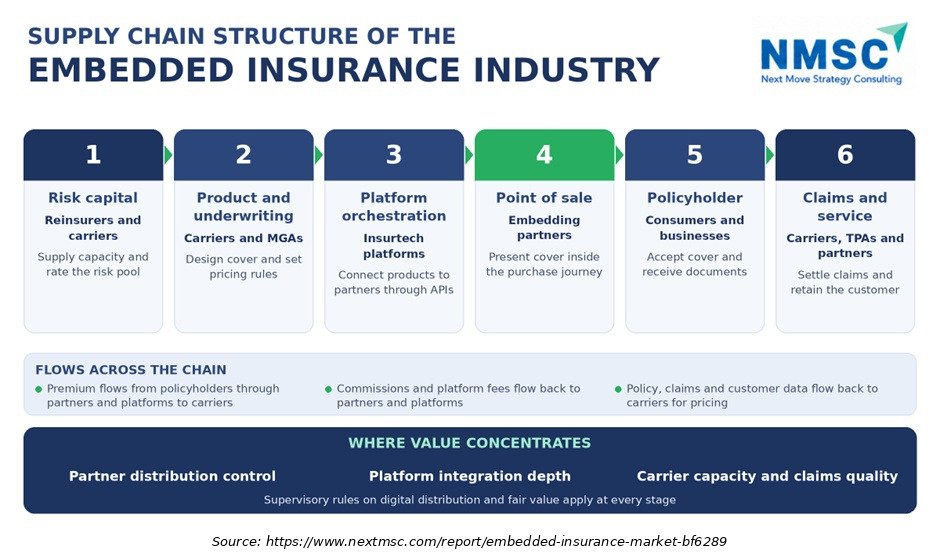
Supply Chain Structure of the Embedded Insurance Industry

Supply Chain Structure of the Embedded Insurance Industry
The above infographic traces cover from risk capital through underwriting, platform orchestration, the partner point of sale, the policyholder and claims service. It shows that premium moves forward while fees and data move back, so the participants controlling distribution and integration capture influence even when carriers hold the risk. Operators should therefore secure claims quality and partner access together to defend margins.

Growth Opportunities

Our assessment indicates that three whitespace opportunities favor vendors that invest before partner programs mature in each category.

Can Electric Vehicle Programs Unlock Motor Embedding at Scale?

Manufacturer owned purchase journeys let motor cover be priced at delivery using connected vehicle data. BYD and bolttech began this model in five European markets in 2026, and ZhongAn shows rising electric vehicle penetration inside its auto book. The beneficiary is Motor and Mobility, which grows 13.6% annually. Realization depends on data sharing agreements and carrier appetite for new vehicle risk.

Can Small Business Platforms Make Commercial Cover a Default Feature?

Software and marketplace platforms already hold the transaction data that commercial underwriters need. Attaching cover through APIs turns small business onboarding into a distribution event. Commercial and Specialty grows 23.5% annually and Small and medium businesses 15.7%, both above the market. Realization requires underwriting appetite for data led risk selection and clear disclosure rules.

Can Emerging Markets Leapfrog Through API Led Health and Accident Cover?

Mobile first ecosystems can distribute health and accident protection without branch networks. ZhongAn grew its health ecosystem premiums 22.7% to RMB 12.68 billion in 2025, showing the model at scale. India is the fastest growing major country at 21.7% and Middle East & Africa the fastest region at 16.2%. Beneficiaries are Health, Accident and Life and Banking and Fintech, subject to local licensing.

Regional Outlook

2025 (USD Billion)
2035 (USD Billion)
North Americ
Europe
Asia-Pacific
Middle East
Latin Americ
Region 2025 (USD Billion) 2035 (USD Billion) CAGR (%)
North America $10.0 USD Billion $40.0 USD Billion 9.0%
Europe $17.1 USD Billion $51.1 USD Billion 27.0%
Asia-Pacific $24.2 USD Billion $62.2 USD Billion 25.0%
Middle East & Africa $31.3 USD Billion $73.3 USD Billion 23.0%
Latin America $38.4 USD Billion $84.4 USD Billion 12.0%

Regional data is locked

Unlock complete regional numbers for this market.

Unlock Full Data

Competitive Landscape

NMSC's analysis indicates that the competitive landscape combines carrier led B2B2C programs, ecosystem insurers and specialist platforms, and competition is increasing as partners demand faster integration.

Dimension Description
Market Structure Moderately fragmented; carrier led programs hold large legacy volumes while platform led models grow faster, and no single player dominates every embedding point
Innovation Focus API orchestration, agentic commerce protection, connected vehicle underwriting and automated claims handling
M&A Activity Partnership led expansion between carriers, banks and platforms, with selective acquisitions planned by funded platforms to enter new verticals

How Do Companies Compete in the Embedded Insurance Market?

Companies compete on partner access, integration speed, claims quality and price transparency. Cover Genius operates in more than 60 countries and works with over 200 partners, while Allianz Partners links travel and health programs to airline and mobility partners. Our findings suggest that geographic reach and partner depth decide contract wins, and pricing is increasingly bundled into partner revenue share models rather than stand alone premiums.

Which Competitive Archetypes Dominate the Embedded Insurance Market?

Three archetypes dominate. Carrier led programs include Allianz Partners, AXA Partners and Assurant, which combine capacity with service networks. Ecosystem insurers such as ZhongAn embed cover in large consumer platforms. Specialist platforms including Cover Genius and bolttech connect partners to many carriers through APIs. Differentiation themes are claims experience, data access and compliance automation, and the archetypes now partner rather than compete head on.

What Innovation and Differentiation Strategies Are Companies Pursuing?

Our assessment indicates that innovation focuses on AI enabled distribution and servicing. Cover Genius said its July 2026 capital raise will fund hyper personalization, agentic distribution and automated claims resolution, and it launched an agentic protection product in October 2026. bolttech positions its platform around AI enabled orchestration for manufacturers such as BYD. These strategies aim to raise attach rates and cut servicing cost per policy.

What M&A and Partnership Activity Is Shaping the Market?

Partnerships are the main strategic tool. AXA Partners and bolttech combined European B2B2C distribution in October 2025, and ING and Mehrwerk joined bolttech in 2026. Our analysis shows that funded platforms also plan selective acquisitions, since Cover Genius stated that part of its raise will support entry into new verticals. Consolidation is likely to follow as partners prefer fewer integrations with broader product shelves.

Key Market Players

Based on research conducted by NMSC, we found that the following six companies represent the validated leadership set, ranked qualitatively because official disclosures rarely isolate embedded premium.

Allianz Partners Assurant, Inc. AXA Partners ZhongAn Online P & C Insurance Co., Ltd. Cover Genius bolttech

Latest Developments

We observed that 2025 to 2026 activity centers on bank, manufacturer and loyalty platform partnerships that extend embedded cover into new journeys.

Date Event
13 October 2026 Cover Genius introduced Agentic Embedded Protection, enabling AI platforms to surface context-aware coverage, pricing and regulatory disclosures natively within consumer conversations. The solution supports in-chat selection and policy inquiries, while digital claims and post-purchase servicing are routed through its XCover platform. It is available immediately to platform partners.
11 June 2026 ING and bolttech announced a partnership to expand embedded insurance and protection offerings across European customer channels. The proposition was already live in the Netherlands, Italy, Poland and Belgium, with further markets planned, combining ING’s banking customer reach with bolttech’s insurance technology and servicing capabilities.

Investment Opportunities

Where Are Capital Inflows Concentrating in the Embedded Insurance Market?

Capital is concentrating in platforms that connect partners to many carriers. Cover Genius raised USD 0.10 Billion in July 2026 at a valuation of USD 1.90 Billion, backed by Vista Credit Partners, and reported cumulative gross written sales above USD 3.00 Billion. NMSC's analysis indicates that credit style financing signals that investors value recurring partner revenue, although company growth alone does not prove market attractiveness.

How Is Infrastructure Investment Shaping Market Capacity?

Infrastructure spending targets integration layers, AI servicing and compliance automation. Cover Genius stated that its funding will support platform scalability, AI based claims resolution and enhanced integration capabilities for enterprise partners. NMSC interpretation is that capacity is limited less by capital than by the ability to onboard partners and handle multi jurisdiction rules, so investment in connectors, policy administration and localized servicing should raise capacity fastest.

What ESG Considerations Are Influencing Market Investment?

Governance and social factors dominate. Insurance Europe responded in July 2026 to a draft IAIS Issues Paper on customers receiving value from insurance products, and EIOPA flagged transparency and incentive risks in March 2026. NMSC interpretation is that fair value evidence, clear consent and inclusive access for gig workers and first time buyers will influence which programs attract long term capital, while environmental factors remain secondary.

Key Benefits for Stakeholders

How Does This Report Benefit Embedding Partners and Platform Operators?

Retailers, manufacturers, banks and travel brands gain segment level sizing across seven axes, helping them judge where cover attaches best. The Embedding Point analysis shows Automotive reaching USD 102.59 Billion by 2035, and Purchase Mode data shows Included in price growing 15.0% annually. These figures support decisions on revenue share, consent design and whether to bundle cover into the price.

How Does This Report Benefit Carriers, MGAs and Insurtech Platforms?

Carriers and platform teams gain a view of which lines and models grow fastest, including Commercial and Specialty at 23.5% and Insurtech and MGA platforms at 15.0%. Integration Method data shows API based delivery reaching USD 258.69 Billion by 2035. This evidence informs product shelf design, partner targeting and the build, buy or partner choice for distribution technology.

How Does This Report Benefit Investors and Financial Analysts?

Investors gain a reconciled sizing at USD 129.66 Billion in 2025 growing to USD 446.01 Billion by 2035, with regional and country detail from 21.7%% growth in India to a mature U.S. base. The Customer Type and Policy Term splits support judgments on recurring revenue quality, since Multi year cover grows 17.2% annually, and the competitive section identifies partnership led strategies.

Key Market Segments Evaluated

By Insurance Line

  • Motor and Mobility
  • Property and Home
  • Device and Appliance Protection
  • Travel and Event
  • Health, Accident and Life
  • Credit and Payment Protection
  • Commercial and Specialty

By Embedding Point

  • E-commerce and Retail
  • Automotive
  • Travel and Hospitality
  • Banking and Fintech
  • Telecom and Consumer Electronics
  • Real Estate and Utilities
  • Mobility and Gig Platforms

By Purchase Mode

  • Checkout add-on
  • Preselected bundle
  • Included in price
  • On-demand cover

By Integration Method

  • API based
  • Plugin and widget
  • Co-branded portal

By Platform Model

  • Carrier direct
  • Insurtech and MGA platform
  • Broker and intermediary led

By Customer Type

  • Individual consumers
  • Small and medium businesses
  • Large enterprises

By Policy Term

  • Single transaction cover
  • Annual cover
  • Multi year cover

By Region

  • North America 
    • U.S.
    • Canada
    • Mexico
  • Europe 
    • UK
    • Germany
    • France
    • Italy
    • Spain
    • Sweden
    • Denmark
    • Finland
    • Netherlands
    • Rest of Europe
  • Asia-Pacific 
    • China
    • India
    • Japan
    • South Korea
    • Taiwan
    • Indonesia
    • Vietnam
    • Australia
    • Philippines
    • Malaysia
    • Rest of APAC
  • Middle East & Africa 
    • Saudi Arabia
    • UAE
    • Egypt
    • Israel
    • Turkey
    • Nigeria
    • South Africa
    • Rest of MEA
  • Latin America 
    • Brazil
    • Argentina
    • Chile
    • Colombia
    • Rest of LATAM

Conclusion & Recommendations

The long term outlook is positive, with revenue expanding from USD 152.48 Billion in 2026 to USD 446.01 Billion by 2035. Our findings suggest that growth is underpinned by partner integration, manufacturer programs and platform partnerships, while the 12.7% CAGR is well below the highest published growth claims because mature carrier programs move at single digit rates. The trajectory reflects distribution change rather than a short technology cycle.

What Strategic Positioning Recommendations Does NMSC Offer?

Platforms should prioritize API integration and consent design to capture Insurtech and MGA platform growth of 15.0% annually. Carriers should open capacity to several platforms and invest in claims quality, since partner programs depend on service outcomes. Partners should test Included in price structures, which grow 15.0% annually, only where disclosure and fair value evidence are strong.

How Attractive Is the Embedded Insurance Market for Investment?

Attractiveness is high but selective. The USD 293.53 Billion absolute opportunity between 2026 and 2035 favors platforms with recurring partner revenue and carriers with disciplined underwriting. Our assessment indicates that Asia-Pacific adds the largest absolute value, while Middle East & Africa grows fastest at 16.2%. North America remains the largest base with the most documented partner programs.

What Are the Key Market Shifts and Risks in the Embedded Insurance Market?

Key shifts include movement from add-on selling toward bundled and included cover, rising use of agentic channels, and consolidation of integrations around fewer platforms. Risks include regulatory gaps on digital distribution identified by EIOPA, conduct scrutiny of partner commissions, soft non life pricing and weak consumer trust where claims friction persists. NMSC interpretation is that fair value evidence will separate durable programs from short lived ones.

What Are the Primary Growth Pathways Through 2035?

Primary pathways are electric vehicle motor programs, commercial cover attached to small business platforms, and API led health and accident cover in emerging markets. Our analysis shows that vendors combining platform breadth, carrier capacity and local licensing are best positioned to capture the USD 293.53 Billion opportunity, especially in India and Middle East & Africa, where growth starts from a low base.

FAQs

About the Author

Mihul Sharma

Mihul Sharma

Mihul Sharma is Research Associate at Next Move Strategy Consulting, where he has covered technology, industrial, and healthcare markets for 3 years. His work applies structured business research, market analysis, and secondary-source review to assess market trends, competitive developments, and growth opportunities. He supports report development by fully synthesizing industry data, company information, and market signals into concise findings for strategy and investment-focused research teams.

About the Reviewer

Supradip Baul

Supradip Baul

Supradip Baul is an accomplished business consultant and strategist with over a decade of rich experience in market intelligence, strategy, technology, and business transformation. His work has included rigorous qualitative and quantitative analysis across multiple industries, helping clients shape investment decisions and long-term roadmaps. Earlier in his career, he was associated with Gartner, where he contributed to industry-leading reports and market share analyses. He has worked with leading global companies and holds an MBA with a dual specialization in Marketing and Finance.

Download Free Sample

Pratyush Kumar Das

PRATYUSH KUMAR DAS

Assistant Manager

Polycab India Limited

We would like to express our appreciation for the data and insights provided by nextmsc. We are very pleased with the quality and depth of the information, which has proven to be highly valuable and beneficial for our business decision-making.

Ross J Mckenzie

ROSS J MCKENZIE

Business Insight Manager

Staysure Group

“Next MSC have been incredibly helpful in providing detailed & robust information on our market, alongside quantifying growth by different segments. The process to procure was simple and easy, with sample reports and regular contact to ensure we had what we needed. Succinct detail on their sources & methodologies is also greatly received, allowing transparency in this respect helps build trust in the detail you pay for. Joseph in particular was fantastic, and helped ensure efficient provision of the insight pack – thank you NMSC!”.

Diana Trejo

DIANA TREJO

Assistant Manager

Sumitomo Corporation de Mexico, S.A. de C.V.

Recently, we purchased a report on the Mexico Data Center Market from Next Move Strategy Consulting. The service has been excellent, with support that is always timely and thoroughly professional. The information provided is interesting, highly useful, and delivered with clarity. I would highly recommend NextMSC for anyone seeking insightful and dependable analysis.

Kishu Kanda

KISHU KANDA

Strategy Analyst

Accenture

We purchased the AI Consumer Market Report from this company. Not only did they customize the report to meet our specific requirements, but they also showed great flexibility in accommodating our budget. The report we received fully met our expectations. Additionally, they provided prompt and thorough responses to both our pre-purchase and follow-up questions. We look forward to working with this company again in the future.

Gustaf Hummel Burstrom

GUSTAF HUMMEL BURSTROM

Founder

Revline Tools AB

Joseph and the team at Next Move Strategy Consulting have been excellent to work with, in supplying us with relevant market data and forecasts for our specific category. We had some special requirements and they were able to do a custom package to suit our needs. We would definitely recommend them to any other company needing market data and forecasts

Custom Market Research Services

We will customize the research for you if the listed report does not fully match your requirements.

Get 30% Free Customization

Select License

This website uses cookies to ensure you get the best experience on our website. Learn more

✖