Empty Capsules Market by Product (Gelatin Capsule, Non-Gelatin Capsule), Raw Material (Pig Meat, Bovine Meat, Bone, HPMC, Other), Therapeutic Application (Antibiotic & Antibacterial Drug, Vitamin & Dietary Supplement, Antacids & Anti-flatulent Preparation, Cardiac Therapy Drug, Other), End User (Pharmaceutical, Nutraceutical, Other) - Global Opportunity Analysis and Industry Forecast, 2020 – 2030
Industry: Healthcare | Publish Date: 20-Feb-2025 | No of Pages: 480 | No. of Tables: 278 | No. of Figures: 248 | Format: PDF | Report Code : HC35
Market Definition:
The global empty capsules market size was valued to USD 2.20 billion in 2019, and is predicted to garner USD 4.90 billion by 2030, witnessing a CAGR of 7.50% from 2020-2030.
Capsules are encapsulated medicines with administered dosage embedded into relatively stable shells, that can be consumed orally or as suppositories. Empty capsules are of two types, gelatin-based and non-gelatin-based. The drug to be embedded into the capsule shell matrix may be in powdered form, liquid form, granule form or in solubilized, suspended or chemically bound form. Intake of these capsules can be prescribed or non-prescribed medications. The drugs used by an individual in a lifetime increases almost linearly with age. In addition, these capsules are been highly preferred by people due to the ease of consumption and their availability at medical stores.
Market Dynamics and Trends
The global empty capsules market is booming, due to factors such as increasing popularity of capsules over other drug delivery modes, soaring demand of these capsules in the pharmaceutical and nutraceutical industries, as well as growing investments by key manufacturers in the untapped market of emerging economies.
Furthermore, growing geriatric population world-wide, increasing consumption of theses capsules with age, and a number of benefits offered by these capsules such as quicker absorption rates, fast disintegrating nature as well as tasteless and odorless coatings; are expected to propel the growth of the global empty capsules market, throughout the forecast period.
However, increasing gelatin prices, lower availability of raw materials, ethical concerns regarding consumption of animal-derived inactive materials, and stringent regulatory standards in pharmaceutical industry, limits the growth of empty capsules market. Moreover, increasing R&D activities and clinical trials, as well as higher inclination towards health & fitness-oriented lifestyles, are paving the way for several lucrative opportunities in the global empty capsules market, in coming future.
Market Segmentations and Scope of the Study:
The empty capsules market share has been analyzed based on product, raw material, therapeutic application, end user, and geography.
Based on type of product, the empty capsules market is segmented into gelatin capsule and non-gelatin capsule. Based on raw material, the empty capsules market covers pig meat, bovine meat, bone, HPMC, and other. Based on therapeutic application, the empty capsules market is classified into antibiotic & antibacterial drug, vitamin & dietary supplement, antacids & anti-flatulent preparation, cardiac therapy drug, and other. Based on end user, the empty capsules market is divided into pharmaceutical, nutraceutical, and other. Geographic breakdown and analysis of each of the previously mentioned segments include regions comprising North America, Europe, Asia-Pacific, and RoW.
Geographical Analysis
North America is anticipated to hold the highest empty capsules market share during the forecast period owing to preference for capsule-based nutraceutical formulations, health-focused trends, high consumer awareness, and technological advancements.
It is expected that the emerging economies, specifically in the Asia-Pacific region would witness increasing market size in the global empty capsules market, owing to growth of pharmaceutical industries, increasing government initiatives to improve healthcare infrastructures, changing trend towards fitness-oriented lifestyles, and rising geriatric population.
Competitive Landscape
Comprehensive competitive analysis and profiles of the major market players such as CapsCanada Corporation, Lonza Group Ltd., Medi-Caps Ltd., Snail Pharma Industry Co. Ltd, Suheung Co., Ltd, ACG Worldwide, Mitsubishi Chemical Holdings Corporation, Roxlor LLC, Sunil Healthcare Ltd., Bright Pharma Caps Inc., and others are provided in the empty capsules market report. An upsurge in R&D activities and advancement in product technologies along with new product launches by the key players, is leading the healthcare infrastructure to new heights, thereby creating lucrative opportunities in the global empty capsules market.
For instance, in August 2019, ACG Capsules a part of ACG Group, one of the major players of empty capsules market, introduced its new-line of clean-label, robust and inert HPMC capsules namely ‘ACGcaps H+’, to meet a wide variety of nutraceutical and pharmaceutical requirements. ACGcaps H+ capsules are formulated without the use of gelatin, animal by-products, wheat, gluten, starch, or any other gelling agent, and are compatible for hygroscopic and moisture-sensitive formulations. It proves to be the best consumer option for vegetarian and clean-label capsules. The ACGcap H+ capsules are suitable for filling powders, granules, pellets for both prescribed and non-prescribed pharmaceutical ingredients, traditional medicines, nutraceutical dietary supplements and other such formulations.
Lonza Group Ltd., a pioneer manufacturer in the empty capsules market, introduced its patented and naturally unique Capsugel Plantcaps capsules along with other plant-based formulations featuring natural colors, natural ingredients, natural polymers, and other finished natural products at the Natural Products Expo West-2020. These patented capsules formulated using tapioca and other natural ingredients, are suitable for both powdered as well as liquid fills. Plantcaps capsules not only provide oxygen defense for sensitive ingredients, but they also help mask taste and odor. This formulation offered by Lonza has the potential for healthy hair & skin, plus it is an absolutely vegetarian, omega-3 supplement solution featuring algal oil to support cognitive and cardiovascular health. With this Lonza demonstrates its science-backed, customized solutions that support clean-label innovation and steps towards achieving sustainable development.
Key Benefits
-
The empty capsules market report provides the quantitative analysis of the current market and estimations through 2020-2030 that assists in identifying the prevailing market opportunities to capitalize on.
-
The study comprises a deep dive analysis of the empty capsules market including the current and future trends for depicting the prevalent investment pockets in the market
-
The report provides detailed information related to key drivers, restraints, opportunities, and their impact on the empty capsules market.
-
The report incorporates competitive analysis of the market players along with their market share and the global empty capsules market size.
-
The SWOT analysis and Porters Five Forces model is elaborated in the study for the empty capsules market.
-
Value chain analysis in the empty capsules market study provides a clear picture of the stakeholders’ roles.
Key Market Segments
By Product
-
Gelatin Capsule
-
Non-Gelatin Capsule
By Raw Material
-
Pig Meat
-
Bovine Meat
-
Bone
-
HPMC
-
Other
By Therapeutic Application
-
Antibiotic & Antibacterial Drug
-
Vitamin & Dietary Supplement
-
Antacids & Anti-flatulent Preparation
-
Cardiac Therapy Drug
-
Other
By End User
-
Pharmaceutical
-
Nutraceutical
-
Other
By Geography
-
North America
-
U.S.
-
Canada
-
Mexico
-
-
Europe
-
UK
-
Germany
-
France
-
Italy
-
Rest of Europe
-
-
Asia-Pacific
-
China
-
India
-
Japan
-
Australia
-
Rest of Asia-Pacific
-
-
RoW
-
UAE
-
Saudi Arabia
-
South Africa
-
Brazil
-
Remaining Countries
-
Key Players
-
ACG Worldwide
-
Bright Pharma Caps Inc.
-
CapsCanada Corporation
-
Lonza Group Ltd.
-
Medi-Caps Ltd.
-
Mitsubishi Chemical Holdings Corporation
-
Roxlor LLC
-
Snail Pharma Industry Co. Ltd.
-
Suheung Co., Ltd
-
Sunil Healthcare Ltd.
REPORT SCOPE AND SEGMENTATION:
|
Parameters |
Details |
|
Analysis Period |
2019–2030 |
|
Base Year Considered |
2020 |
|
Forecast Period |
2020–2030 |
|
Market Size Estimation |
Billion (USD) |
|
Market Segmentation |
By Product (Gelatin Capsule, Non-Gelatin Capsule), Raw Material (Pig Meat, Bovine Meat, Bone, HPMC, Other), Therapeutic Application (Antibiotic & Antibacterial Drug, Vitamin & Dietary Supplement, Antacids & Anti-flatulent Preparation, Cardiac Therapy Drug, Other), End User (Pharmaceutical, Nutraceutical, Other) |
|
Geographical Segmentation |
North America (U.S., Canada, Mexico) Europe (UK, Germany, Italy, France, Rest of Europe), Asia-Pacific (China, Japan, India, Australia, Rest of APAC), Rest of the World (UAE, Saudi Arabia, South Africa, Brazil, Remaining countries) |
|
Companies Profiled |
CapsCanada Corporation, Lonza Group Ltd., Medi-Caps Ltd., Snail Pharma Industry Co. Ltd, Suheung Co., Ltd, ACG Worldwide, Mitsubishi Chemical Holdings Corporation, Roxlor LLC, Sunil Healthcare Ltd., Bright Pharma Caps Inc. |
")


About the Author
 Sikha Haritwal is a researcher with more than 5 years of experience. She has been keeping a close eye on several industry verticals, including construction & manufacturing, personal care products, and consumer electronics. She has avid interest in writing news articles and hopes to use blog as a platform to share her knowledge with others.
About the Reviewer
 Supradip Baul is an accomplished business consultant and strategist with over a decade of rich experience in market intelligence, strategy, technology and business transformation. His work has included rigorous qualitative and quantitative analysis across multiple industries, helping clients shape investment decisions and long-term roadmaps. Earlier in his career, he was associated with Gartner, where he contributed to industry-leading reports and market share analyses. He has worked with leading global companies and holds an MBA with a dual specialization in Marketing and Finance.
At Next Move Strategy Consulting, we understand that insightful market research is the cornerstone of successful business decisions. That's why we employ a robust and multifaceted approach, combining various methodologies to deliver the most accurate and actionable data for our clients.

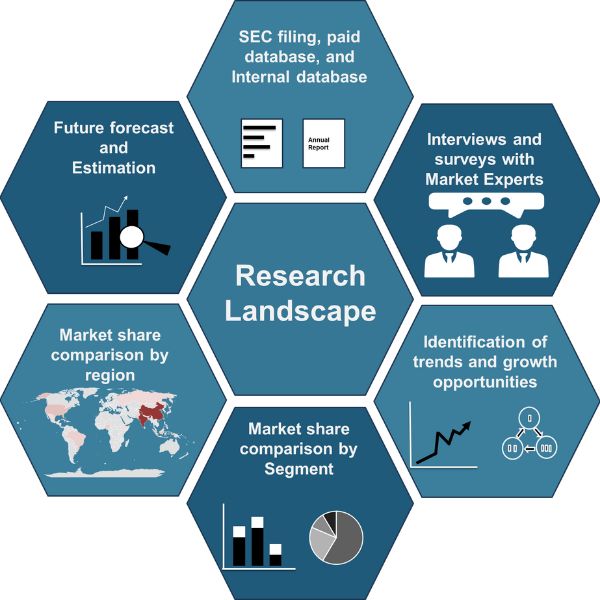
Research Landscape
We navigate the world of research with two primary approaches:
Qualitative Approach
Our qualitative research methodologies involve immersive techniques such as in-depth interviews, focus groups, and observational studies. By engaging directly with individuals and stakeholders, we uncover valuable insights that quantitative data alone may overlook.
Quantitative Research
In tandem with qualitative methodologies, NMSC leverages the power of Quantitative Research to provide a robust foundation of numerical insights. Through systematic data collection and analysis, we quantify patterns, preferences, and market trends, offering a comprehensive view of the business landscape.
Our quantitative research approach employs diverse tools, including surveys, experiments, and statistical modelling. These methodologies enable us to gather data from a large and representative sample, ensuring the statistical significance of our findings. By employing structured questionnaires and standardized data collection methods, we guarantee the reliability and validity of the information we present to our clients.
Quantitative research is particularly effective in measuring the prevalence of trends, assessing market size, and gauging the impact of various factors on consumer behavior. The numerical precision attained through this approach equips our clients with actionable insights, facilitating data-driven decision-making and strategy formulation.
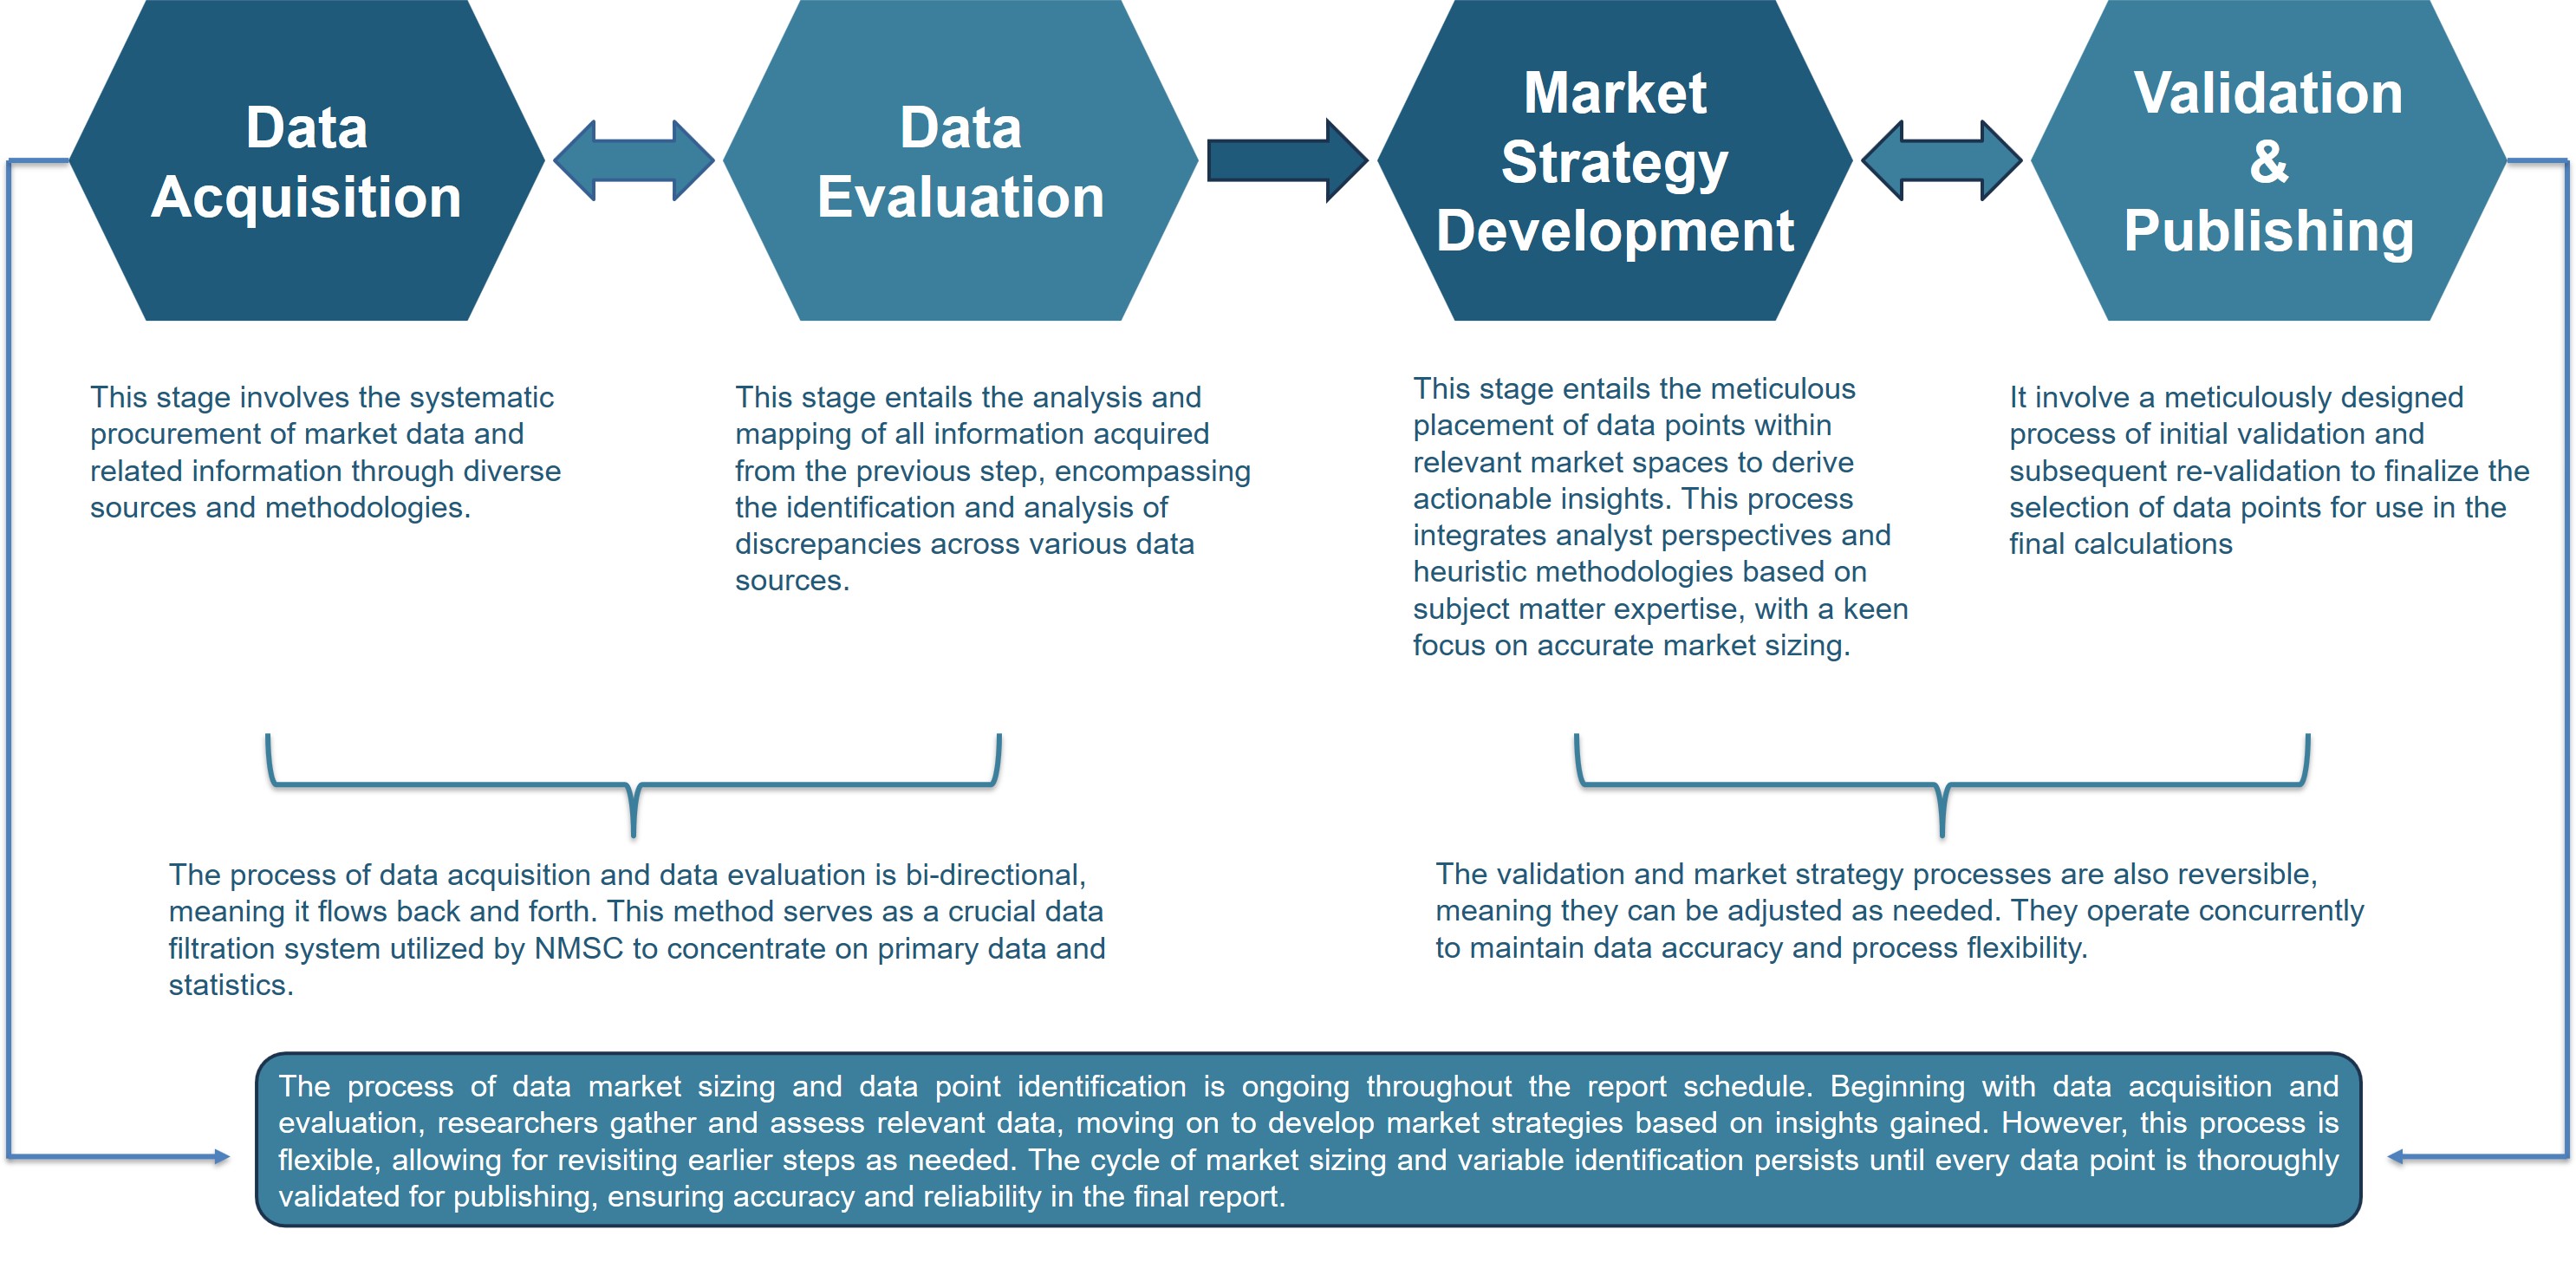
Our Specialized Toolbox for Industry-Specific Market Research
We deploy a specialized arsenal of techniques tailored to meet your unique requirements. Here's a glimpse into our comprehensive toolbox:

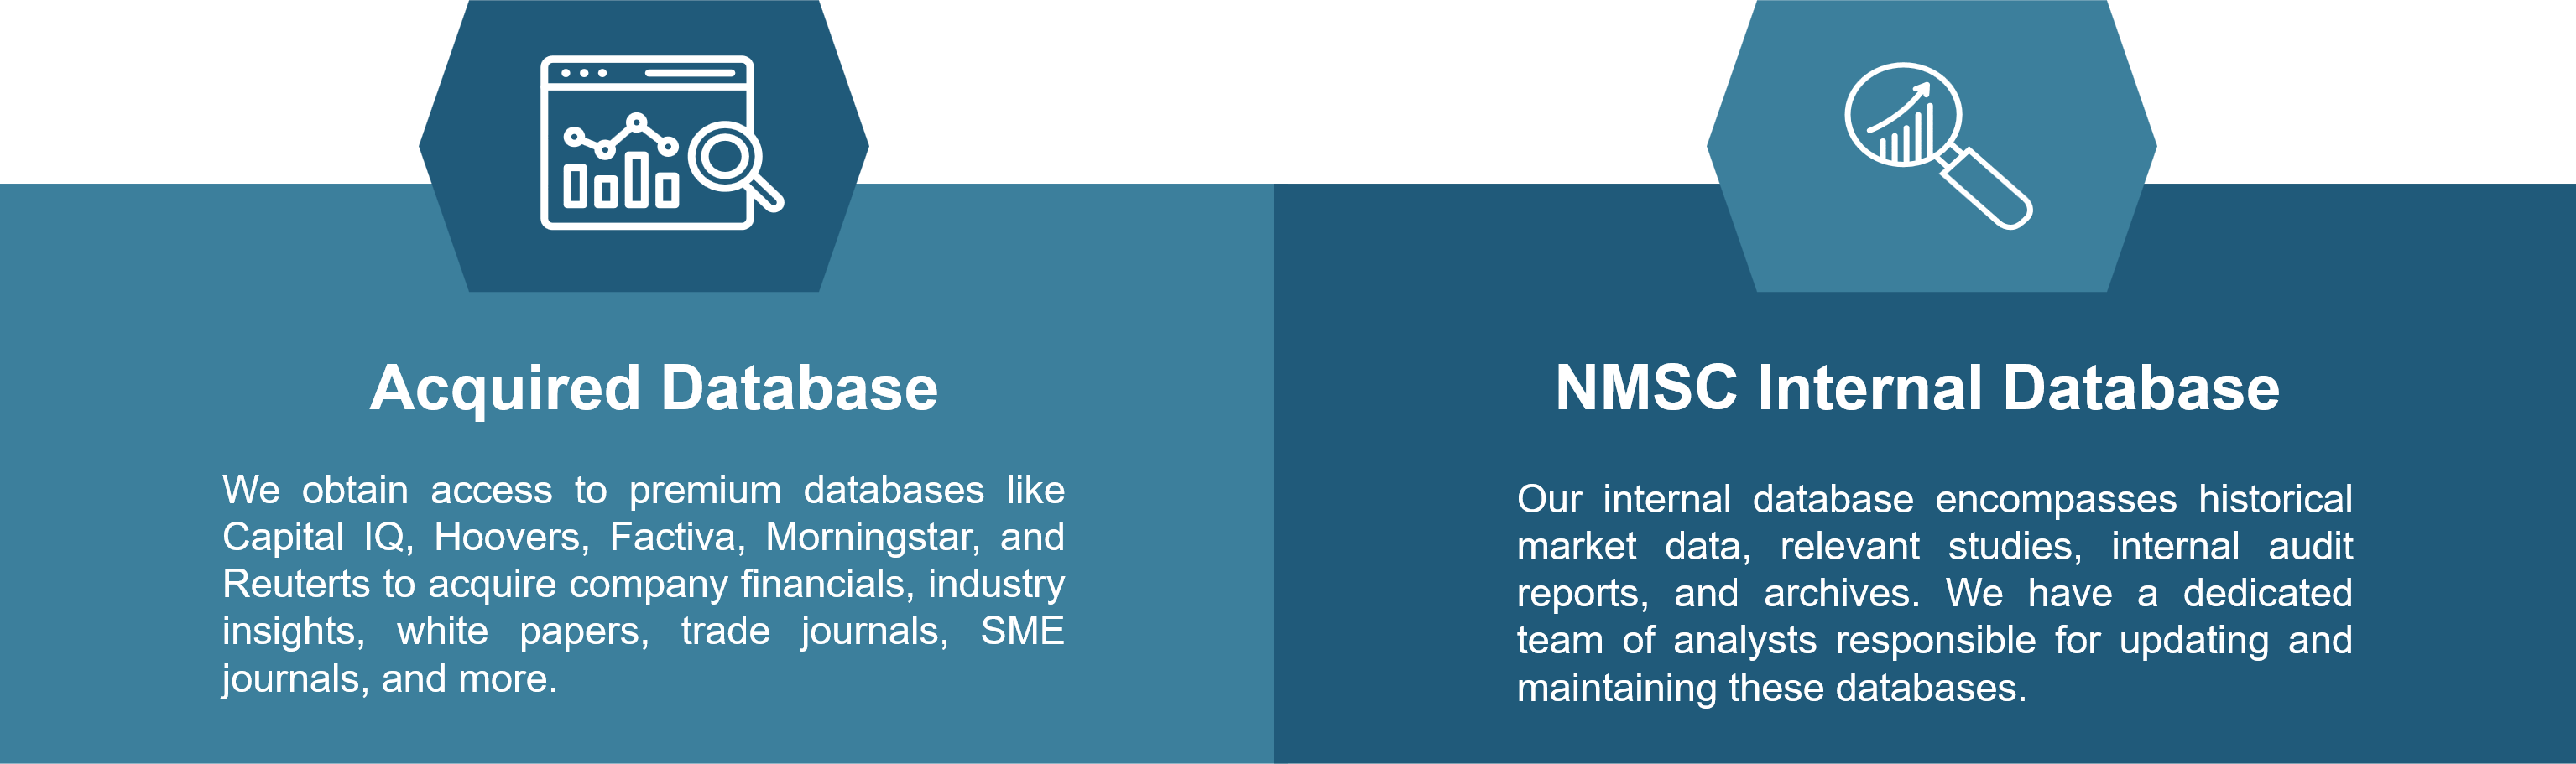
Information Procurement
The stage entails acquiring market data or relevant information through various sources and methodologies.

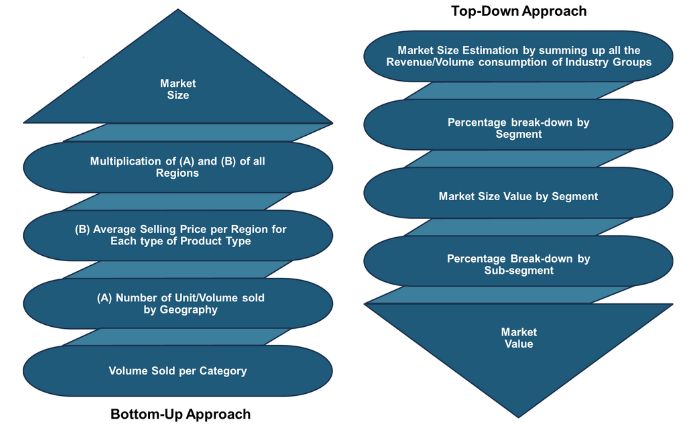
Market Research Approach
We utilize both top-down and bottom-up approaches in market research analysis to achieve a comprehensive understanding of the market dynamics, leveraging the broad perspective of industry trends and macroeconomic factors alongside detailed insights from specific segments and individual companies.
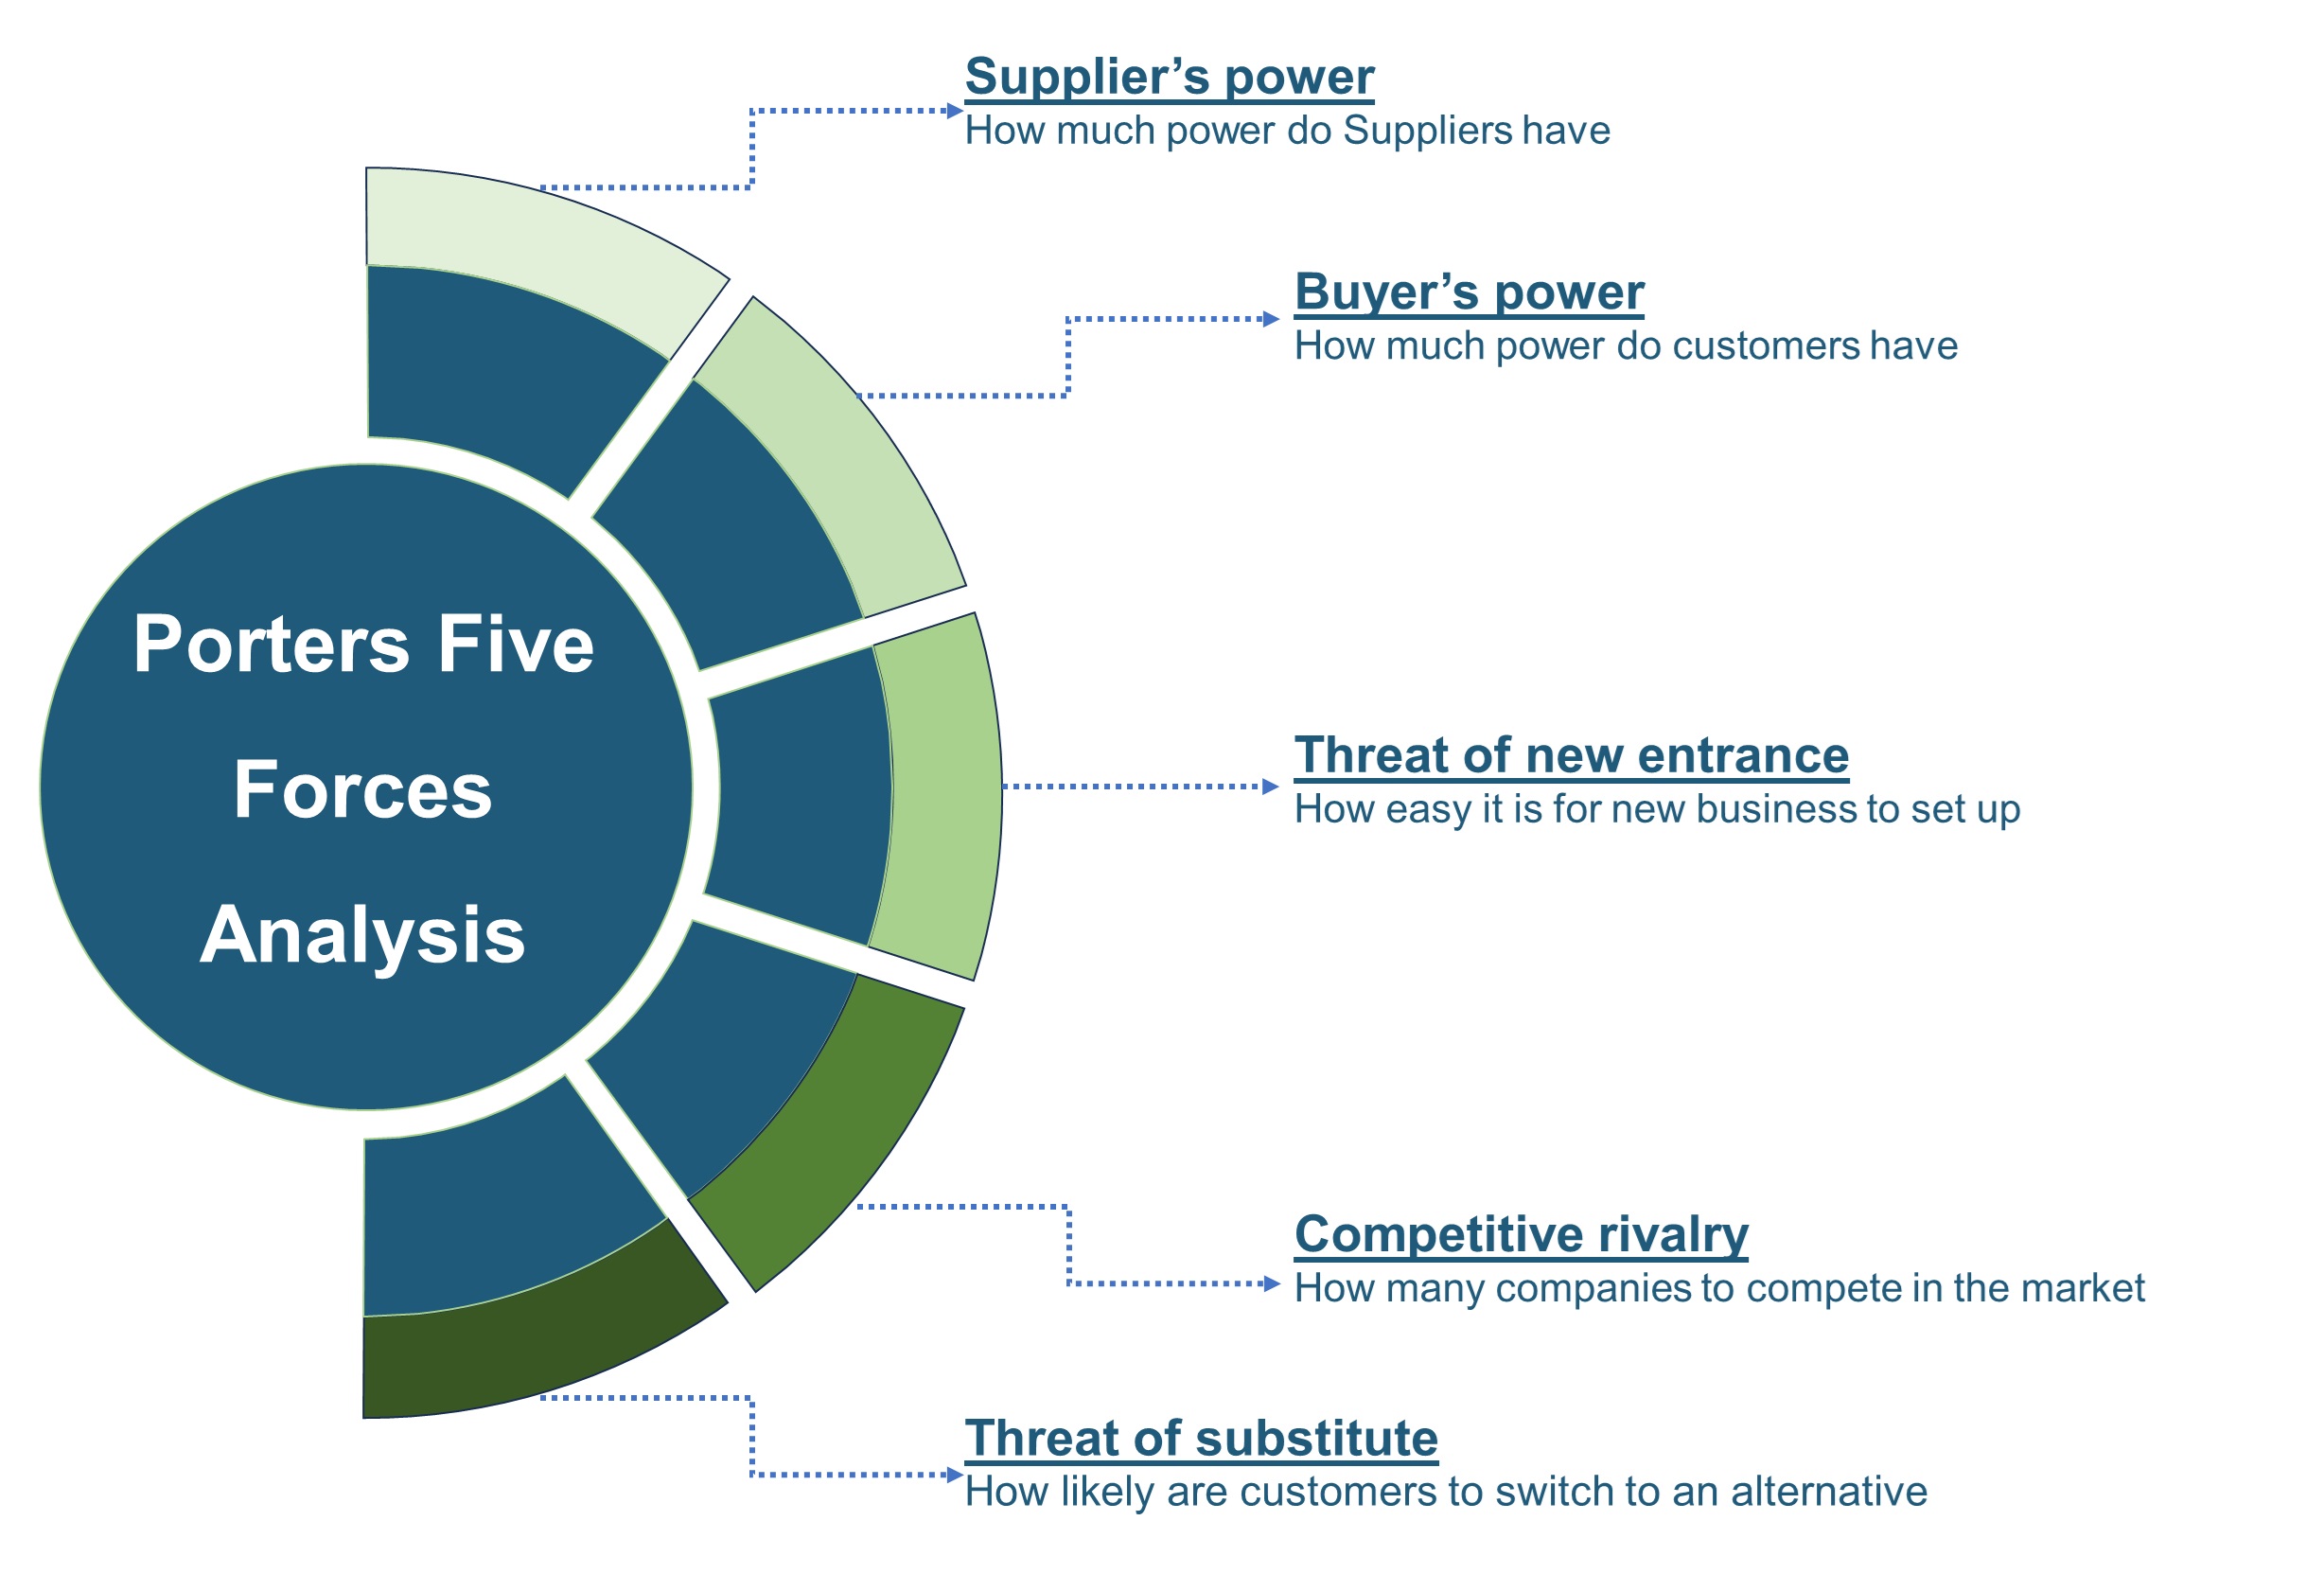
Porters Five Forces Analysis
We conduct Porter's Five Forces analysis to evaluate the competitive landscape of an industry, providing us with insights into factors that affect profitability and strategic positioning.
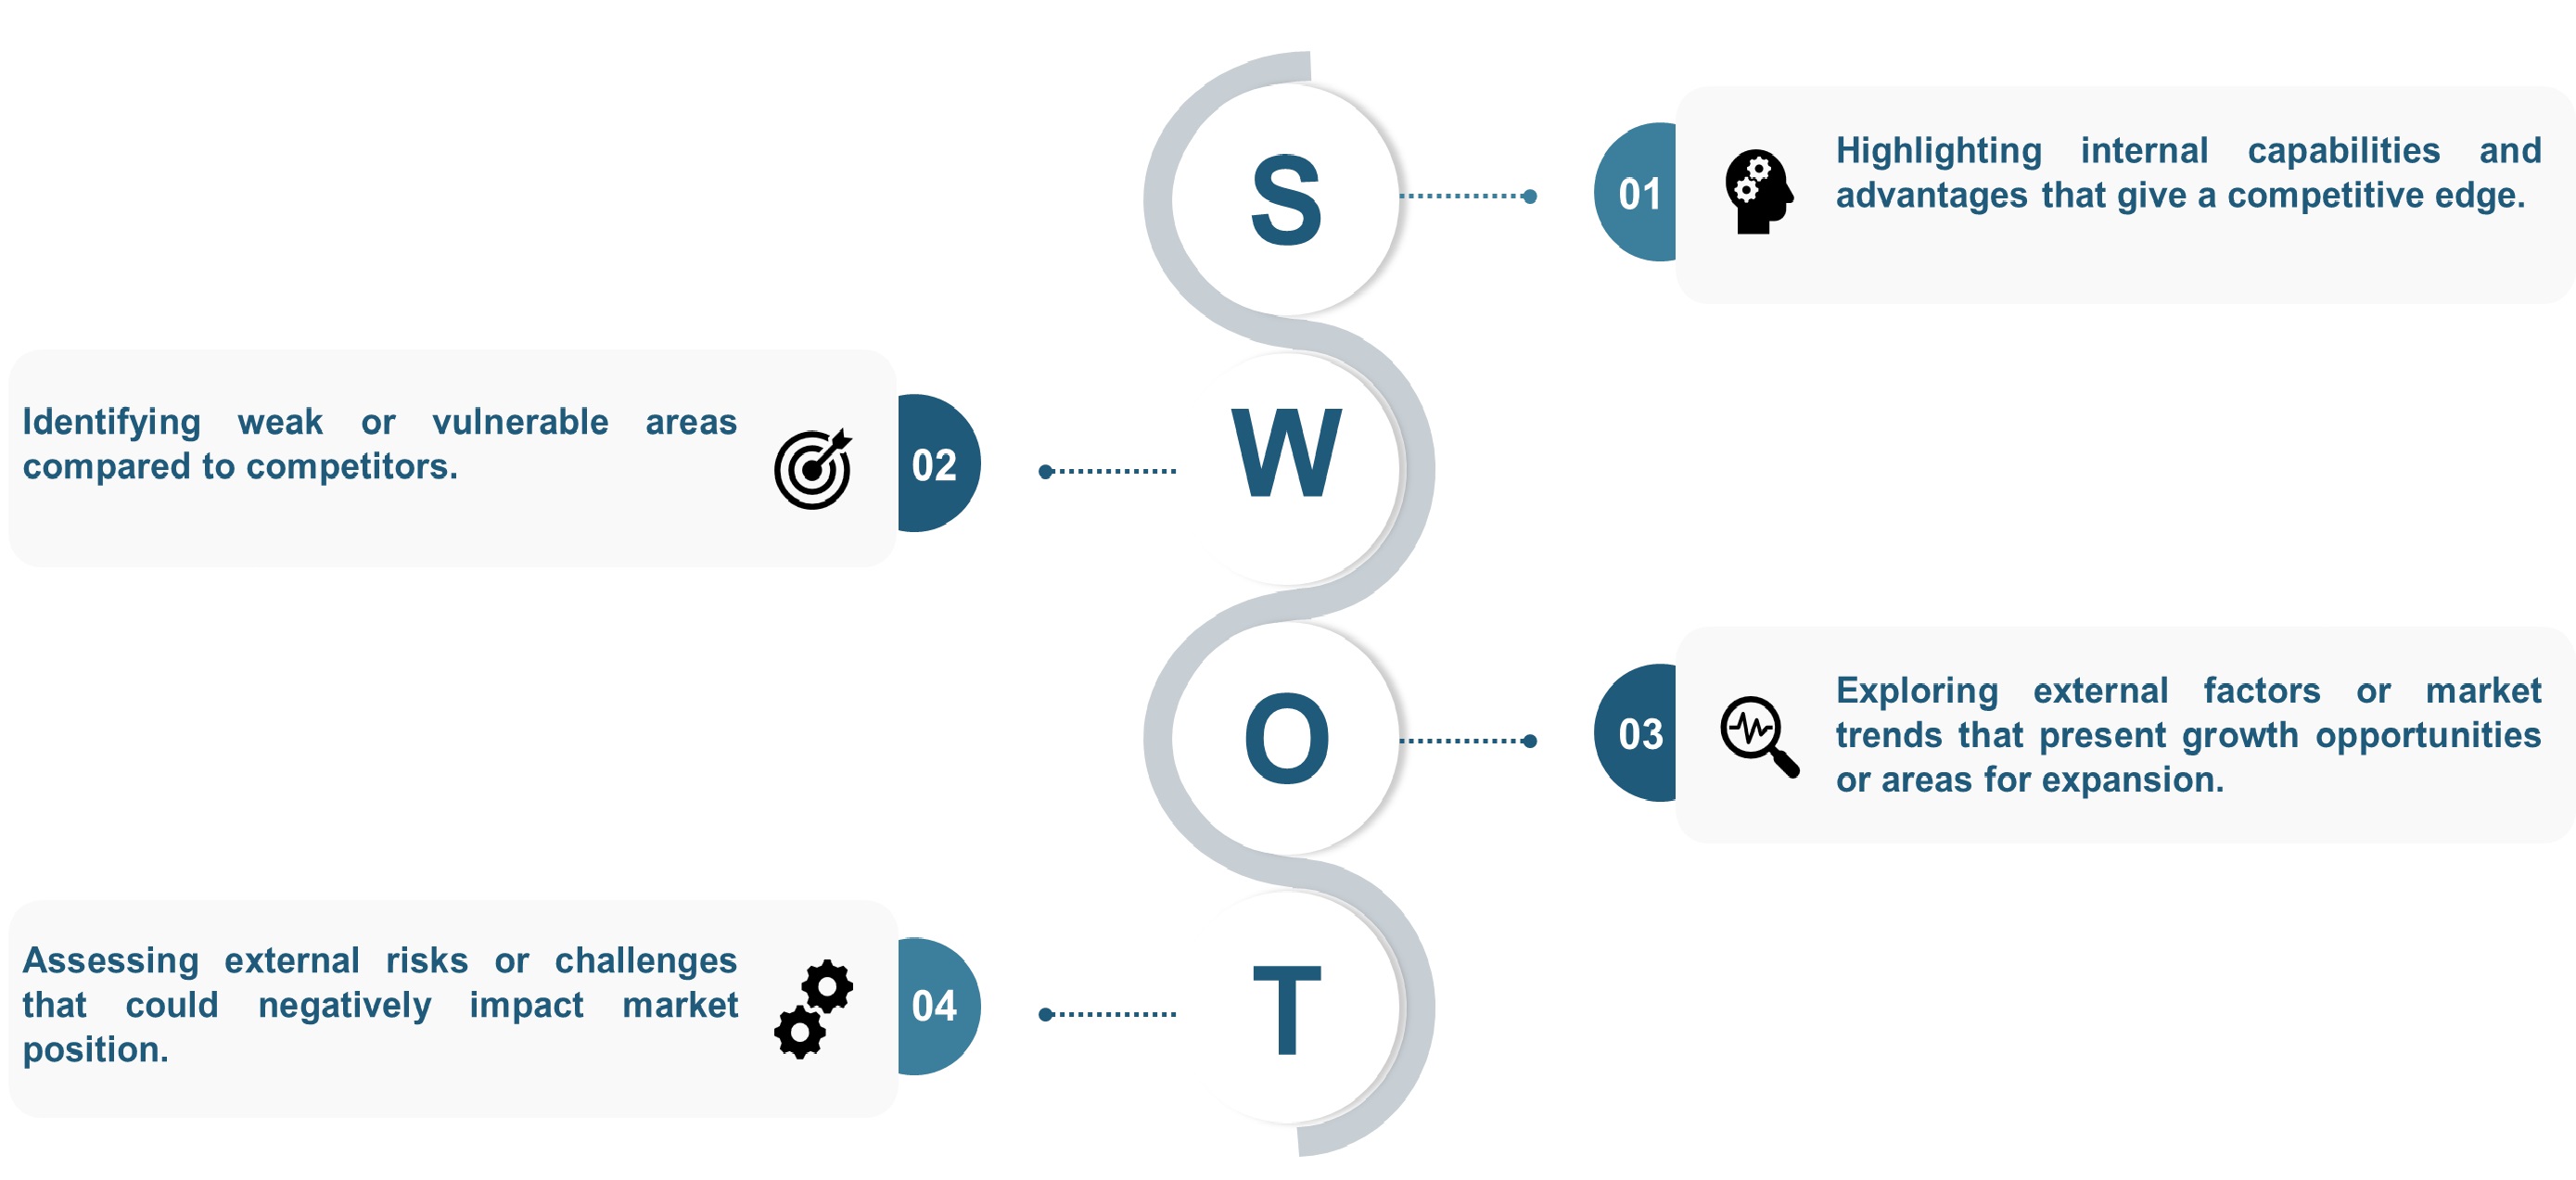
SWOT Analysis
We conduct SWOT analysis to understand market trends, identify potential threats, capitalize on opportunities, and assess our strengths and weaknesses.
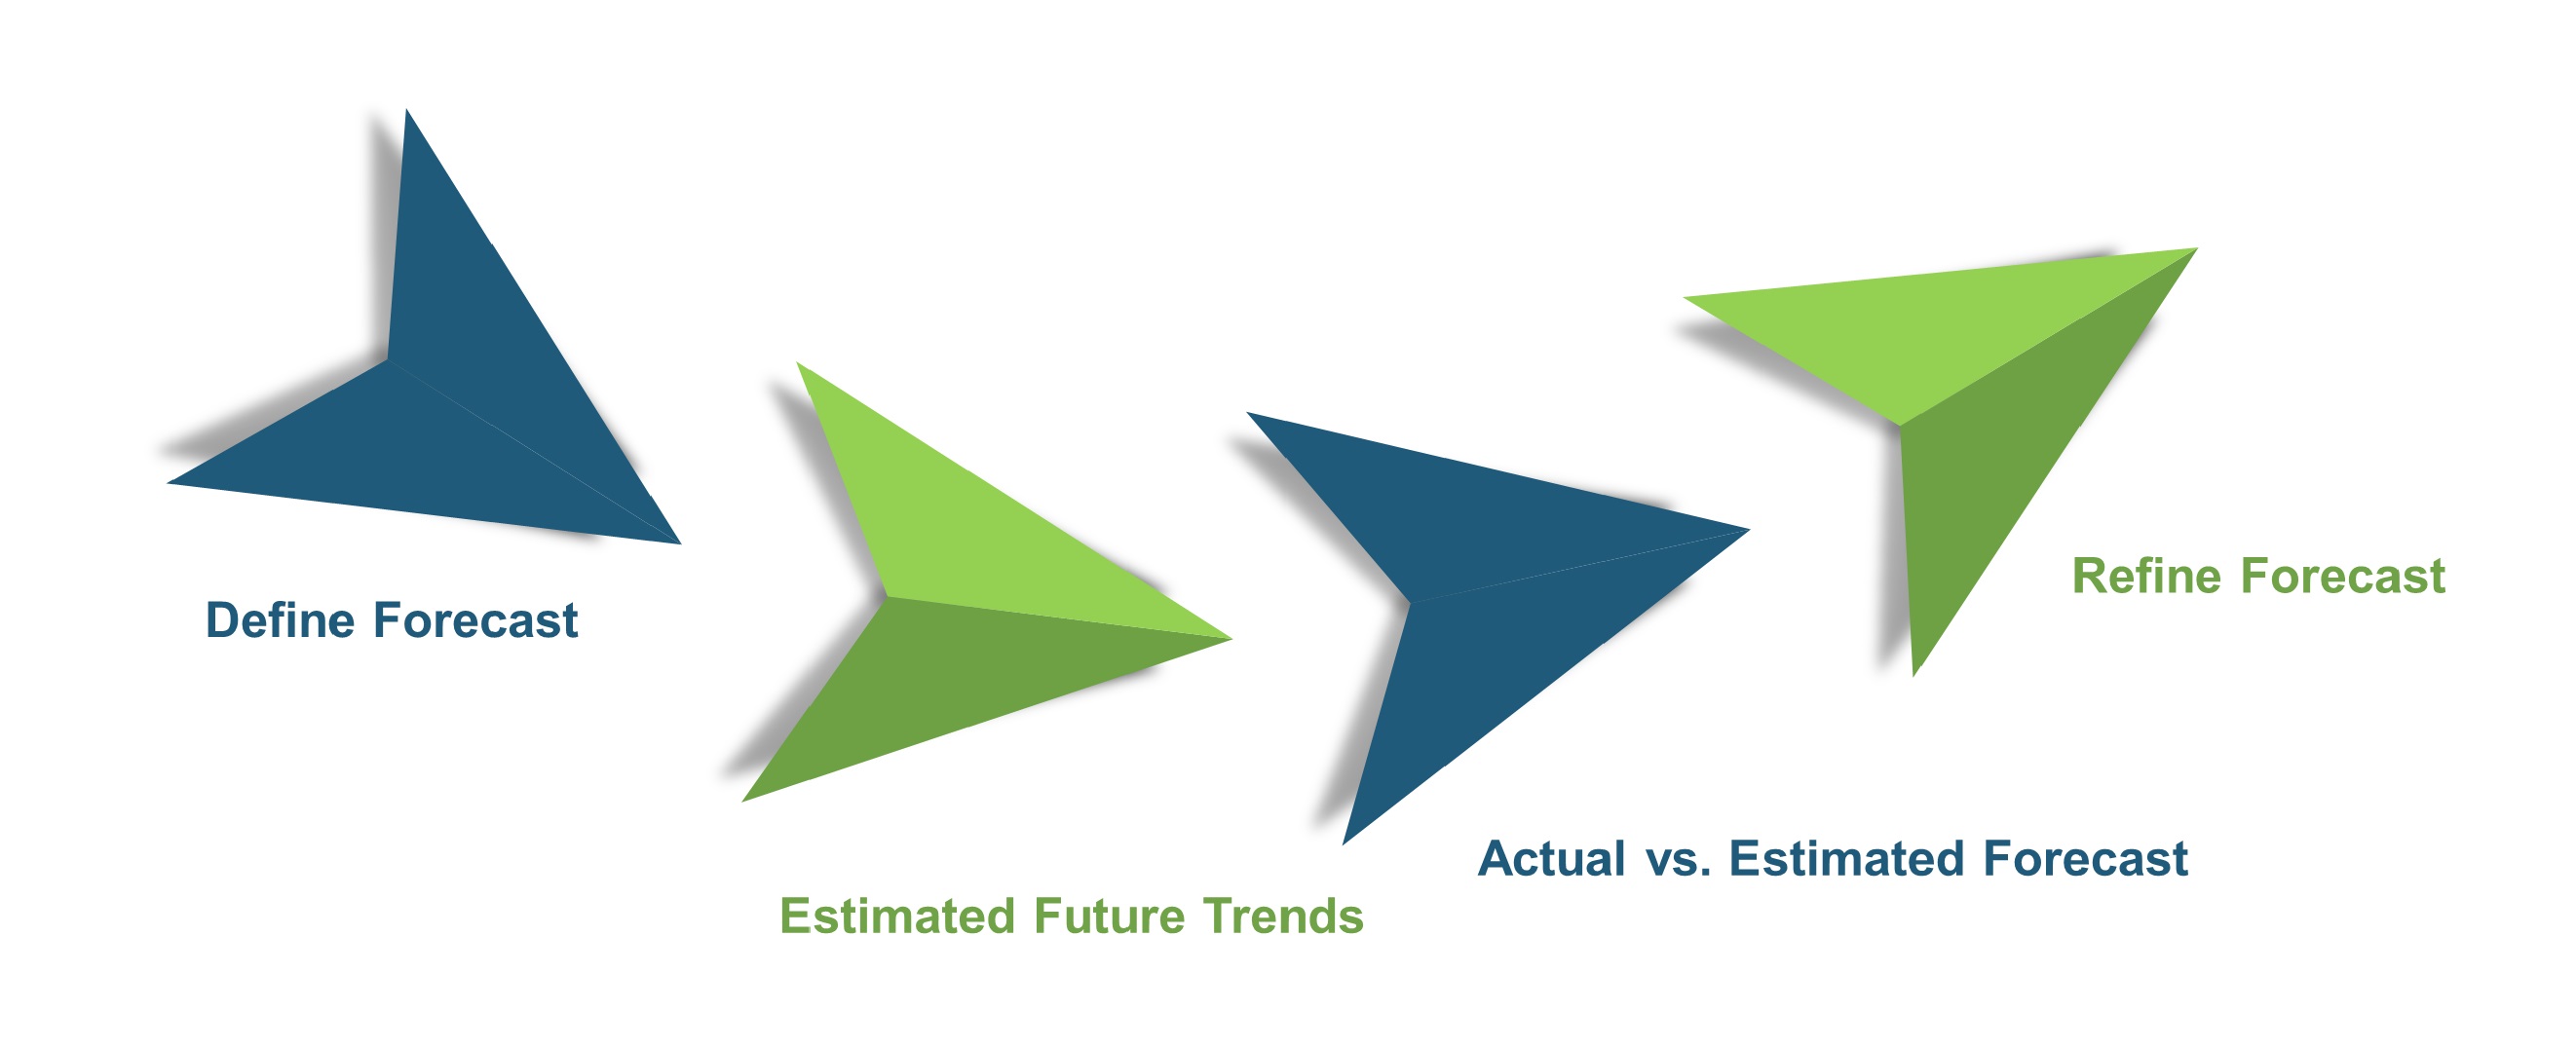
Forecasting
We utilize a forecasting model to predict future consumption by considering parameters like population, economics, regulations, market competition, drivers, constraints, technology, and pricing. We also employ statistical techniques such as multilinear regression, exponential smoothing, moving average, ARIMA, and Monte Carlo simulations for accurate predictions. In econometric forecasting, we analyzed short-term and long-term event impacts, attributing values based on regulatory frameworks, economic factors, and market events.


 Speak to Our Analyst


 Drugs Market")