LED Display Market Global Industry Analysis and Forecast (2026–2035)

LED display market size was USD 26.93 Billion in 2025, projected to reach USD 51.50 Billion by 2035, growing at a CAGR of 6.43% from 2026 to 2035. Key drivers include falling cost per pixel, digital advertising, venue upgrades, and virtual production, with Asia-Pacific leading the market.

Download Free Sample PDF
Base Year (2025)
$26.93 Billion
Forecast (2035)
$51.50 Billion
CAGR (2026-2035)
6.4%
Top Region
Asia-Pacific

What Is the LED Display Market Size?

The global LED display market was valued at USD 26.93 Billion in 2025 and is estimated at USD 29.39 Billion in 2026. It is forecast to reach USD 51.50 Billion by 2035, growing at a CAGR of 6.43% from 2026 to 2035. Asia-Pacific holds roughly 44% of revenue, and Surface-Mounted Device packaging leads with approximately a 70% share.

We observed that the leading and fastest-growing segments differ sharply across axes, as the key takeaways below show.

LED Display Market Global Industry Analysis and Forecast (2026–2035) Revenue Forecast

Values in USD Billion

2025 $26.93 Billion
2025
2026 $29.39 Billion
2026
2027 $31.28 Billion
2027
2028 $33.29 Billion
2028
2029 $35.43 Billion
2029
2030 $37.71 Billion
2030
2031 $40.13 Billion
2031
2032 $42.72 Billion
2032
2033 $45.46 Billion
2033
2034 $48.39 Billion
2034
2035 $51.50 Billion
2035

Key Takeaways

By Product Configuration: Standard Modular Flat-Panel LED Displays held the largest share in 2025, expanding from USD 14.55 Billion in 2025 to USD 23.68 Billion by 2035; Integrated All-in-One LED Displays is the fastest-growing at 12.49% CAGR from 2026–2035.

By Pixel Pitch: 2.0 mm to below 3.0 mm held the largest share in 2025, expanding from USD 5.91 Billion in 2025 to USD 11.85 Billion by 2035; Below 1.0 mm is the fastest-growing at 14.96% CAGR from 2026–2035.

By Packaging Technology: Surface-Mounted Device (SMD) held the largest share in 2025, expanding from USD 18.86 Billion in 2025 to USD 26.78 Billion by 2035; MicroLED-in-Package (MiP) is the fastest-growing at 20.66% CAGR from 2026–2035.

By Installation Environment: Indoor Deployment held the largest share in 2025, expanding from USD 14.53 Billion in 2025 to USD 26.78 Billion by 2035; Semi-Outdoor or Window-Facing Deployment is the fastest-growing at 10.19% CAGR from 2026–2035.

By Deployment Model: Permanent Fixed Installation held the largest share in 2025, expanding from USD 21.00 Billion in 2025 to USD 37.59 Billion by 2035; Mobile or Vehicle-Mounted Display is the fastest-growing at 11.39% CAGR from 2026–2035.

By Sales Channel: AV System Integrator held the largest share in 2025, expanding from USD 10.23 Billion in 2025 to USD 19.57 Billion by 2035; Rental and Staging Operator is the fastest-growing at 9.50% CAGR from 2026–2035.

By Application: Off-Premises Digital Advertising held the largest share in 2025, expanding from USD 4.84 Billion in 2025 to USD 9.27 Billion by 2035; Broadcast and Virtual Production is the fastest-growing at 11.39% CAGR from 2026–2035.

By End-User Industry: Retail and Food Service Operators held the largest share in 2025, expanding from USD 4.83 Billion in 2025 to USD 8.24 Billion by 2035; Broadcast, Media and Film Production Companies is the fastest-growing at 10.19% CAGR from 2026–2035.

Dominant Region: Asia-Pacific accounted for approximately 44% of revenue, rising from USD 11.85 Billion in 2025 to USD 24.20 Billion by 2035.

Fastest-Growing Region: Middle East & Africa is the fastest-growing region at 8.80% CAGR from 2026–2035, reaching USD 5.15 Billion by 2035.

Dominant Country: China led with USD 6.16 Billion in 2025, projected to reach USD 11.86 Billion by 2035.

Fastest-Growing Country: India is the fastest-growing country at 11.11% CAGR from 2026–2035, expanding from USD 1.07 Billion in 2025 (USD 1.22 Billion in 2026) to USD 3.15 Billion by 2035.

The LED display market offers an absolute opportunity of about USD 22.11 Billion between 2026 and 2035, which positions it as a capital allocation priority for manufacturers and investors.

Based on our analysis, we identified that the shift from SMD to COB and MiP packaging represents the primary structural evolution, as it enhances module reliability and lowers cost per pixel for sub-2.0 mm applications.

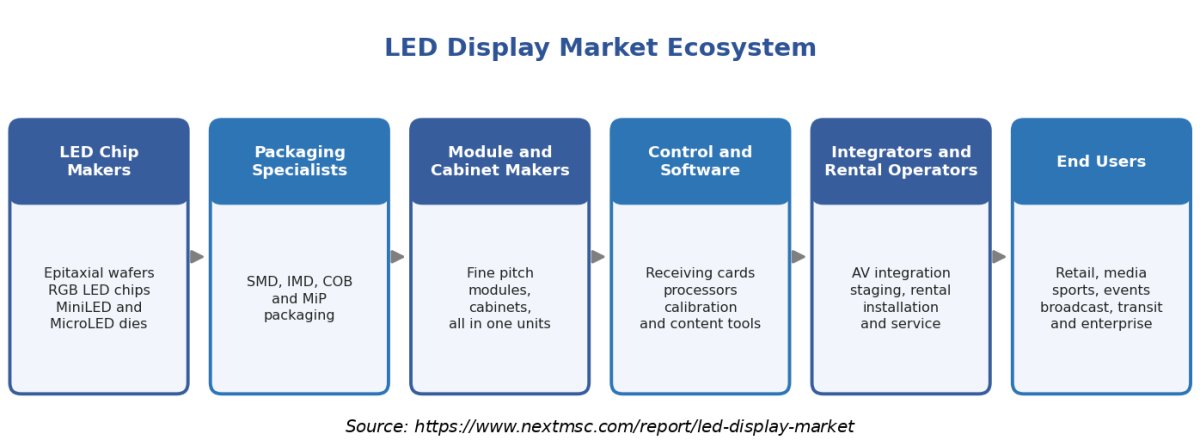
Ecosystem Analysis of the LED Display Industry

The above infographic presents the LED display market ecosystem across six tiers: LED chip makers, packaging specialists, module and cabinet manufacturers, control and software providers, integrators and rental operators, and end users. We found that value concentrates at the module and system tiers, where brand owners control pricing, warranty terms, and service contracts across multiyear deployments.

What does the LED Display Market Encompass?

The LED display market covers direct view systems that assemble light-emitting diodes into modular cabinets and integrated units for indoor, outdoor, and mixed environments. The scope includes standalone signage appliances, all-in-one displays, custom-form products, and standard modular flat panels, sold across pixel pitches from below 1.0 mm to 10.0 mm and above. LCD video walls, projectors, and general lighting products sit outside this scope.
Our findings suggest that packaging architecture now defines product tiers, with Surface-Mounted Device designs serving volume projects while Chip-on-Board, Integrated Matrix Device, and MicroLED-in-Package formats address fine pitch demand. Regulation focuses on energy efficiency and product safety. In Europe, Regulation (EU) 2019/2021 sets ecodesign requirements and Delegated Regulation (EU) 2019/2013 sets energy labelling rules for electronic displays.

Market Drivers & Dynamics

Interactive Dataset
Falling cost per pixel as COB and mass production scale driver +1.2% Global, led by Asia-Pacific 2026–2032
Digitization of retail, transit, and outdoor advertising driver +1.0% Asia-Pacific, Middle East & Africa 2026–2035
Sports venue and live event upgrades driver +0.7% North America, Europe 2026–2030
Virtual production and immersive studios driver +0.5% North America, Asia-Pacific 2026–2033
Price competition and margin pressure among vendors restraint −0.8% Global 2026–2030
Tariffs and trade barriers on display imports restraint −0.6% North America, Europe 2026–2029
Energy efficiency and ecodesign compliance cost restraint −0.4% Europe 2027–2035
Source: Next Move Strategy Consulting

Growth Drivers

What Is the Primary Growth Driver in the LED Display Industry?

Falling cost per pixel is the primary driver of the LED display market. As Chip-on-Board and MiP yields improve and large production lines scale, fine pitch modules below 2.0 mm now compete with LCD video walls in corporate and control room projects. We estimate that products below 2.0 mm generated USD 5.66 Billion in 2025, about 21% of revenue, and will reach 33% by 2035.

How Is Digital Advertising and Venue Investment Driving the Market Growth?

Off-premises digital advertising and sports venue displays together generated USD 8.07 Billion in 2025, about 30% of revenue. Daktronics reported record fiscal 2026 net sales of USD 0.84 Billion and record orders of USD 0.86 Billion, supported by Live Events wins at five of five Major League Baseball stadium installations awarded since the third quarter of fiscal 2025. These orders show that venue owners fund recurring upgrade cycles.

Growth Inhibitors

What Is Restraining the LED Display Market?

Price competition and trade friction are the main restraints. Vendors discount heavily on standard SMD modules, which compresses margins and slows reinvestment in new packaging lines. Tariff uncertainty raises landed cost for North American and European projects, while ecodesign and energy labelling rules under Regulation (EU) 2019/2021 add compliance work for suppliers entering Europe. We estimate the combined restraint at about 1.8 percentage points of CAGR.

Segmentation Analysis

2025 (USD Billion)
2035 (USD Billion)
Standalone LED Signage Appliances 2025: $5.92 Billion | 2035: $10.30 Billion
Standalone L
Integrated All-in-One LED Displays 2025: $3.50 Billion | 2035: $11.85 Billion
Integrated A
Custom-Form LED Displays 2025: $2.96 Billion | 2035: $5.67 Billion
Custom-Form
Standard Modular Flat-Panel LED Displays 2025: $14.55 Billion | 2035: $23.68 Billion
Standard Mod
Standalone LED Signage Appliances $5.92 Billion $10.30 Billion 5.41%
Integrated All-in-One LED Displays $3.50 Billion $11.85 Billion 12.49%
Custom-Form LED Displays $2.96 Billion $5.67 Billion 6.45%
Standard Modular Flat-Panel LED Displays $14.55 Billion $23.68 Billion 4.72%

Which Product Configuration Leads the LED Display Market and Which Is Growing Fastest?

Standard Modular Flat-Panel LED Displays led in 2025 with USD 14.55 Billion, because rental, venue, and corporate projects favor serviceable cabinets that scale to any screen size. Integrated All-in-One LED Displays are the fastest-growing configuration, growing from USD 3.50 Billion in 2025 and advancing from USD 4.11 Billion in 2026 to USD 11.85 Billion by 2035. Standalone signage appliances grow at 5.41% in retail and food service, while custom form products grow at 6.45% in architectural and experiential projects.

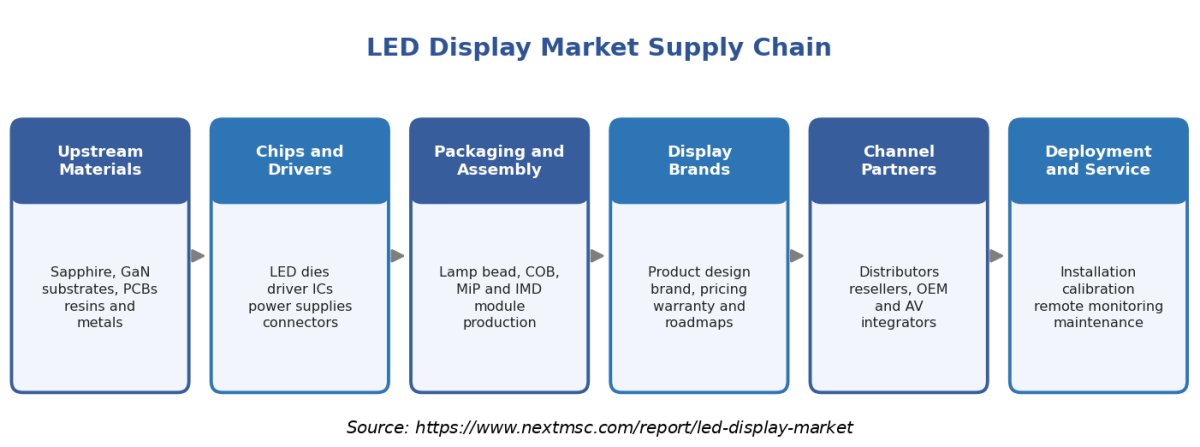
Supply Chain Analysis of the LED Display Industry

Supply Chain Analysis of the LED Display Industry
The above infographic maps the LED display market supply chain across chip suppliers, driver IC and component vendors, packaging houses, module and cabinet assemblers, system brands, and channel partners. Our findings suggest that margin pools sit with brands that own calibration, control software, and service, while upstream chip suppliers face the most price pressure.

Growth Opportunities

Our analysis shows that three whitespace opportunities can lift revenue above the 6.43% market average.

Can Semi Outdoor and Window Facing Displays Become a Distinct Volume Segment?

Semi-outdoor and window-facing deployments grow at a 10.19% CAGR from 2026 to 2035, rising from USD 2.15 Billion to USD 5.15 Billion. Retailers, banks, and hotels benefit first, because they can replace printed window graphics with programmable content. Vendors that pair high-brightness cabinets with transparent smart displays also gain access to architectural budgets.

Can Integrated All-in-One Displays Open the Midsize Business Buyer Base?

Integrated displays remove the need for specialist installers, which opens corporate and education buyers that previously chose LCD panels or interactive displays. The segment rises from USD 4.11 Billion in 2026 to USD 11.85 Billion by 2035. Distributors and resellers gain a simpler product to stock, and vendors earn recurring revenue from content management and service plans.

Can Rental and Service Models Convert Hardware Sales Into Recurring Revenue?

Rental and staging operators grow at a 9.50% CAGR from 2026 to 2035, reaching USD 6.18 Billion by 2035. Manufacturers that finance cabinets, calibrate screens, and supply technicians through rental partners earn revenue on each deployment day rather than once at sale. Event producers, sports organizations, and touring productions benefit from lower upfront cost.

Regional Outlook

2025 (USD Billion)
2035 (USD Billion)
North Americ
Europe
Asia-Pacific
Middle East
Latin Americ
Region 2025 (USD Billion) 2035 (USD Billion) CAGR (%)
North America $10.0 USD Billion $40.0 USD Billion 9.0%
Europe $17.1 USD Billion $51.1 USD Billion 27.0%
Asia-Pacific $24.2 USD Billion $62.2 USD Billion 25.0%
Middle East & Africa $31.3 USD Billion $73.3 USD Billion 23.0%
Latin America $38.4 USD Billion $84.4 USD Billion 12.0%

Regional data is locked

Unlock complete regional numbers for this market.

Unlock Full Data

Competitive Landscape

Our assessment indicates that competition is shaped by scale manufacturing, premium brand positioning, and service depth.

Dimension Description
Market Structure Moderately fragmented, with Chinese scale leaders competing against Korean, Japanese, U.S., and European brands across price tiers.
Innovation Focus COB and MiP packaging, Micro LED lines, calibration software, and integrated all-in-one formats.
M&A Activity Selective, with deals aimed at service capacity, software, and regional distribution rather than broad consolidation.

How Do Companies Compete in the LED Display Industry?

Competition runs on three levers: price per square meter, product reliability, and service coverage. Chinese manufacturers use scale and vertical integration to win volume projects, while Samsung Electronics, LG Electronics, and Sony Corporation defend premium pricing through brand and image quality. Daktronics competes in North America with installation and maintenance services, and OLED panels challenge premium indoor use. Geographic expansion into the Middle East, Southeast Asia, and Latin America is a priority as home markets mature.

Which Competitor Archetypes Dominate the Market?

Four archetypes dominate: volume manufacturers such as Unilumin Group and Absen Optoelectronic, premium electronics brands such as Samsung and LG, venue specialists such as Daktronics, and professional AV brands such as Barco and Christie. Differentiation themes include cost leadership, color quality, integrated service, and application expertise. Our findings suggest that the archetypes converge as volume players add premium lines and brands add rental and service offers.

What Innovation and Differentiation Strategies Are Companies Using?

Innovation concentrates on packaging, calibration, and installation simplicity. LG Electronics introduced the 2026 LG MAGNIT with a full black coating and front access alignment, and Samsung Electronics won multiple awards at ISE 2026. Vendors also invest in control software and energy management to lower operating costs and support recurring service revenue. Pricing strategy increasingly pairs hardware with service contracts instead of discounting alone.

What Is the M&A Activity in the LED Display Industry?

Our assessment indicates that merger and acquisition activity is selective, with deals aimed at service networks, software, and regional distribution rather than broad consolidation. Larger vendors prefer joint ventures and local partnerships to enter regional markets, which reduces capital at risk. Margin pressure at several large producers raises the likelihood of portfolio pruning, and professional AV groups can buy niche specialists to extend application reach.

Key Market Players

Our findings suggest that the following 20 companies lead supply in the LED display market in 2026.

Unilumin Group Co., Ltd. Leyard Optoelectronic Co., Ltd. Shenzhen Absen Optoelectronic Co., Ltd. Samsung Electronics Co., Ltd. LG Electronics Inc. Daktronics, Inc. Shenzhen AOTO Electronics Co., Ltd. Shenzhen LianTronics Co., Ltd. Shenzhen Ledman Optoelectronic Co., Ltd. Shenzhen INFiLED Electronics Co., Ltd. Shanghai Sansi Electronic Engineering Co., Ltd. Desay Optoelectronics GLOSHINE Lightking Hunan YES TECH Optoelectronic Co., Ltd. Yaham Optoelectronics Co., Ltd. Barco NV Christie Digital Systems USA, Inc. Sony Corporation Lighthouse Technologies Limited

Latest Developments

We observed that product launches, record order books, and regulatory reviews defined the market across 2025 and 2026.

Date Event
March 2026 LG Electronics USA made the 2026 LG MAGNIT Micro LED display available in the United States for premium commercial and luxury residential spaces.
February 2026 Samsung Electronics announced record awards and category wins at ISE 2026, led by six spatial signage wins.
January 2026 LG Electronics announced the new LG MAGNIT Micro LED display, model LMPB, for showcase at ISE 2026 in Barcelona from 3 to 6 February.

Expert Insights

Tae-yong Son

Tae-yong Son

Vice President, MICRO LED Team, Visual Display Business | Samsung Electronics

"“The display market is constantly evolving and new technologies often take time to find their footing. As we continue to innovate and drive down production costs, MICRO LED technology will become more accessible to a broader consumer base”"

Analyst Interpretation

The statement highlights the importance of reducing manufacturing costs to accelerate MicroLED adoption beyond premium display applications. Improvements in production efficiency and manufacturing yields can lower price barriers and expand commercial opportunities across consumer electronics, digital signage, and professional displays. However, wider adoption depends on technological advancements, reliable production processes, and commercially competitive pricing.

Investment Opportunities

Where Is Capital Flowing in the LED Display Market?

Capital is moving toward Chip-on-Board and MicroLED-in-Package lines, rental fleets, and regional assembly sites. The first two technologies grow at 13.74% and 20.66% CAGR from 2026 to 2035, and rental and staging operators grow at 9.50%, all above the 6.43% market average. Investors should favor vendors with positive cash conversion and a diversified application mix, because project timing and price competition create earnings volatility.

Which Infrastructure Investments Support Market Expansion?

Public and private infrastructure programs create the base for demand, including stadium renovations, airport and rail upgrades, and broadcast studio build-outs. Transportation passenger information is projected at USD 3.60 Billion by 2035, and sports venue displays at USD 6.18 Billion. Suppliers that bundle installation, remote monitoring, and maintenance gain from multi-year service contracts tied to this infrastructure.

How Do ESG Considerations Influence LED Display Investment?

Energy use, product life, and end-of-life handling now influence procurement. European ecodesign and energy labelling rules for electronic displays push suppliers to document efficiency, and the Commission review launched in December 2023 signals closer scrutiny. Buyers prefer long service life, repairable modules, and efficient power supplies, so suppliers that design for repair and recycling can lower lifetime cost and strengthen tender eligibility.

Key Benefits for Stakeholders

How Does the Report Help Display Manufacturers and Technology Vendors?

Manufacturers gain segment-level forecasts by pixel pitch, packaging technology, and application, which show where to direct capital. The analysis shows that products below 2.0 mm reach USD 16.99 Billion by 2035 and that MiP grows at a 20.66% CAGR. Product teams can use competitive archetypes and recent launches to position roadmaps against Samsung, LG, and leading Chinese vendors.

How Does the Report Help Investors and Financial Analysts?

Investors receive reconciled 2025, 2026, and 2035 values with a 6.43% CAGR, regional and country projections, and an absolute opportunity of USD 22.11 Billion. The driver and restraint matrix quantifies each factor's effect on CAGR, which supports scenario work. Latest developments and company profiles help screen listed suppliers by order momentum and margin resilience.

How Does the Report Help Integrators, Rental Operators, and End Users?

Integrators and rental operators can see how channel mix shifts, with rental and staging growing at a 9.50% CAGR. End users such as retailers, venue owners, and broadcasters gain guidance on pixel pitch selection, packaging reliability, and deployment model. The analysis also highlights regional demand differences that affect pricing and delivery planning.

Key Market Segments Evaluated

By Product Configuration

  • LED Display Systems 
    • Standalone LED Signage Appliances
      • Poster-Style LED Displays
      • Enclosed LED Signage Units
      • Other Standalone LED Signs
    • Integrated All-in-One LED Displays
    • Custom-Form LED Displays
    • Standard Modular Flat-Panel LED Displays

By Pixel Pitch

  • Below 1.0 mm
  • 1.0 mm to below 2.0 mm
  • 2.0 mm to below 3.0 mm
  • 3.0 mm to below 5.0 mm
  • 5.0 mm to below 10.0 mm
  • 10.0 mm and Above

By Packaging Technology

  • MicroLED-in-Package (MiP)
  • Integrated Matrix Device (IMD)
  • Chip-on-Board (COB)
  • Surface-Mounted Device (SMD)
  • Others

By Installation Environment

  • Indoor Deployment
  • Outdoor Deployment
  • Semi-Outdoor or Window-Facing Deployment
  • Mixed-Environment Project
  • Other Documented Environment

By Deployment Model

  • Permanent Fixed Installation
  • Temporary Event Installation
  • Mobile or Vehicle-Mounted Display

By Sales Channel

  • Direct End-User Sale
  • Distributor or Reseller
  • AV System Integrator
  • Rental and Staging Operator
  • OEM or Private-Label Buyer
  • Other Identified Business Buyer

By Application

  • On-Premises Advertising and Promotion
  • Off-Premises Digital Advertising
  • Public Information and Wayfinding
  • Transportation Passenger Information
  • Sports Scoring and Venue Displays
  • Live Events and Stage Presentation
  • Broadcast and Virtual Production
  • Monitoring and Command
  • Other Applications

By End-User Industry

  • Retail and Food Service Operators
  • Sports Organizations
  • Event Producers
  • Corporate Enterprises and Professional Services
  • Education and Research Institutions
  • Government and Public-Sector Agencies
  • Healthcare Providers
  • Industrial, Manufacturing and Utility Operators
  • Cinema, Leisure and Cultural Venue Operators
  • Other End-User Industries

By Region

  • North America 
    • U.S.
    • Canada
    • Mexico
  • Europe 
    • UK
    • Germany
    • France
    • Italy
    • Spain
    • Sweden
    • Denmark
    • Finland
    • Netherlands
    • Rest of Europe
  • Asia-Pacific 
    • China
    • India
    • Japan
    • South Korea
    • Taiwan
    • Indonesia
    • Vietnam
    • Australia
    • Philippines
    • Malaysia
    • Rest of APAC
  • Middle East & Africa 
    • Saudi Arabia
    • UAE
    • Egypt
    • Israel
    • Turkey
    • Nigeria
    • South Africa
    • Rest of MEA
  • Latin America 
    • Brazil
    • Argentina
    • Chile
    • Colombia
    • Rest of LATAM

Conclusion & Recommendations

What Is the Long-Term Outlook for the LED Display Market?

The LED display market is projected to rise from USD 29.39 Billion in 2026 to USD 51.50 Billion by 2035 at a 6.43% CAGR. Growth is broad-based, with Asia-Pacific contributing the largest absolute gain and Middle East & Africa growing fastest at 8.80%. Our assessment indicates that pixel pitch compression and packaging upgrades sustain value per square meter even as unit prices fall.

What Strategic Positioning Recommendations Does NMSC Offer?

Vendors should prioritize Chip-on-Board and MicroLED-in-Package capacity, build service and software revenue around installed bases, and enter semi-outdoor and rental channels before price competition matures there. Integrators should standardize on products with strong calibration support, while buyers should specify pixel pitch by viewing distance rather than headline resolution, which protects budgets and image quality.

How Strong Is the Investment Attractiveness of the LED Display Market?

Investment attractiveness is moderate to strong. Revenue grows steadily, and USD 22.11 Billion of new demand accumulates between 2026 and 2035. Returns depend on pricing discipline, because volume suppliers report thin margins while premium and service-oriented vendors hold better profitability. Investors should weigh technology leadership and cash conversion above shipment area.

What Are the Market Shifts and Key Risks in the LED Display Market?

Key shifts include migration from SMD to COB and MiP, growth of integrated formats, and rising demand from broadcast and virtual production. Key risks include price competition, tariff exposure, project timing, and changing energy efficiency rules in Europe. Suppliers that diversify across regions and applications can absorb these risks more easily.

What Are the Primary Growth Pathways Through 2035?

Growth pathways include fine pitch products below 2.0 mm, which reach USD 16.99 Billion by 2035, semi-outdoor deployments, integrated displays, and rental and staging services. Regional pathways favor India at 11.11% CAGR and Saudi Arabia at 10.42% CAGR, where infrastructure programs, tourism investment, and local assembly create new demand for fine pitch and outdoor products.

Delivered Customizations

We have successfully delivered the following deep-dive customizations:

Client Request Customization Delivered Value Adds
Historical Market Growth Analysis
  • Historical LED display revenue and shipment analysis across indoor, outdoor, rental, and transparent product configurations.
  • Identifies which configurations are gaining or losing share, guiding product portfolio and capacity priorities.
Company-Level Configuration Share Analysis
  • Company-wise revenue and shipment share by LED display product configuration, benchmarked against key global suppliers.
  • Highlights competitor strength by configuration, supporting positioning and targeted product investment decisions.
Configuration-Level Trade Assessment
  • Country-wise import and export analysis of LED display modules and finished displays by configuration-relevant trade codes.
  • Reveals sourcing concentration and export hubs, supporting supply chain risk management and market entry planning.
Pixel-Pitch Application Adoption Mapping
  • Mapping of fine-pitch and standard-pitch LED configurations against control room, broadcast, retail, and public venue applications.
  • Shows where fine-pitch demand is expanding, helping prioritize high-margin indoor product development and sales focus.
Rental LED Fleet Utilization Benchmarking
  • Benchmarking of rental LED display fleet size, deployment, and utilization across event, concert, and sports applications where disclosed.
  • Informs rental versus purchase strategy and fleet investment timing for rental-led configuration offerings.
Municipal Digital Signage Deployment Assessment
  • Assessment of outdoor LED configuration deployment against municipal digital signage regulations and public tender activity.
  • Identifies regulatory-approved outdoor opportunities and permitting constraints, supporting market entry and bid prioritization.

FAQs

Sources & References

1.

Daktronics, Inc. Investor Relations: Fourth Quarter and Full Fiscal Year 2026 Results

investor.daktronics.com
2.

U.S. Securities and Exchange Commission: Daktronics Form 8-K, Exhibit 99.1, June 2026

sec.gov
3.

Daktronics, Inc. Investor Relations: 2026 Fiscal Third Quarter Results

investor.daktronics.com
4.

LG Electronics: LG MAGNIT Micro LED Display at ISE 2026

lg.com
5.

LG Electronics USA: 2026 LG MAGNIT Press Release, March 31, 2026

lg.com
6.

Samsung Newsroom U.S.: The Wall All-In-One and ISE 2026 Releases

news.samsung.com
7.

European Commission, Directorate-General for Energy: Public Consultation on Electronic Displays

energy.ec.europa.eu
8.

European Commission: Ecodesign and Energy Labelling Review for Electronic Displays

energy-efficient-products.ec.europa.eu
9.

EUR-Lex: Commission Regulation (EU) 2019/2021 on Ecodesign Requirements for Electronic Displays

eur-lex.europa.eu

About the Author

Mayurima Roy

Mayurima Roy

Mayurima Roy is Research Analyst at Next Move Strategy Consulting, where she has spent 4 years working across the firm's full industry coverage rather than a single fixed vertical. Her work centers on structured research, ongoing trend tracking, competitive assessment, and insight-led content development, translating complex market data into clear, decision-ready narratives that support informed client decision-making across diverse global industries, market sectors, and world regions every day.

About the Reviewer

Supradip Baul

Supradip Baul

Supradip Baul is an accomplished business consultant and strategist with over a decade of rich experience in market intelligence, strategy, technology, and business transformation. His work has included rigorous qualitative and quantitative analysis across multiple industries, helping clients shape investment decisions and long-term roadmaps. Earlier in his career, he was associated with Gartner, where he contributed to industry-leading reports and market share analyses. He has worked with leading global companies and holds an MBA with a dual specialization in Marketing and Finance.

Download Free Sample

Kishu Kanda

KISHU KANDA

Strategy Analyst

Accenture

We purchased the AI Consumer Market Report from this company. Not only did they customize the report to meet our specific requirements, but they also showed great flexibility in accommodating our budget. The report we received fully met our expectations. Additionally, they provided prompt and thorough responses to both our pre-purchase and follow-up questions. We look forward to working with this company again in the future.

Rishabh Jogani

RISHABH JOGANI

Strategy Analyst

Accenture Japan

We are incredibly impressed with the market report on the real estate market in India provided by Next Move Strategy Consulting. The report was thorough, insightful, and well-structured, offering deep analysis and actionable recommendations. It not only captured the current trends and dynamics but also provided a forward-looking perspective that has been invaluable for our strategic planning. Their team demonstrated exceptional professionalism, attention to detail, and a profound understanding of the industry. The data-driven insights and clarity of presentation exceeded our expectations, making complex market trends easy to understand. We highly recommend Next Move Strategy Consulting to anyone looking for reliable and comprehensive market research services. Their expertise has given us the confidence to navigate the complexities of the Indian real estate market with clarity and foresight.

Amos Chang

AMOS CHANG

Strategy Consultant

Kardex Group

I have bought the intralogistics market reports from NMSC two times so far. Joseph and his team are always very helpful and flexible in responding to any customization requirements on the report. Their expertise in market reports really helps us steer the day-to-day business. I will definitely recommend and come back myself whenever there is a need.

Semih Kavaklioglu

SEMIH KAVAKLIOGLU

Co-Founder & Sales Manager

Decortie

I work a lot in the marketing industry and I know that research is an essential part of any campaign. I have used Market research reports for my own products and I found them to be very informative and well-researched. The team here produces insightful reports for a good price

Ross J Mckenzie

ROSS J MCKENZIE

Business Insight Manager

Staysure Group

“Next MSC have been incredibly helpful in providing detailed & robust information on our market, alongside quantifying growth by different segments. The process to procure was simple and easy, with sample reports and regular contact to ensure we had what we needed. Succinct detail on their sources & methodologies is also greatly received, allowing transparency in this respect helps build trust in the detail you pay for. Joseph in particular was fantastic, and helped ensure efficient provision of the insight pack – thank you NMSC!”.

Custom Market Research Services

We will customize the research for you if the listed report does not fully match your requirements.

Get 30% Free Customization

Select License

This website uses cookies to ensure you get the best experience on our website. Learn more

✖