Smart Home Display Market Global Industry Analysis and Forecast (2026–2035)

Smart Home Display Market size was USD 3.50 Billion in 2025, projected to reach USD 5.30 Billion by 2035, growing at a CAGR of 4.13% from 2026 to 2035. Key drivers include smart home ecosystem expansion and Amazon and Google platform growth, rising builder-installed home control panel adoption, and growing demand for professional automation displays, with North America leading the market.

Download Free Sample PDF
Base Year (2025)
$3.50 Billion
Forecast (2035)
$5.30 Billion
CAGR (2026-2035)
4.1%
Top Country
North America

What Is the Smart Home Display Market Size?

The global Smart Home Display Market reached USD 3.50 Billion in 2025 and is estimated at USD 3.68 Billion in 2026, projected to reach USD 5.30 Billion by 2035 at a CAGR of 4.13% from 2026 to 2035. North America leads with approximately 40% revenue share, while Assistant Displays dominate the primary purchase purpose segment with approximately 54% share in 2025.

We observed that the expansion of Amazon Alexa and Google Home voice assistant ecosystems into dedicated smart displays, combined with growing builder and developer integration of home control panels in new residential construction, is creating sustained demand across the Assistant Displays, Home Control Panels, and Security Command Panels product categories throughout the forecast period.

Smart Home Display Market Global Industry Analysis and Forecast (2026–2035) Revenue Forecast

Values in USD Billion

2025 $3.50 Billion
2025
2026 $3.68 Billion
2026
2027 $3.83 Billion
2027
2028 $3.99 Billion
2028
2029 $4.16 Billion
2029
2030 $4.33 Billion
2030
2031 $4.51 Billion
2031
2032 $4.69 Billion
2032
2033 $4.89 Billion
2033
2034 $5.09 Billion
2034
2035 $5.30 Billion
2035

Key Takeaways

By Primary Purchase Purpose: Assistant Displays led at USD 1.89 Billion in 2025 to USD 2.49 Billion by 2035; Security Command Panels is the fastest-growing sub-segment at 6.34% CAGR from 2026–2035.

By Screen Size: 7 to Under 11 Inches led at USD 1.68 Billion in 2025 to USD 2.33 Billion by 2035; Above 15 Inches is the fastest-growing sub-segment at 7.30% CAGR from 2026–2035.

By Display Technology: LCD led at USD 1.75 Billion in 2025 to USD 1.96 Billion by 2035; Direct-View LED is the fastest-growing sub-segment at 7.93% CAGR from 2026–2035.

By Form Factor: Tabletop led at USD 2.10 Billion in 2025 to USD 2.97 Billion by 2035; In-Wall is the fastest-growing sub-segment at 6.85% CAGR from 2026–2035.

By Primary Control Ecosystem: Amazon Alexa led with the largest installed base; Multi-Ecosystem is the fastest-growing segment as Matter protocol adoption enables cross-platform interoperability.

By First Commercial Buyer: Consumer led with approximately 65% share in 2025; Professional Integrator is the fastest-growing buyer category driven by luxury residential smart home installations.

By Primary Sales Channel: Retailer led with approximately 40% share in 2025; Professional Dealer or Integrator is the fastest-growing channel driven by custom installation program expansion.

Dominant Region: North America dominated with approximately 40% revenue share in 2025.

Fastest-Growing Region: Asia-Pacific is expected to register the highest CAGR of 5.35% from 2026–2035.

Dominant Country: The U.S. led with approximately USD 1.19 Billion in 2025.

Fastest-Growing Country: India is the fastest-growing country, expanding at approximately 6.72% CAGR from 2026–2035.

The Smart Home Display Market presents an absolute opportunity of approximately USD 1.62 Billion between 2026 and 2035, representing the difference between the 2035 forecast of USD 5.30 Billion and the 2026 base of USD 3.68 Billion, positioning platform-linked hardware vendors, professional installation channel participants, and in-wall smart display specialists as primary beneficiaries.

According to NMSC analysis, the Matter open connectivity protocol's rapid adoption across Amazon, Google, Apple, and third-party device manufacturers is creating a structural tailwind for multi-ecosystem displays that operate across competing smart home platforms, which could progressively erode single-ecosystem platform lock-in and reshape the competitive dynamics of the Smart Home Display Industry through 2035.

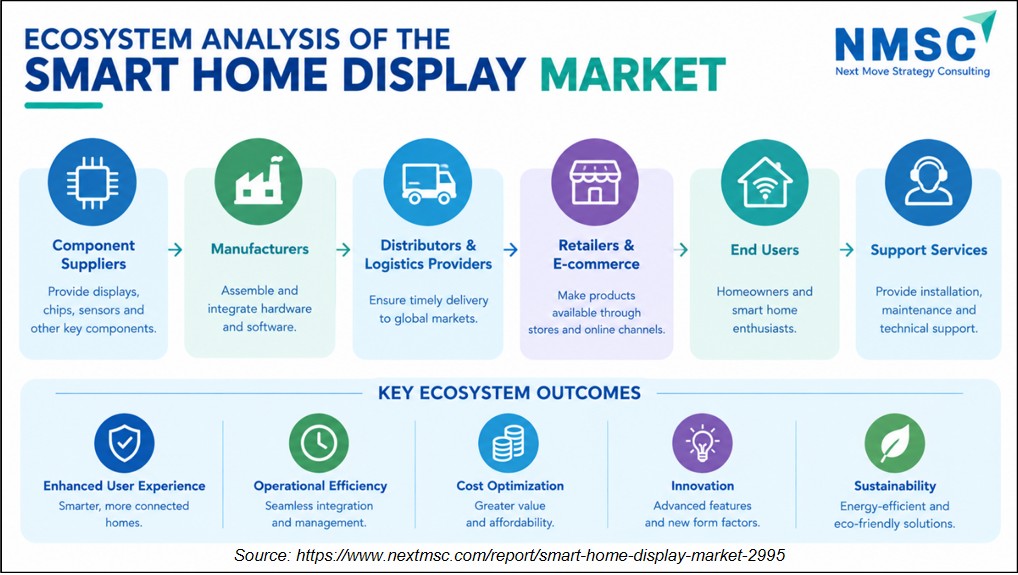
Ecosystem Analysis of the Smart Home Display Industry

The above infographic presents the Smart Home Display Market ecosystem by connecting component suppliers, manufacturers, distributors and logistics providers, retailers and e-commerce channels, end users, and support services. It highlights how these participants collectively enable connected home solutions while supporting enhanced user experiences, operational efficiency, cost optimization, technological innovation, and sustainable smart-home adoption .

What Does the Smart Home Display Market Encompass?

The Smart Home Display Market covers dedicated screen-based devices installed within residential environments to serve as assistant interfaces, home control panels, and security command panels . Product categories include tabletop assistant displays such as the Amazon Echo Show and Google Nest Hub series, surface-mounted and in-wall home control panels running professional automation software, and multi-function security-linked displays combining camera feeds, intercom, and alarm management interfaces. The market excludes general-purpose tablets and smartphones, even when used in smart home contexts, and focuses exclusively on purpose-built devices designed for permanent or semi-permanent residential installation.
The market has evolved from simple smart speaker companions with screens into a structurally differentiated product category spanning consumer-priced assistant displays retailing below USD 250, mid-range home control panels sold through builder and distributor channels, and premium professional automation touch panels installed by certified integrators. Energy efficiency standards such as the European Union Energy Labelling Regulation and U.S. Energy Star certification requirements increasingly shape display standby power consumption specifications, while Matter protocol standardization is reducing ecosystem fragmentation across previously isolated proprietary platforms.

Market Drivers & Dynamics

Interactive Dataset
Smart home ecosystem expansion and Amazon/Google Assistant Display platform investment driver +1.20% North America, Europe 2026–2035
Builder and developer pre-installation of smart displays in new residential construction driver +0.90% North America, Asia-Pacific 2026–2033
Professional home automation platform growth driving Security and Control Panel demand driver +0.75% Europe, North America 2026–2035
Energy management regulation and smart building standards driving In-Wall display adoption driver +0.55% Europe, Asia-Pacific 2026–2032
Display technology price deflation expanding mid-market smart display volume driver +0.45% Global 2026–2031
Smartphone and tablet serving as smart home display substitute, reducing standalone demand restraint −0.80% Global 2026–2030
Platform ecosystem fragmentation between Amazon, Google, Apple, and Chinese vendors restraint −0.60% North America, Asia-Pacific 2026–2033
Consumer privacy concerns limiting always-on camera-enabled display adoption restraint −0.45% Europe, North America 2026–2031
Consumer spending sensitivity limiting discretionary smart home hardware investment restraint −0.30% Global 2026–2029
Source: Next Move Strategy Consulting

Growth Drivers

What Is the Primary Growth Driver in the Smart Home Display Market?

The primary growth driver in the Smart Home Display Market is the sustained investment by Amazon and Google in expanding their smart display product lines, which has established the Assistant Display category as a mass-market consumer product segment in North America and Europe. The U.S. Census Bureau reported approximately 1.36 million new single-family housing units completed in 2024, many of which represent addressable installation opportunities for builder-integrated smart displays as residential new construction amenity packages expand. Industry-derived estimates indicate that Amazon Echo Show and Google Nest Hub combined account for the majority of global assistant display unit volume, anchoring the LCD display technology segment's dominant revenue position through the mid-period of the forecast.

How Is Professional Home Automation Driving Market Growth?

Our analysis shows that professional home automation adoption is driving the Home Control Panel and Security Command Panel purchase purpose segments, as luxury residential projects and multi-unit residential developments increasingly specify dedicated hardware control interfaces as a project amenity. The U.S. Department of Energy's Building Technologies Office reports sustained investment in smart building and smart home technology programs that incentivize connected device adoption, including energy management displays. Crestron, Savant, and Johnson Controls collectively drive significant professional installation channel revenue, with average installed unit values substantially higher than consumer-retail assistant displays.

Growth Inhibitors

What Is Restraining the Smart Home Display Market?

Smartphone-based smart home control constitutes the primary restraint on themarket, as the widespread availability of high-quality Amazon Alexa, Google Home, and Apple Home mobile applications reduces the incremental value proposition of a dedicated standalone display for a significant portion of the smart home-adopter population. Our findings suggest that smartphone-first smart home users find voice and touch control through their existing devices sufficient for most automation interactions, limiting the additional revenue generated from discrete smart display hardware purchases. This restraint is particularly pronounced in urban apartment markets where space constraints also limit large-format tabletop or in-wall display installations.

Segmentation Analysis

2025 (USD Billion)
2035 (USD Billion)
Assistant Di
Home Control
Security Com
Segment Item 2025 (USD Billion) 2035 (USD Billion) CAGR
Assistant Displays $10.0 USD Billion $40.0 USD Billion 14.0%
Home Control Panels $17.1 USD Billion $51.1 USD Billion 8.0%
Security Command Panels $24.2 USD Billion $62.2 USD Billion 14.0%

Segment-wise data is locked

Unlock complete segment-wise numbers for By Primary Purchase Purpose.

Unlock Full Data

Which Primary Purchase Purpose Segment Leads the Market?

Assistant Displays lead the Smart Home Display Market at USD 1.89 Billion in 2025, expanding to USD 2.49 Billion by 2035, reflecting the large installed base of Amazon Echo Show and Google Nest Hub devices across U.S. and European households. Security Command Panels is the fastest-growing sub-segment at a 6.34% CAGR from 2026 to 2035, driven by the integration of camera, doorbell, alarm, and visitor management interfaces within smart displays , replacing dedicated single-function security panels in mid-market and luxury residential installations where unified security and home control interfaces are increasingly specified by security service providers and professional integrators.

2025 (USD Billion)
2035 (USD Billion)
Under 7 Inch
7 to Under 1
11 to 15 Inc
Above 15 Inc
Segment Item 2025 (USD Billion) 2035 (USD Billion) CAGR
Under 7 Inches $10.0 USD Billion $40.0 USD Billion 25.0%
7 to Under 11 Inches $17.1 USD Billion $51.1 USD Billion 11.0%
11 to 15 Inches $24.2 USD Billion $62.2 USD Billion 25.0%
Above 15 Inches $31.3 USD Billion $73.3 USD Billion 11.0%

Segment-wise data is locked

Unlock complete segment-wise numbers for By Screen Size.

Unlock Full Data
2025 (USD Billion)
2035 (USD Billion)
LCD
OLED
E-Paper
Direct-View
Others
Segment Item 2025 (USD Billion) 2035 (USD Billion) CAGR
LCD $10.0 USD Billion $40.0 USD Billion 27.0%
OLED $17.1 USD Billion $51.1 USD Billion 9.0%
E-Paper $24.2 USD Billion $62.2 USD Billion 19.0%
Direct-View LED $31.3 USD Billion $73.3 USD Billion 17.0%
Others $38.4 USD Billion $84.4 USD Billion 18.0%

Segment-wise data is locked

Unlock complete segment-wise numbers for By Display Technology.

Unlock Full Data

Which Display Technology Dominates and Which Is Growing Fastest?

LCD dominates the display technology segment at USD 1.75 Billion in 2025, driven by its cost advantage and established supply chain across the consumer-priced Assistant Display category. Direct-View LED is the fastest-growing display technology at a 7.93% CAGR from 2026 to 2035, driven by its thinness, energy efficiency, and premium visual quality in large-format in-wall and surface-mounted home control panel applications. E-Paper follows closely at 7.64% CAGR, with its always-on low-power characteristic making it particularly well suited for in-wall home control panels in energy-conscious markets where near-zero display standby power consumption is a specification requirement aligned with EU energy labelling standards.

2025 (USD Billion)
2035 (USD Billion)
Tabletop
Surface-Moun
In-Wall
Segment Item 2025 (USD Billion) 2035 (USD Billion) CAGR
Tabletop $10.0 USD Billion $40.0 USD Billion 14.0%
Surface-Mounted $17.1 USD Billion $51.1 USD Billion 24.0%
In-Wall $24.2 USD Billion $62.2 USD Billion 22.0%

Segment-wise data is locked

Unlock complete segment-wise numbers for By Form Factor.

Unlock Full Data

Which Form Factor Is Growing Fastest in the Smart Home Display Market?

Tabletop is the dominant form factor at USD 2.10 Billion in 2025 to USD 2.97 Billion by 2035, reflecting the consumer retail-channel preference for portable countertop placement of Amazon Echo Show and Google Nest Hub devices across kitchen and living room environments. In-Wall is the fastest-growing form factor at a 6.85% CAGR from 2026 to 2035, driven by builder and developer pre-installation programs, professional home automation installation channel growth, and the increasing availability of in-wall smart display products from Brilliant NextGen, Crestron, and Savant that address the gap between consumer tabletop products and legacy wired professional control panels.
2025 (USD Billion)
2035 (USD Billion)
Amazon Alexa
Google Home
Baidu DuerOS
Alibaba AliG
Xiaomi Home
Segment Item 2025 (USD Billion) 2035 (USD Billion) CAGR
Amazon Alexa $10.0 USD Billion $40.0 USD Billion 24.0%
Google Home $17.1 USD Billion $51.1 USD Billion 22.0%
Baidu DuerOS $24.2 USD Billion $62.2 USD Billion 20.0%
Alibaba AliGenie $31.3 USD Billion $73.3 USD Billion 22.0%
Xiaomi Home $38.4 USD Billion $84.4 USD Billion 13.0%

Segment-wise data is locked

Unlock complete segment-wise numbers for By Primary Control Ecosystem.

Unlock Full Data
2025 (USD Billion)
2035 (USD Billion)
Consumer
Homebuilder
Professional
Security Pro
Others
Segment Item 2025 (USD Billion) 2035 (USD Billion) CAGR
Consumer $10.0 USD Billion $40.0 USD Billion 23.0%
Homebuilder or Developer $17.1 USD Billion $51.1 USD Billion 9.0%
Professional Integrator $24.2 USD Billion $62.2 USD Billion 19.0%
Security Provider $31.3 USD Billion $73.3 USD Billion 13.0%
Others $38.4 USD Billion $84.4 USD Billion 10.0%

Segment-wise data is locked

Unlock complete segment-wise numbers for By First Commercial Buyer.

Unlock Full Data
2025 (USD Billion)
2035 (USD Billion)
Direct to En
Retailer
Distributor
Professional
Builder or D
Segment Item 2025 (USD Billion) 2035 (USD Billion) CAGR
Direct to End User $10.0 USD Billion $40.0 USD Billion 21.0%
Retailer $17.1 USD Billion $51.1 USD Billion 23.0%
Distributor $24.2 USD Billion $62.2 USD Billion 25.0%
Professional Dealer or Integrator $31.3 USD Billion $73.3 USD Billion 15.0%
Builder or Developer $38.4 USD Billion $84.4 USD Billion 16.0%

Segment-wise data is locked

Unlock complete segment-wise numbers for By Primary Sales Channel.

Unlock Full Data

Growth Opportunities

Based on research conducted by NMSC, we found that three forward-looking opportunity areas represent the most actionable whitespace for Smart Home Display Market participants and investors through 2035.

Can Builder-Channel Integration Create a New High-Value Smart Display Revenue Stream?

Builder and developer specification of smart home displays as pre-installed project amenities represents a structurally distinct revenue stream from consumer retail, with higher average selling prices, longer replacement cycles, and specification-driven purchase decisions that reduce price sensitivity relative to consumer impulse channels. The Builder or Developer first commercial buyer and sales channel segments are growing as homebuilders respond to buyer demand for connected home features in new construction programs. Smart display vendors with dedicated builder-channel programs, pre-wiring installation partnerships, and model-home showcase presence are best positioned to capture this structurally recurring demand category.

Does the Above 15 Inch Segment Represent an Untapped Premium Market?

The Above 15 Inch screen size segment is the fastest-growing at a 7.30% CAGR from 2026 to 2035, expanding from a relatively small installed base as professional integrators and premium residential buyers adopt large-format smart displays for home theater control, whole-home automation dashboards, and luxury residential entrance panels. This segment benefits from direct-view LED and OLED panel cost reductions enabling viable display hardware at premium market price points accessible to the professional installation channel. Vendors with certified commercial touch display engineering capability adaptable to residential professional installation requirements are well positioned to expand into this high-value smart display sub-segment through 2035.

How Does IoT Energy Management Create New Demand for Smart Home Displays?

Smart home displays embedded with IoT energy management functionality, including real-time energy consumption visualization, EV charging schedule management, and solar production monitoring, are creating incremental demand in segments where simple assistant displays provide insufficient functionality. The energy management feature set appeals to the Home Control Panel and in-wall form factor segments, where displays serve as the primary household energy interface alongside thermostat and load control capabilities. European energy efficiency regulations and U.S. utility demand response programs provide regulatory tailwinds for energy management-capable smart displays through 2035, adding a compliance-driven demand layer on top of consumer preference-based adoption.

Regional Outlook

2025 (USD Billion)
2035 (USD Billion)
North Americ
Asia-Pacific
Europe
Middle East
Latin Americ
Region 2025 (USD Billion) 2035 (USD Billion) CAGR (%)
North America $10.0 USD Billion $40.0 USD Billion 9.0%
Asia-Pacific $17.1 USD Billion $51.1 USD Billion 27.0%
Europe $24.2 USD Billion $62.2 USD Billion 25.0%
Middle East & Africa $31.3 USD Billion $73.3 USD Billion 23.0%
Latin America $38.4 USD Billion $84.4 USD Billion 12.0%

Regional data is locked

Unlock complete regional numbers for this market.

Unlock Full Data

Competitive Landscape

We observed that the Smart Home Display Market Industry reflects a bifurcated competitive structure where consumer-platform-linked hardware vendors compete on ecosystem integration and volume pricing, while professional automation display specialists compete on software depth, installation partner networks, and long-term support commitments. Key Takeaways

Dimension Description
Dimension Assessment
Market Structure Bifurcated: Amazon and Google dominate consumer assistant display volume; Crestron, Savant, and ABB lead the professional installation segment; Chinese domestic vendors including Lenovo and ORVIBO compete on price in Asia-Pacific
Innovation Focus Matter protocol integration, AI-enhanced on-device processing for voice recognition, OLED and Direct-View LED form factor thinning, energy consumption optimization, and embedded security camera integration
M&A Activity Selective acquisitions in professional installation software and security platform integration; Amazon and Google expanding through ecosystem partnership rather than hardware acquisition

How Do Companies Compete in the Smart Home Display Market?

Companies in the Smart Home Display Market Industry compete across three distinct dimensions: ecosystem lock-in and platform stickiness for consumer assistant display vendors, installation channel depth and certified integrator network coverage for professional automation panel vendors, and price-performance positioning for mid-market consumer and builder-channel smart displays. NMSC's analysis indicates that competitive advantage in the consumer segment is primarily determined by voice assistant ecosystem quality and connected device compatibility breadth, while professional segment advantage derives from programming software capability, long-term product support commitments, and certified installer training ecosystem depth.

Which Competitive Archetypes Dominate the Smart Home Display Industry?

Platform-integrated consumer display vendors , Amazon and Google , dominate the assistant display category through proprietary AI assistant capability, content service bundling, and retail channel scale, creating ecosystem switching costs that sustain volume share even as hardware specifications commoditize. Professional automation panel specialists , including Crestron, Savant, and Johnson Controls , compete through certified dealer networks, custom programming software, and multi-decade OEM product support commitments that are prerequisites for architect and builder specification. Chinese platform-aligned vendors including Xiaomi, Lenovo, and ORVIBO compete in Asia-Pacific on price and local ecosystem integration with Baidu, Alibaba, and Xiaomi platform services.

What Innovation and Differentiation Strategies Are Vendors Pursuing?

During our market evaluation, we noticed that Amazon and Google are investing in on-device AI processing to reduce voice recognition latency and enable smart display functionality during internet outages, differentiating on reliability as well as feature richness. Professional automation vendors including Crestron and Savant are developing energy visualization and demand response display features that position their control panels as essential smart building interfaces rather than optional luxury accessories. Brilliant NextGen is differentiating through its in-wall form factor that replaces standard light switches with smart display interfaces, creating an installation model compatible with retrofit residential programs rather than requiring new construction pre-wiring.

What M&A and Partnership Activity Is Shaping the Smart Home Display Market?

Recent competitive activity in the Smart Home Display Market reflects platform ecosystem expansion through partnership rather than large-scale hardware company consolidation, with Amazon and Google pursuing security platform and smart home device ecosystem partnerships that extend their display ecosystems into new functional categories. Professional automation vendors including Nice S.p.A. and ABB have made selective acquisitions of regional home automation software and hardware companies to expand professional installation capability and geographic dealer network coverage. Our assessment indicates that the Matter protocol's open standard has created partnership incentives replacing adversarial ecosystem competition, enabling multi-vendor interoperability programs that benefit vendors able to serve cross-platform households.

Key Market Players

Our findings suggest that the following companies represent the validated competitive set across the consumer assistant display, professional home automation panel, and smart home platform hardware categories of the Smart Home Display Market.

Amazon.com, Inc. Google LLC Baidu, Inc. Alibaba Group Holding Limited Xiaomi Corporation Lenovo Group Limited Lumi United Technology Co., Ltd. ADI Global Distribution Inc. Shenzhen ORVIBO Technology Co., Ltd. Johnson Controls International plc Vivint Smart Home, Inc. Nice S.p.A. Crestron Electronics, Inc. Savant Systems, Inc. ABB Ltd Brilliant NextGen, Inc. Universal Remote Control, Inc. Gira Giersiepen GmbH & Co. KG Albrecht Jung GmbH & Co. KG Zennio Avance y Tecnología, S.L.

Latest Developments

Our analysis shows that recent product launches and strategic developments across the Smart Home Display Market reflect accelerating investment in AI-enhanced display interfaces, Matter protocol expansion, and professional channel program growth heading into the 2026–2035 forecast period.

Date Event
September 2026 Baidu’s Xiaodu launched the Smart Display X9 Ultra, an 8-inch smart home display with an AI-enabled gimbal camera, infrared night vision, Wi-Fi 6, Bluetooth 5.4, and infrared home-appliance control.
June 2026 Vivint launched Smart Hub Pro 2, a 7-inch touchscreen command center for security, smart-home devices, and energy management. The updated hub adds upgraded performance, customization, live video, security alerts, and centralized device control.
May 2026 Savant introduced its new Touch family, comprising Touch 5.9, Touch 8, and Touch 10 control panels. The range adds AMOLED technology on the 5.9-inch model, upgraded processors, noise-cancelling audio, PoE installation, and expanded smart-home control capabilities.
May 2026 ADI introduced the next-generation Control4 T5 In-Wall Touchscreen, replacing the T4 generation with faster processing, a slimmer flush-mount design, proximity sensing, Dark Mode, upgraded microphones, and simplified PoE installation.

Expert Insights

Anish Kattukaran

Anish Kattukaran

Chief Product Officer | Google Home

"If you think about the properties of a smart display: a microphone, which means audio in, a speaker, so audio out. It’s got a screen, which complements a voice modality, you can interact with it and visualize information ."

Analyst Interpretation

We observed that this perspective directly supports the evolution of smart displays from voice-assistant devices into multimodal interaction hubs for connected homes. NMSC’s analysis indicates that the combination of microphones, speakers, screens, and AI-enabled interfaces is expanding the functional scope of smart home displays by enabling users to interact through both voice and visual modalities. This convergence is strengthening demand for smart displays that integrate home control, information access, entertainment, communication, and AI-assisted experiences within a unified household interface, supporting broader adoption across connected-home ecosystems .

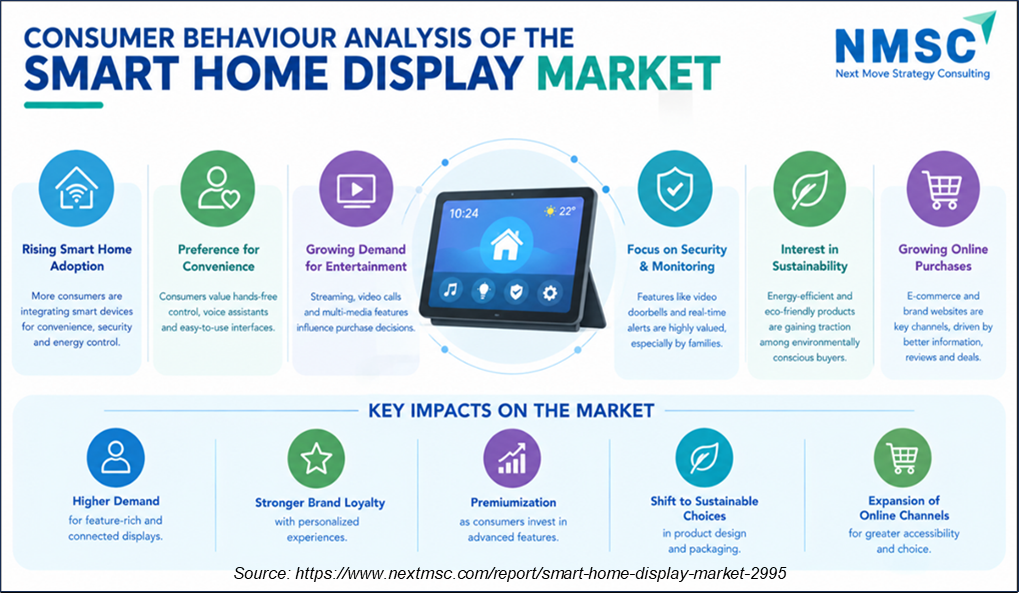
Consumer Behaviour Analysis of the Smart Home Display Industry

The above infographic presents consumer behaviour in the Smart Home Display Market by highlighting growing smart-home adoption, convenience preferences, demand for entertainment features, security and monitoring needs, sustainability awareness, and online purchasing. It connects these behaviours with broader market impacts, including higher demand, stronger brand loyalty, premiumization, sustainable product choices, and continued expansion of online sales channels .

Investment Opportunities

Where Are Capital Inflows Concentrating in the Smart Home Display Market?

Capital inflows in the Smart Home Display Market are concentrating in three areas: platform AI capability investment by Amazon and Google to differentiate their assistant display ecosystems through on-device processing and enhanced LLM-based assistant intelligence; professional channel expansion programs by Crestron, Savant, and ADI Global Distribution to grow certified dealer networks in underpenetrated mid-market residential segments; and China domestic platform-aligned hardware investment by Lenovo, Lumi United, and ORVIBO targeting the rapidly growing urban Chinese smart home adoption market with locally integrated product ecosystems.

How Is Infrastructure Investment Supporting Long-Term Smart Home Display Adoption?

Smart home display adoption is indirectly supported by broadband infrastructure investment that creates the connected household foundation enabling cloud-dependent assistant display functionality, and by new residential construction investment that generates builder-channel smart display integration opportunities in unit volume correlated with housing starts. The U.S. Census Bureau's residential construction data and EU housing construction investment statistics are both relevant leading indicators for smart home display demand volume across North America and European markets. Energy management grid modernization programs also create regulatory demand for connected energy management interfaces, including smart home displays with embedded energy visualization features.


What ESG Considerations Are Influencing Smart Home Display Investment Decisions?

ESG considerations in the Smart Home Display Market center on standby power consumption of always-on display devices, product lifecycle and electronic waste management compliance, and privacy governance for camera-enabled displays in residential environments. European Energy Labelling Regulation requirements are compelling smart display vendors to reduce standby power consumption, making E-Paper and low-power OLED display technologies strategically aligned with ESG-minded institutional investor criteria. Privacy-preserving smart display designs incorporating physical camera shutters, local AI processing without cloud data transmission, and transparent data governance disclosures are gaining preference among consumers and ESG-focused retailers as procurement screening criteria.

Key Benefits for Stakeholders

How Does This Report Benefit Industry Leaders?

Industry leaders gain segment-level revenue forecasts and CAGR benchmarks across primary purchase purpose, screen size, display technology, form factor, primary control ecosystem, first commercial buyer, and primary sales channel axes, enabling product portfolio investment and channel strategy decisions grounded in the 2025–2035 market data used consistently throughout this Smart Home Display Market analysis. Competitive landscape data on market structure, innovation focus, and M&A activity provides strategic intelligence for positioning display product lines and channel programs against identified dominant ecosystem vendors and emerging regional competitors.

How Does This Report Benefit Investors and Financial Analysts?

Investors and financial analysts gain a reconciled market-sizing model with segment growth differentials, regional CAGR comparisons, and competitive archetype dynamics supporting valuation and capital allocation decisions across publicly listed smart home platform companies, display hardware manufacturers, and professionally installed home automation system vendors. The Growth Catalyst & Risk Assessment Matrix quantifies driver and restraint impacts on overall CAGR, enabling scenario construction around platform ecosystem consolidation, Matter protocol adoption acceleration, and housing construction cycle sensitivity to interest rate environments.

How Does This Report Benefit Technology Vendors and Product Teams?

Technology vendors and product teams gain clarity on which Smart Home Display Market segments are growing fastest : Security Command Panels at 6.34% CAGR, Direct-View LED technology at 7.93%, In-Wall form factor at 6.85%, and Above 15 Inch screen sizes at 7.30% , directing hardware engineering and software platform investment toward the highest-growth product categories. Regional market data for Asia-Pacific, India, and MEA supports geographic product localization and channel partnership decisions for vendors targeting growth markets beyond established North America and Europe smart home display revenue bases.

Key Market Segments Evaluated

By Primary Purchase Purpose

  • Assistant Displays
  • Home Control Panels
  • Security Command Panels

By Screen Size

  • Under 7 Inches
  • 7 to Under 11 Inches
  • 11 to 15 Inches
  • Above 15 Inches

By Display Technology

  • LCD
  • OLED
  • E-Paper
  • Direct-View LED
  • Others

By Form Factor

  • Tabletop
  • Surface-Mounted
  • In-Wall

By Primary Control Ecosystem

  • Amazon Alexa
  • Google Home
  • Baidu DuerOS
  • Alibaba AliGenie
  • Xiaomi Home
  • Apple Home
  • Professional Automation Platform
  • Vendor Proprietary Platform
  • Multi-Ecosystem
  • Others

By First Commercial Buyer

  • Consumer
  • Homebuilder or Developer
  • Professional Integrator
  • Security Provider
  • Others

By Primary Sales Channel

  • Direct to End User
  • Retailer
  • Distributor
  • Professional Dealer or Integrator
  • Builder or Developer
  • Security Provider
  • Others

By Region

  • North America 
    • U.S.
    • Canada
    • Mexico
  • Europe 
    • UK
    • Germany
    • France
    • Italy
    • Spain
    • Sweden
    • Denmark
    • Finland
    • Netherlands
    • Rest of Europe
  • Asia-Pacific 
    • China
    • India
    • Japan
    • South Korea
    • Taiwan
    • Indonesia
    • Vietnam
    • Australia
    • Philippines
    • Malaysia
    • Rest of APAC
  • Middle East & Africa 
    • Saudi Arabia
    • UAE
    • Egypt
    • Israel
    • Turkey
    • Nigeria
    • South Africa
    • Rest of MEA
  • Latin America 
    • Brazil
    • Argentina
    • Chile
    • Colombia
    • Rest of LATAM

Conclusion & Recommendations

The long-term outlook for the Smart Home Display Market is positive, with the market expanding from USD 3.68 Billion in 2026 to USD 5.30 Billion by 2035 at a CAGR of 4.13%, supported by persistent smart home ecosystem investment from Amazon and Google, growing professional automation demand, and structural new-use-case expansion through security display convergence and energy management feature integration. We observed that the market's moderate CAGR reflects a growth-stage market approaching maturity in consumer assistant displays, offset by faster-growing professional and in-wall segments that are earlier in their adoption curves.

What Strategic Positioning Do We Recommend?

Smart Home Display Market vendors should prioritize Matter protocol certification and Multi-Ecosystem compatibility as table-stakes product requirements, since ecosystem lock-in is progressively weakening as a consumer purchase driver while interoperability is becoming a baseline expectation. The In-Wall form factor and Security Command Panel purchase purpose represent the highest-CAGR segments through 2035, warranting dedicated product investment for vendors currently concentrated in the slower-growing tabletop assistant display category. Building a certified professional installation dealer channel is the recommended market entry strategy for premium home control panel vendors targeting the high-value builder and integrator first commercial buyer segments.

How Attractive Is the Smart Home Display Market for Investment?

Investment attractiveness is moderate in the Smart Home Display Market overall, with the USD 1.62 Billion absolute opportunity from 2026 to 2035 concentrated in specific high-CAGR segments: Direct-View LED display technology at 7.93% CAGR, E-Paper at 7.64%, Above 15 Inch screen sizes at 7.30%, In-Wall form factor at 6.85%, and Security Command Panels at 6.34%. Asia-Pacific at 5.35% CAGR and India at 6.72% represent the highest-growth regional investment destinations, while North America provides volume and stability as the market's dominant and most mature regional segment.

What Are the Key Market Shifts and Risks?

Key risks include smartphone-based control continuing to substitute for dedicated smart displays in a larger-than-forecast share of smart home households, particularly as AI mobile assistant capability improves through LLM integration in iOS and Android platforms. Platform consolidation risk is present if Amazon or Google exits the dedicated display hardware segment in favor of software-only voice assistant strategies, which would materially reduce volume in the Assistant Display category. Our analysis shows that energy pricing volatility and consumer spending cycles create variability in the discretionary smart home hardware investment that underpins a significant portion of market demand across all five regions.

What Are the Primary Growth Pathways Through 2035?

Primary growth pathways include builder-channel integration expansion that creates specification-driven demand for smart home displays in new residential construction independent of consumer retail cycles, security feature convergence that upgrades security-only panel revenue into higher-value unified smart display purchases, and energy management display integration that adds regulatory compliance value to smart home control panel purchases in European and increasingly Asian energy-regulated markets. Our assessment indicates that vendors executing across all three pathways simultaneously are best positioned to capture the USD 1.62 Billion absolute market opportunity through 2035 while sustaining revenue resilience against individual segment variability.

Delivered Customizations

We have successfully delivered the following deep-dive customizations:

Client Request Customization Delivered Value Adds
Historical Market & Shipment Analysis
  • Historical shipment and revenue analysis of smart home displays by screen size, display technology, and form factor.
  • Identifies fastest-growing display formats and guides product roadmap and capacity planning.
Company-Level Shipment Volume Analysis
  • Company-level smart home display unit shipment and revenue benchmarking by control ecosystem and screen size.
  • Reveals brand scale and ecosystem positioning to support competitive and partnership decisions.
Import-Export Trade Assessment
  • Country-wise import and export analysis of smart home display devices and key display panels.
  • Highlights sourcing hubs, trade dependencies, and regional supply-chain risks.
Ecosystem Compatibility and Platform Adoption Mapping
  • Mapping of smart home display share and adoption across primary control ecosystems (Google, Amazon, Apple, Samsung, Matter-enabled and proprietary platforms) by form factor.
  • Guides ecosystem alignment, certification priorities, and platform partnership strategy.
Purchase Purpose and Buyer Segment Demand Analysis
  • Demand analysis by primary purchase purpose and first commercial buyer, covering consumers, builders, installers, and hospitality or multi-dwelling operators.
  • Pinpoints priority customer groups and use cases for targeted product positioning.
Sales Channel and Price-Tier Benchmarking
  • Benchmarking of smart home display pricing and shipment mix across online, retail, and installer or builder channels by screen size and display technology.
  • Supports pricing, channel investment, and go-to-market optimization by segment.

FAQs

About the Author

Mayurima Roy

Mayurima Roy

Mayurima Roy is Research Analyst at Next Move Strategy Consulting, where she has spent 4 years working across the firm's full industry coverage rather than a single fixed vertical. Her work centers on structured research, ongoing trend tracking, competitive assessment, and insight-led content development, translating complex market data into clear, decision-ready narratives that support informed client decision-making across diverse global industries, market sectors, and world regions every day.

About the Reviewer

Supradip Baul

Supradip Baul

Supradip Baul is an accomplished business consultant and strategist with over a decade of rich experience in market intelligence, strategy, technology, and business transformation. His work has included rigorous qualitative and quantitative analysis across multiple industries, helping clients shape investment decisions and long-term roadmaps. Earlier in his career, he was associated with Gartner, where he contributed to industry-leading reports and market share analyses. He has worked with leading global companies and holds an MBA with a dual specialization in Marketing and Finance.

Download Free Sample

Gaurav Jaiswal

GAURAV JAISWAL

Founder & CEO

Yano Charge Private Limited

The EV Charging market research report provided by the NextMSC was exceptionally detailed and insightful. It offered a comprehensive analysis that proved to be a game-changer for our strategic planning. Truly a testament to the NextMSC’s expertise and thoroughness in EV market landscape & analysis.

Kevin Coker

KEVIN COKER

Founder, CEO and Board Diector

Proxima Clinical Research

I have been using Next MSC reports for product positioning in a new geography for a long time. They have by far the best reports I have found and the price is reasonable too!

Gustaf Hummel Burstrom

GUSTAF HUMMEL BURSTROM

Founder

Revline Tools AB

Joseph and the team at Next Move Strategy Consulting have been excellent to work with, in supplying us with relevant market data and forecasts for our specific category. We had some special requirements and they were able to do a custom package to suit our needs. We would definitely recommend them to any other company needing market data and forecasts

Robert Sean Trevino

ROBERT SEAN TREVINO

Sr. Director, Head of Strategic Insights & Analytics

Foundation Medicine

I realized that it was a reliable source of information. These days, there are many people who are looking for authentic data, and this is one of the only sources that can offer them with what they need;

Amos Chang

AMOS CHANG

Strategy Consultant

Kardex Group

I have bought the intralogistics market reports from NMSC two times so far. Joseph and his team are always very helpful and flexible in responding to any customization requirements on the report. Their expertise in market reports really helps us steer the day-to-day business. I will definitely recommend and come back myself whenever there is a need.

Custom Market Research Services

We will customize the research for you if the listed report does not fully match your requirements.

Get 30% Free Customization

Select License

This website uses cookies to ensure you get the best experience on our website. Learn more

✖