Military Aviation Sensors & Switches Market by Product Type (Sensors, Proximity Sensors, Position Sensors, Pressure Sensors, Temperature Sensors, Angle of Attack Sensors, Speed Sensors, and Switches), by Application (Combat Application, Surveillance and Reconnaissance, Training Aircraft, Transport Aircraft, and Others), by Platform Type (Fixed-Wing Aircraft, and Others), and by Technology Type (Analog Technology, and Others)- Global Opportunity Analysis and Industry Forecast 2022-2030
Industry: Aerospace & Defense | Publish Date: 12-May-2025 | No of Pages: 403 | No. of Tables: 288 | No. of Figures: 233 | Format: PDF | Report Code : AD535
Market Definition
The Military Aviation Sensors & Switches Market was valued at USD 200.06 million in 2021 and is predicted to reach USD 268.61 million by 2030, expanding at a CAGR of 3.6% from 2022 to 2030.
Military aviation sensors & switches are devices that are installed in aircraft to obtain accurate data from different sections of the aircraft such as the engine, cockpit, landing gear, and others. The data collected from the various sections are transferred to the control system to ensure the smooth and efficient working of the aircraft. It also helps in monitoring and controlling different systems in the aircraft as well as provides information about any damage or malfunction of any section to the pilot to avoid accidents and other uncertain conditions.
Market Dynamics and Trends
The rising demand for military aviation sensors & switches is due to the increased use of aircraft in defense for various purposes such as logistical supply to forces stationed in a war theater, destroying enemy equipment, and enabling aerial warfare. Also, the growing technological advancements such as micro-electromechanical system (MEMS) technology in aircraft, Loyal Wingman drones, and easy-to-fly autonomous helicopters are expected to drive the growth of the market during the forecast period.
Moreover, most countries such as the US, China, Russia, and India are renewing their military fleet and spending heavily on the procurement of advanced military aircraft incorporating aviation sensors and switches, thereby enhancing the market growth globally during the forecast period. For instance, in July 2022, the Russian Defense Ministry announced that the Russian Air Force received its first modernized Su-34M multipurpose bombers that incorporate features from the Su-30MKI, Su-33, and Su-35. It uses three interchangeable reconnaissance pods, UKR-RT, UKR-OE, and UKR-RL that transmit their findings via a wide-band datalink in real-time to friendly aircraft and command centers.
The high cost of aviation sensors along with stringent government regulations associated with military products regarding approval and clearances are expected to hamper the growth of the military aviation sensors & switches market. On the other hand, increasing integration of the internet of things (IoT) in airplanes to record and analyze data for gathering battlefield awareness in advance is expected to create lucrative growth opportunities for the military aviation sensors & switches market players in the future.
Market Segmentations and Scope of the Study
The global military aviation sensors & switches market is segmented based on sensor type, application, end-user, and geography. Based on sensor type, the market is divided into proximity sensors, position sensors, pressure sensors, temperature sensors, angle of attack sensors, speed sensors, and field switches. Based on application, the market is fragmented into fighter aircraft, training aircraft, transport aircraft, UAVs, helicopters, and space. Based on end-user, the market is categorized into health monitoring system (HMS), cabin/ avionics, engine, and others. Geographic breakdown and analysis of each of the aforesaid segments include regions comprising North America, Europe, Asia-Pacific, and RoW.
Geographical Analysis
North America held the lion’s share of the global military aviation sensors & switches market in 2021 and is expected to continue dominating the market during the forecast period. This is attributed to the presence of the US, which is the highest military spending country and contributes to the growth of the military aviation sensors & switches market. For instance, in April 2022, according to the U.S. Army Public Affairs, the FY2023 presidential budget request of $773 billion included $177.5 billion for the Army USD194 billion for the Air Force and Space Force, and $230.8 billion for the Navy & Marine Corps.
Also, the U.S. is home to major manufacturers of military aircraft such as Boeing, Lockheed Martin, Northrop Grumman, and many more that deploys aviation sensors and switches, resulting in the growth of the market in this region. Furthermore, in January 2021, Boeing announced the installation of upgraded infrared search and track sensors aboard Air Force F-15 jet fighter aircraft to detect, track, and attack enemy aircraft in a stealthy way without making its presence known.
Asia-Pacific is expected to exhibit significant growth in the global military aviation sensors & switches market during the forecast period, due to the expansion in government expenditure in the aerospace & defense sector. For instance, in March 2022, the Chinese government announced the defense budget for the fiscal year 2022 at USD 230 billion a 7.1% year-on-year increase.
Also, countries such as China, Japan, and India are acquiring additional military airpower in light of the growing border tensions between countries. This is expected to support the growth of the military aviation sensors and switches market in this region. For instance, in June 2022, the Indian Air Force (IAF) announced its plan to acquire 114 fighter jets, out of which, 96 would be built in India in a major push to the country's Aatmanirbhar Bharat scheme while the rest 18 would be imported from a foreign vendor chosen for the project.
Competitive Landscape
The military aviation sensors & switches market is comprised of various market players such as Honeywell International Inc, Thales Group, Ratheon RTX, GE Aerospace, TE Connectivity, AMETEK Inc., Meggitt PLC, Safran Group, Curtiss Wright Corporation, TransDigm Group, Eaton Corporation, Crane Aerospace & Electronics, Stellar Technology, ITT Inc., Unison Industries, LLC among others. These manufacturers are actively indulging in R&D initiatives, product & technology innovations, and industrial collaborations to enhance their product portfolio and increase their sales growth and geographical reach.
For instance, in January 2021, Honeywell International Inc introduced the next generation of its monitoring system and cabin pressure control with applications in both commercial and military aircraft. This new version of the monitoring system is all-electric, lighter in weight, and is available in military trainer-sized aircraft. Additionally, in February 2020, Ametek signed a multi-year extension to an existing agreement of distribution with Kellstrom Defense Aerospace for the global military and government aftermarket and providing solutions for military aircraft sustainment.
Key Market Segments
By Product Type
-
Sensors
-
Proximity Sensors
-
Position Sensors
-
Pressure Sensors
-
Temperature Sensors
-
Angle of Attack Sensors
-
Speed Sensors
-
-
Switches
By Application
-
Combat Application
-
Surveillance and Reconnaissance
-
Training Aircraft
-
Transport Aircraft
-
Unmanned Aerial Vehicles (UAVs)
By Platform Type
-
Fixed-Wing Aircraft
-
Rotary-Wing Aircraft
-
Unmanned Plarforms
By Technology Type
-
Analog Technology
-
Digital Technology
-
Hybrid Technolog
By Geography
-
North America
-
U.S
-
Canada
-
Mexico
-
-
Europe
-
UK
-
Germany
-
Italy
-
Spain
-
Netherlands
-
Rest of Europe
-
-
Asia-Pacific
-
China
-
India
-
Japan
-
Australia
-
South Korea
-
Taiwan
-
Vietnam
-
Rest of Asia-Pacific
-
-
RoW
-
Latin America
-
Middle East
-
Africa
-
Key Players
-
Thales Group
-
Ratheon RTX
-
GE Aerospace
-
TE Connectivity
-
AMETEK Inc.
-
Meggitt PLC
-
Safran Group
-
Curtiss Wright Corporation
-
TransDigm Group
-
Eaton Corporation
-
Crane Aerospace & Electronics
-
Stellar Technology
-
ITT Inc.
-
Unison Industries, LLC
-
Honeywell International Inc
REPORT SCOPE AND SEGMENTATION:
|
Parameters |
Details |
|
Analysis Period |
2021–2030 |
|
Base Year Considered |
2021 |
|
Forecast Period |
2022–2030 |
|
Market Size Estimation |
Billion (USD) |
|
Market Segmentation |
By Sensor Type (Proximity Sensors, Position Sensors, Pressure Sensors, Temperature Sensors, Angle of Attack Sensors, Speed Sensors, and Field Switches), by Application (Fighter Aircraft, Training Aircraft, Transport Aircraft, UAV, Helicopter, and Space), and by End-user (Health Monitoring System (HMS), Cabin/Avionics, Engine, and Others) |
|
Geographical Segmentation |
North America (U.S., Canada, Mexico) Europe (UK, Germany, Italy, Spain, Netherlands, Rest of Europe), Asia-Pacific (China, India, Japan, Australia, South Korea, Taiwan, Vietnam, Rest of Asia-Pacific), Rest of the World (Latin America, Middle East, Africa) |
|
Companies Profiled |
Honeywell International Inc., Thales, Raytheon Company, GE Aviation (General Electric), Lockheed Martin Corporation., TE Connectivity Ltd., AMETEK, Inc., Meggitt PLC, Safran S.A., Curtiss-Wright Corporation |
")


About the Author
 Sikha Haritwal is a researcher with more than 5 years of experience. She has been keeping a close eye on several industry verticals, including construction & manufacturing, personal care products, and consumer electronics. She has avid interest in writing news articles and hopes to use blog as a platform to share her knowledge with others.
About the Reviewer
 Supradip Baul is an accomplished business consultant and strategist with over a decade of rich experience in market intelligence, strategy, technology and business transformation. His work has included rigorous qualitative and quantitative analysis across multiple industries, helping clients shape investment decisions and long-term roadmaps. Earlier in his career, he was associated with Gartner, where he contributed to industry-leading reports and market share analyses. He has worked with leading global companies and holds an MBA with a dual specialization in Marketing and Finance.
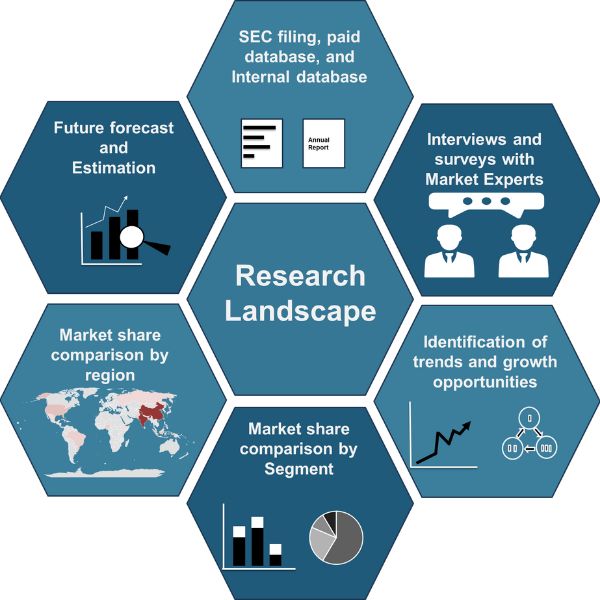
At Next Move Strategy Consulting, we understand that insightful market research is the cornerstone of successful business decisions. That's why we employ a robust and multifaceted approach, combining various methodologies to deliver the most accurate and actionable data for our clients.
Research Landscape
We navigate the world of research with two primary approaches:
Qualitative Approach
Our qualitative research methodologies involve immersive techniques such as in-depth interviews, focus groups, and observational studies. By engaging directly with individuals and stakeholders, we uncover valuable insights that quantitative data alone may overlook.
Quantitative Research
In tandem with qualitative methodologies, NMSC leverages the power of Quantitative Research to provide a robust foundation of numerical insights. Through systematic data collection and analysis, we quantify patterns, preferences, and market trends, offering a comprehensive view of the business landscape.
Our quantitative research approach employs diverse tools, including surveys, experiments, and statistical modelling. These methodologies enable us to gather data from a large and representative sample, ensuring the statistical significance of our findings. By employing structured questionnaires and standardized data collection methods, we guarantee the reliability and validity of the information we present to our clients.
Quantitative research is particularly effective in measuring the prevalence of trends, assessing market size, and gauging the impact of various factors on consumer behavior. The numerical precision attained through this approach equips our clients with actionable insights, facilitating data-driven decision-making and strategy formulation.
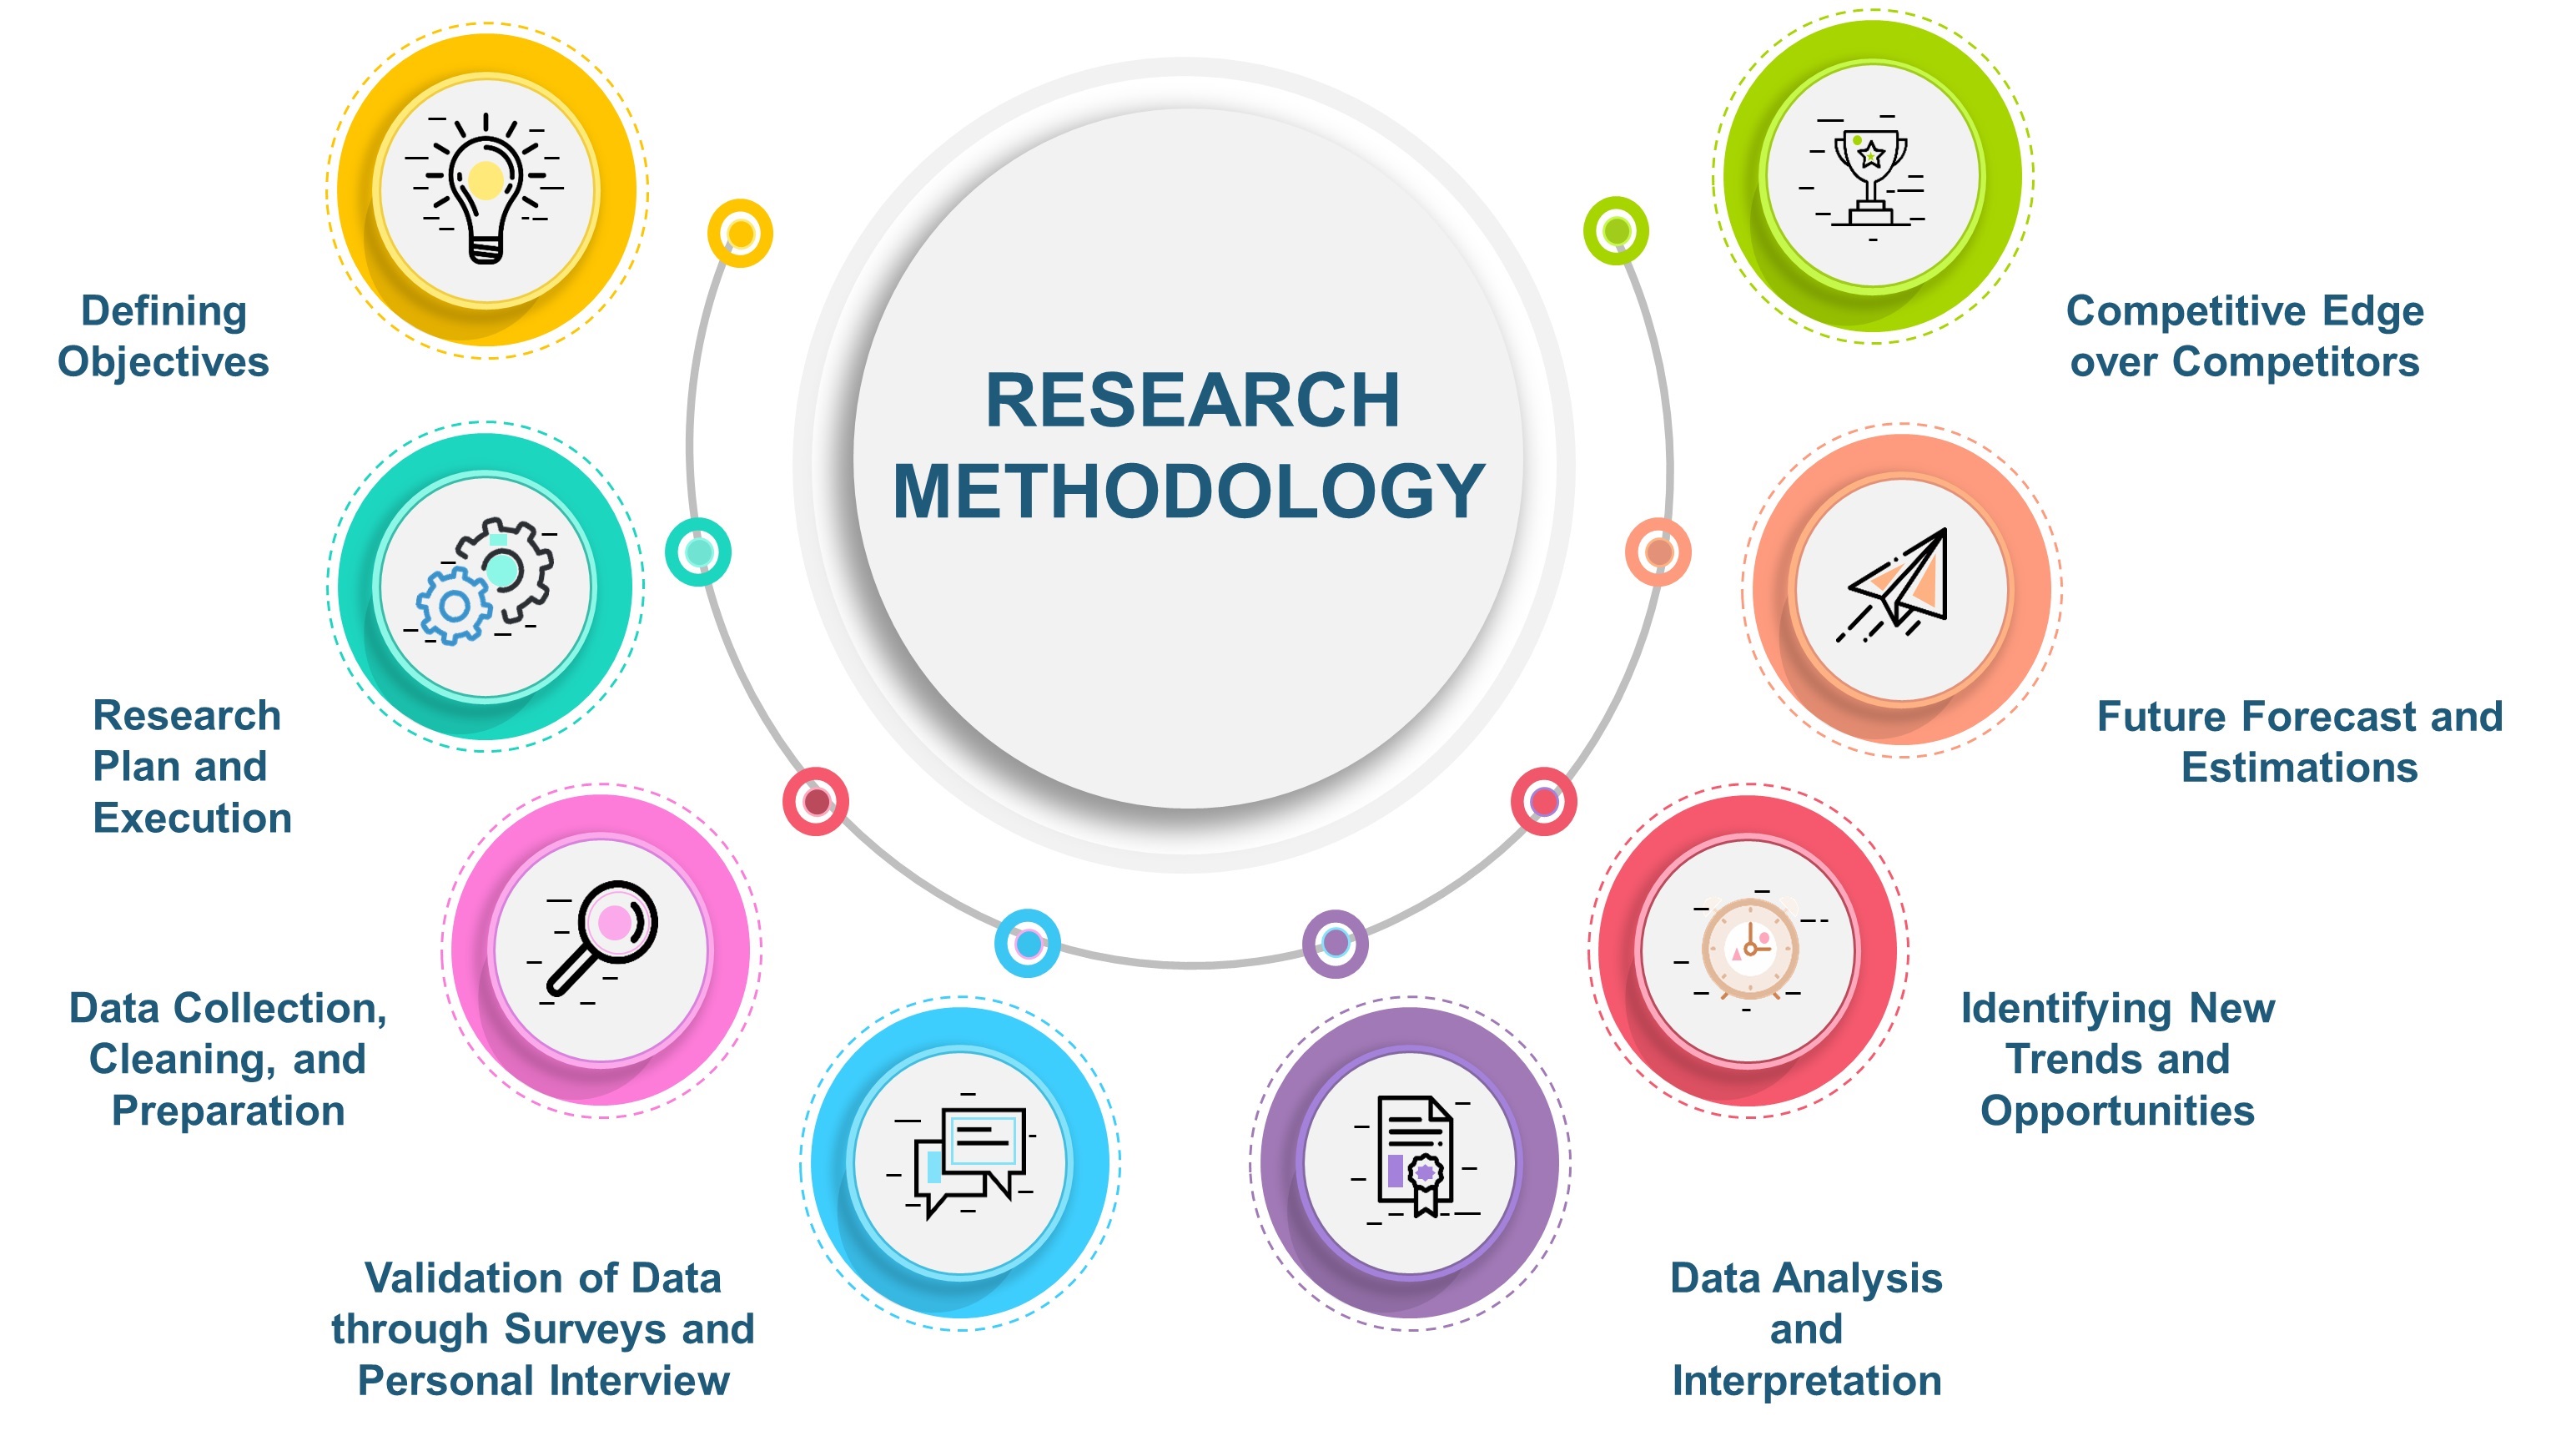
Our Specialized Toolbox for Industry-Specific Market Research
We deploy a specialized arsenal of techniques tailored to meet your unique requirements. Here's a glimpse into our comprehensive toolbox:

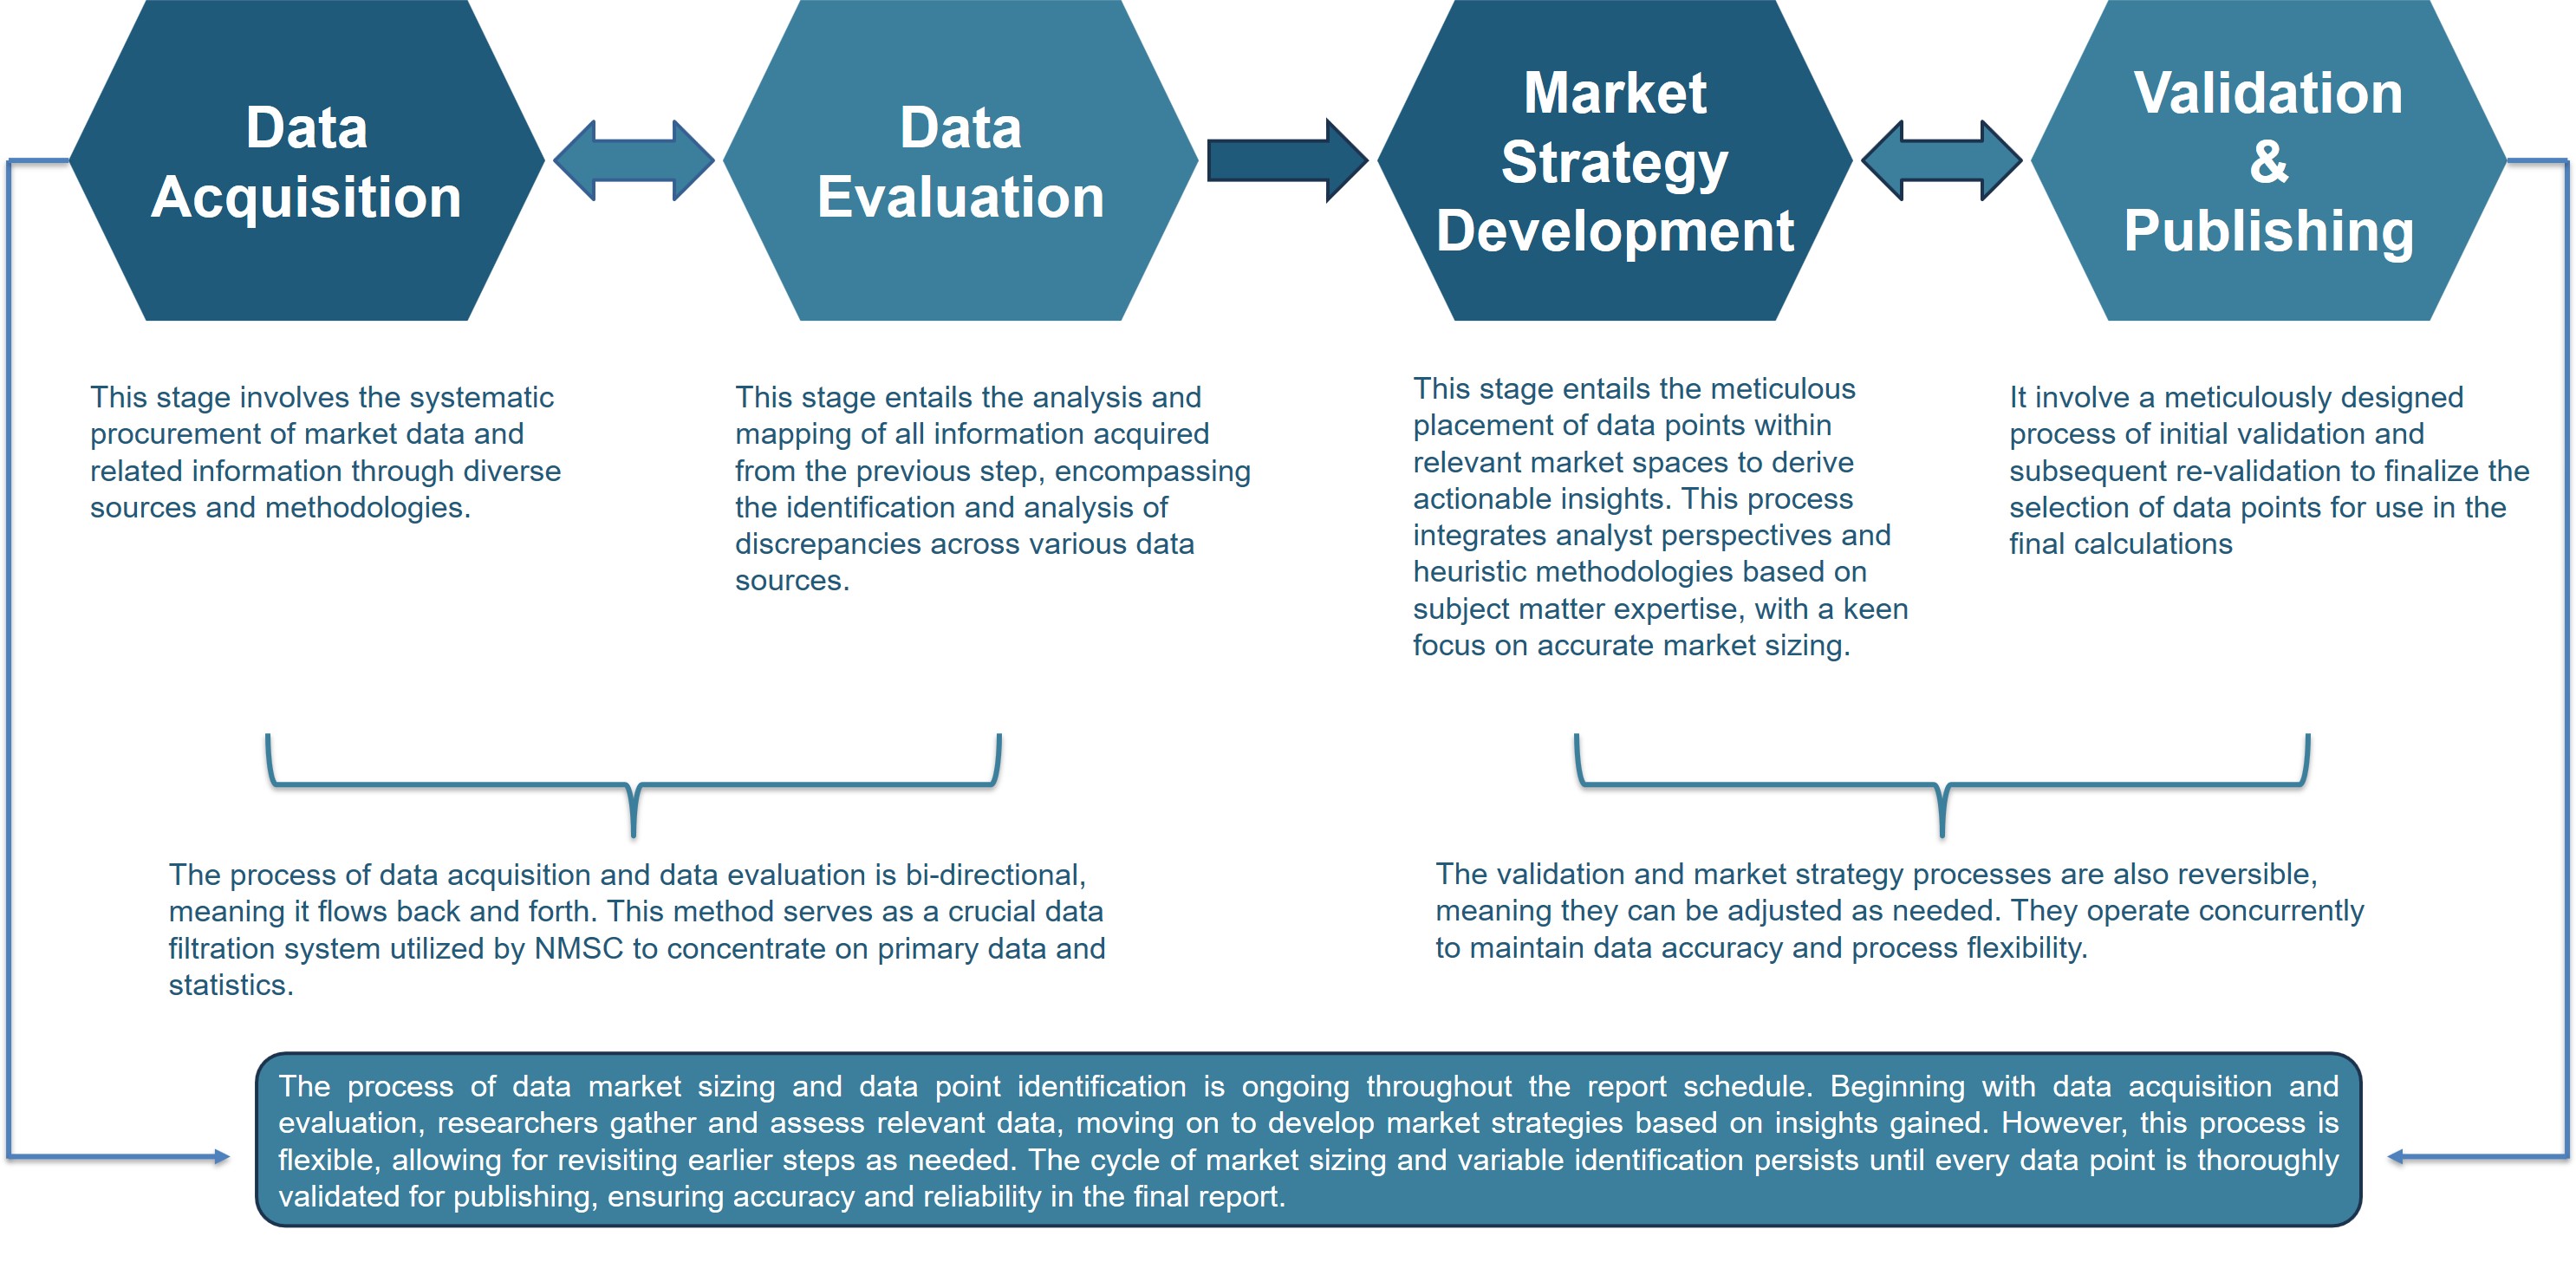
Information Procurement
The stage entails acquiring market data or relevant information through various sources and methodologies.


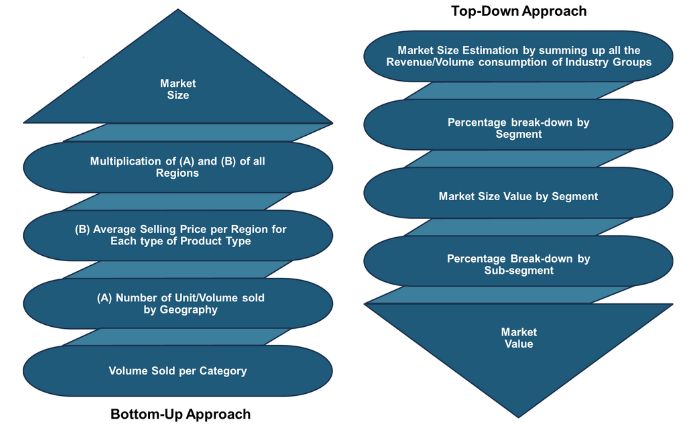
Market Research Approach
We utilize both top-down and bottom-up approaches in market research analysis to achieve a comprehensive understanding of the market dynamics, leveraging the broad perspective of industry trends and macroeconomic factors alongside detailed insights from specific segments and individual companies.
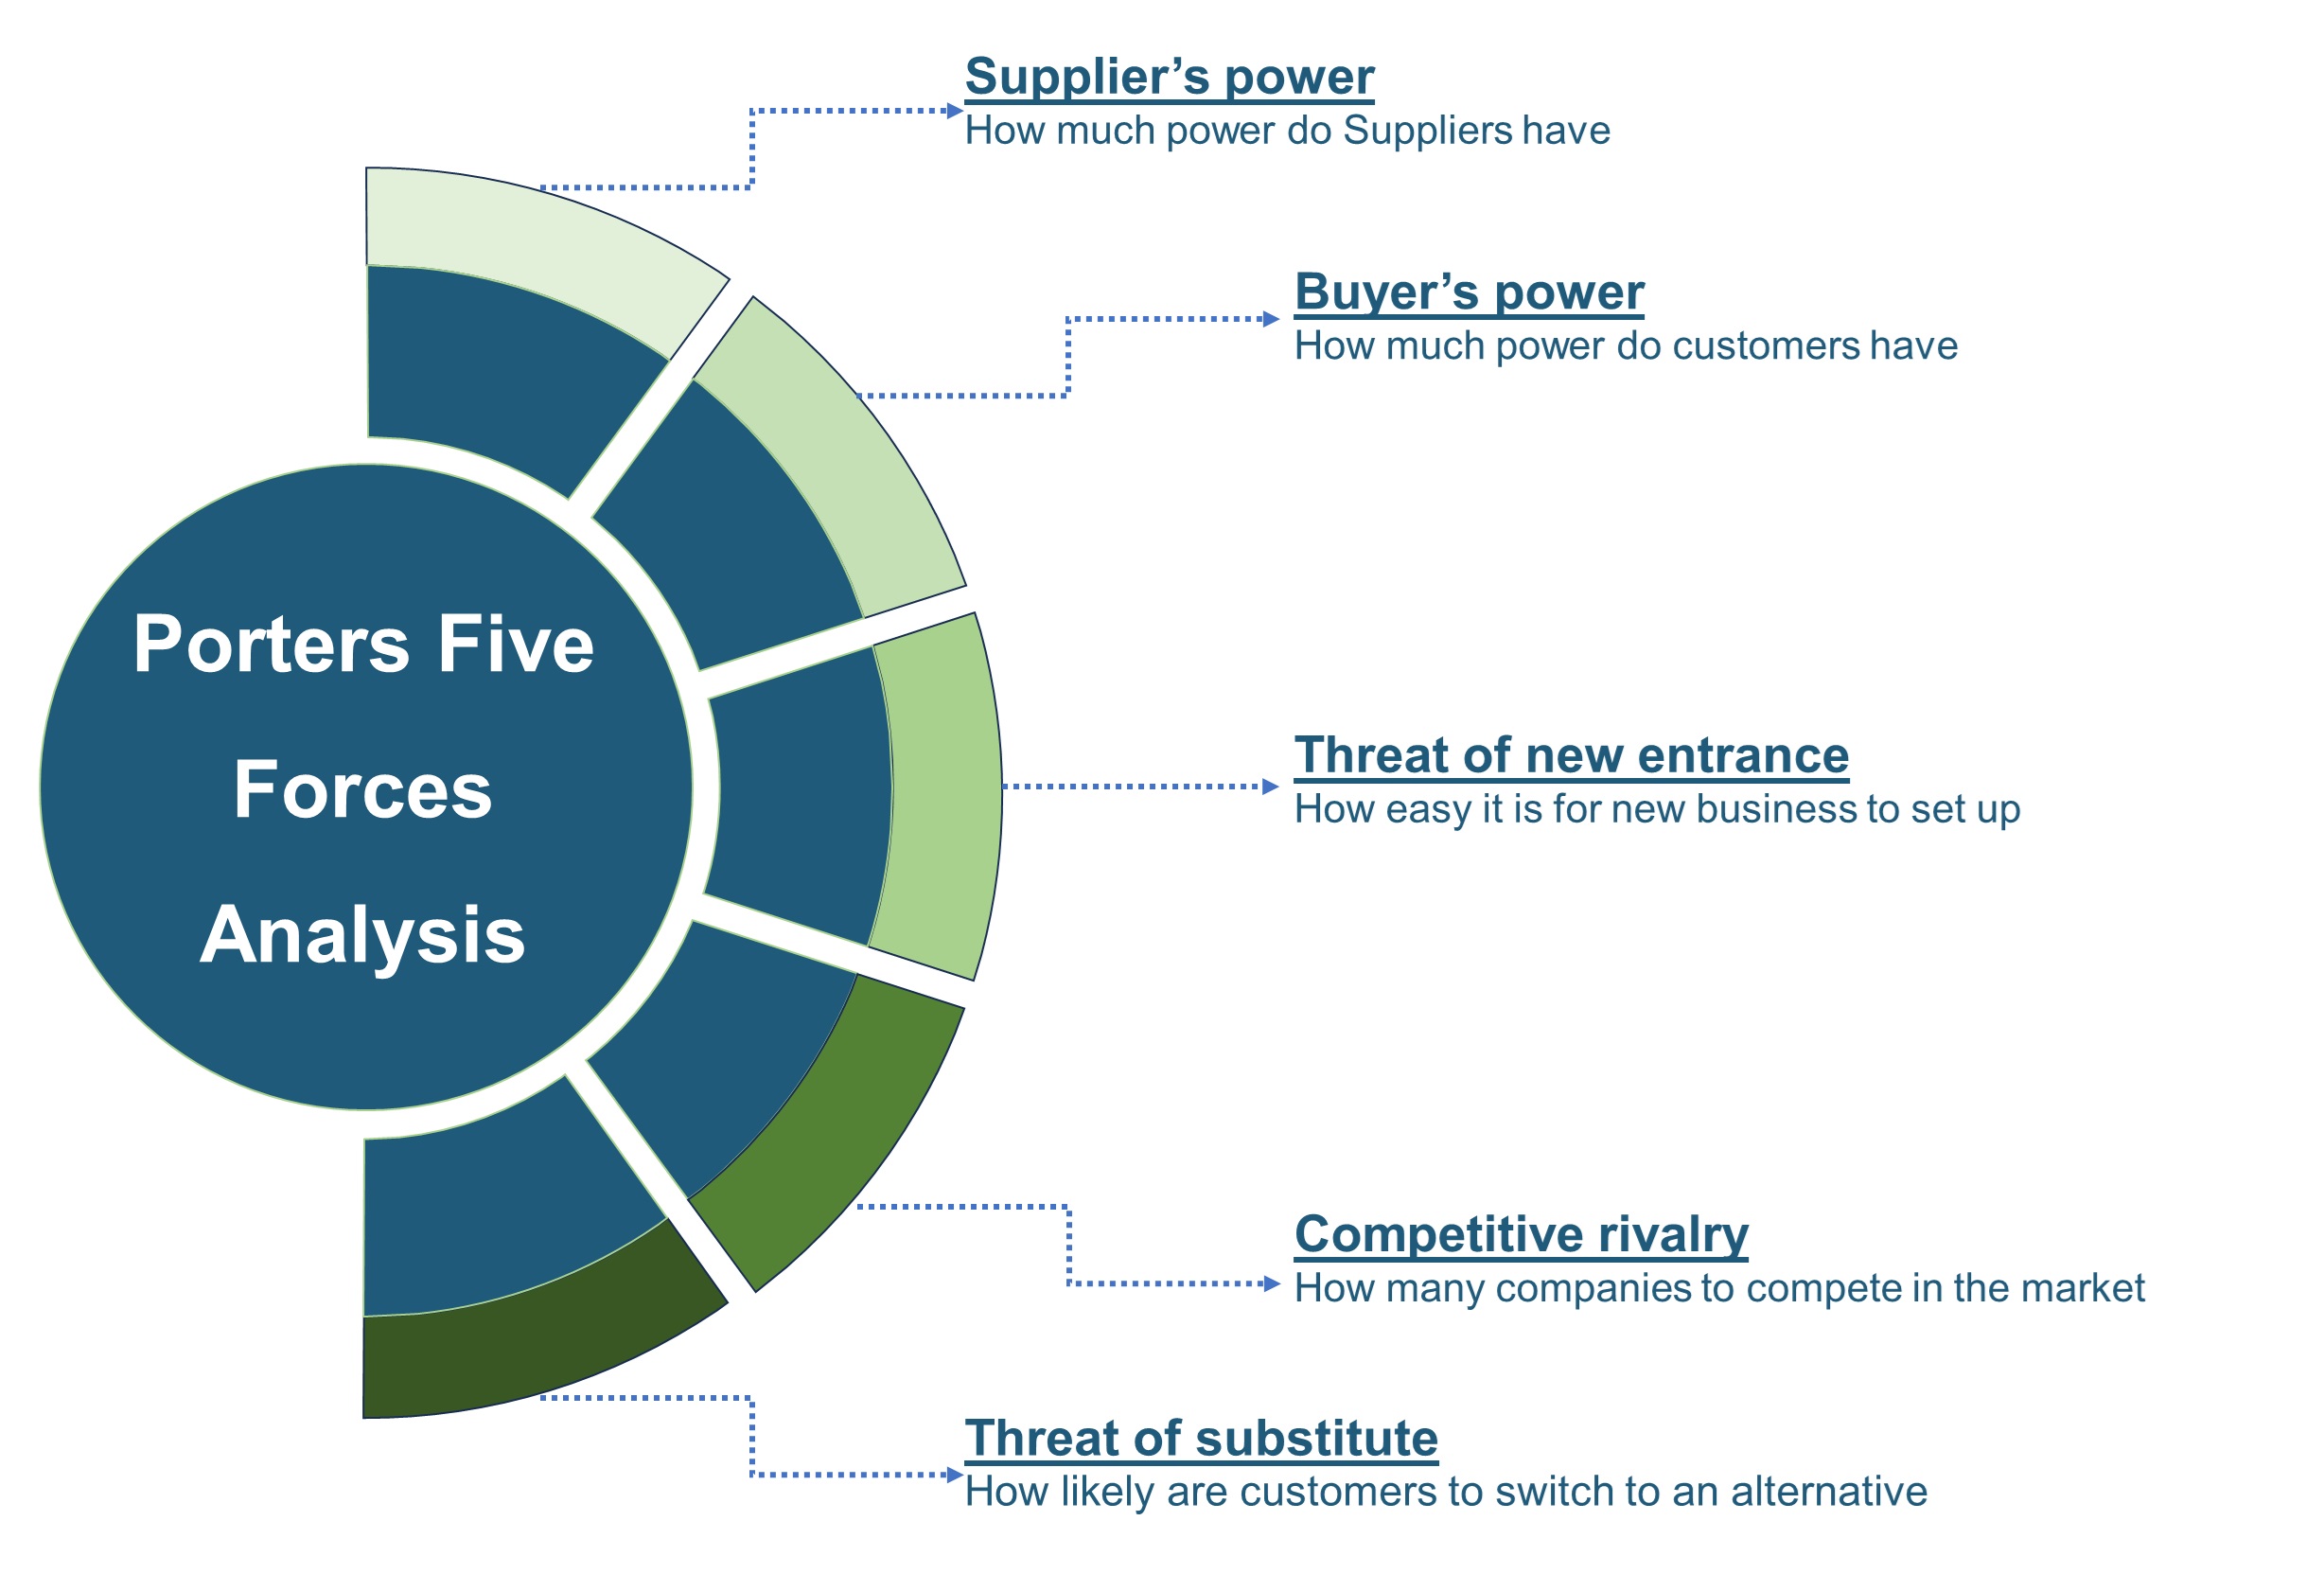
Porters Five Forces Analysis
We conduct Porter's Five Forces analysis to evaluate the competitive landscape of an industry, providing us with insights into factors that affect profitability and strategic positioning.
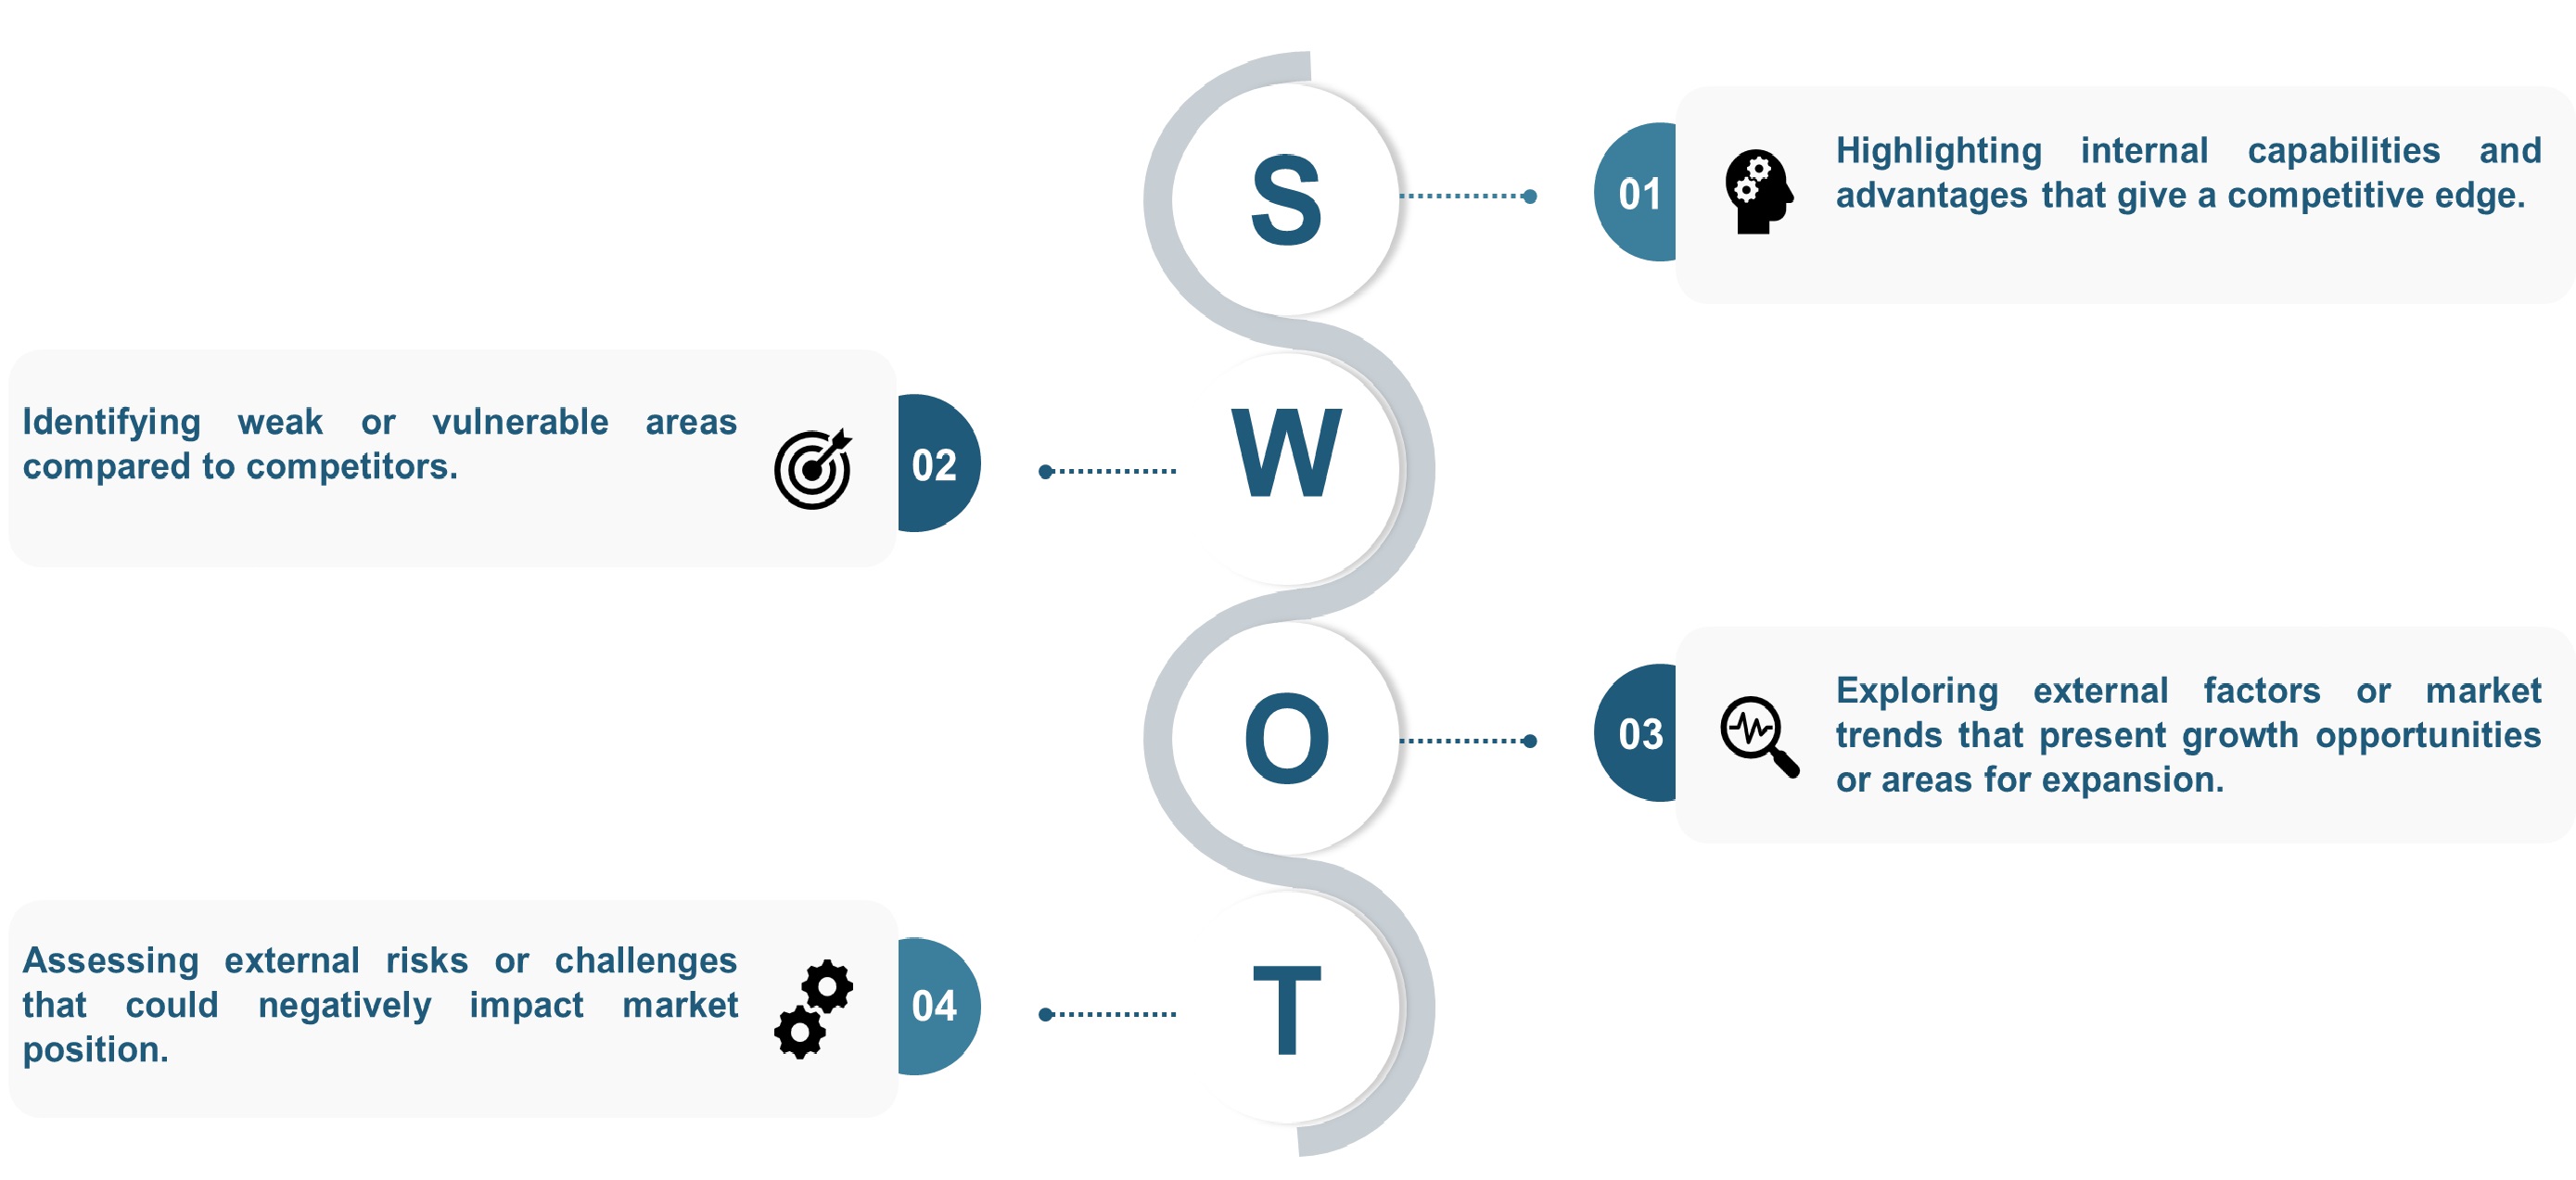
SWOT Analysis
We conduct SWOT analysis to understand market trends, identify potential threats, capitalize on opportunities, and assess our strengths and weaknesses.
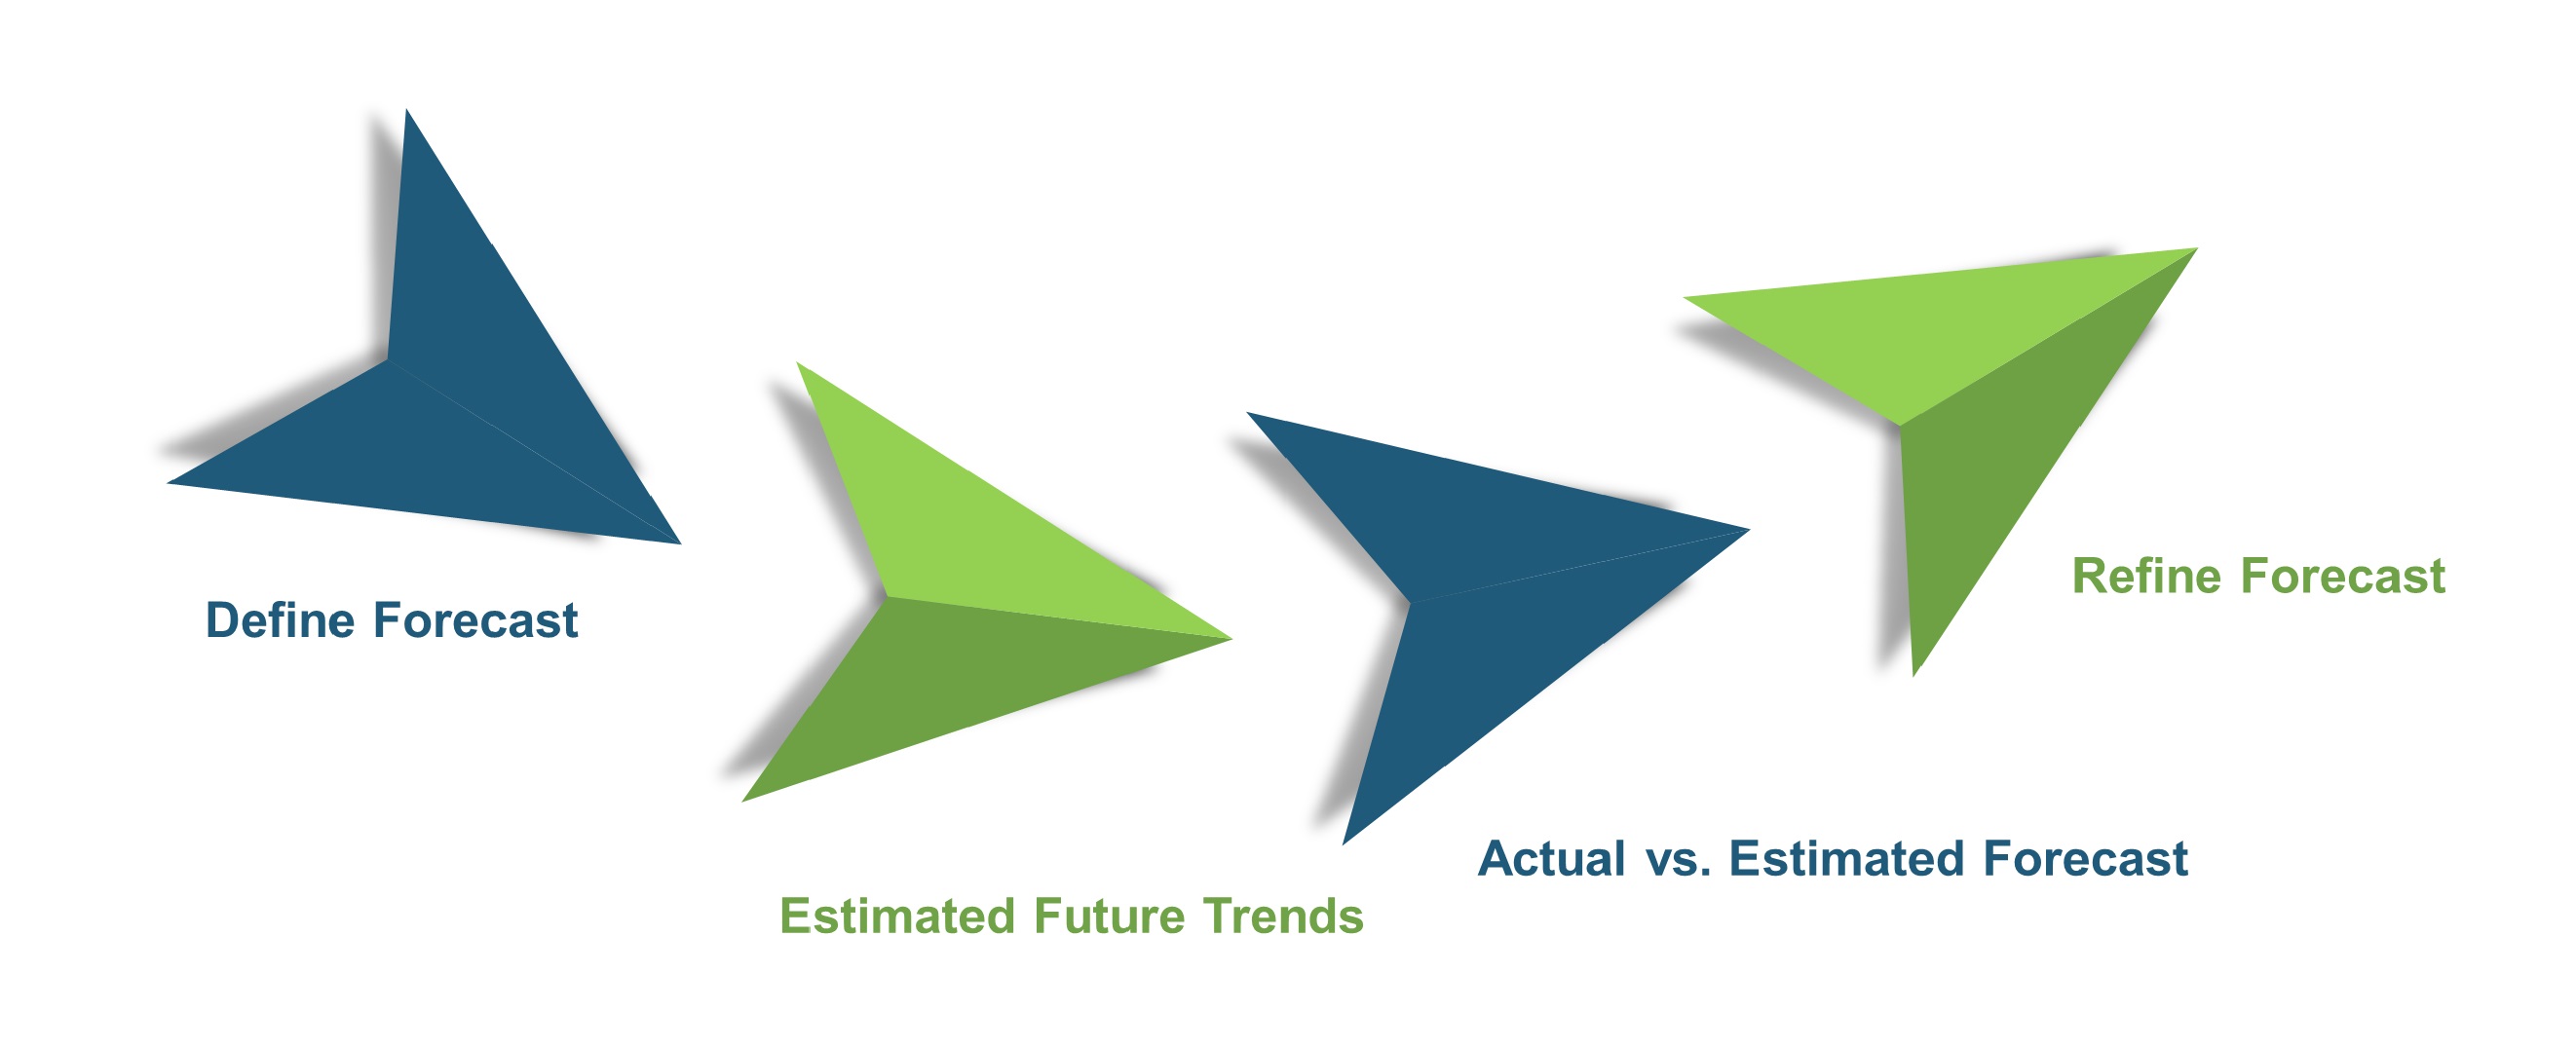
Forecasting
We utilize a forecasting model to predict future consumption by considering parameters like population, economics, regulations, market competition, drivers, constraints, technology, and pricing. We also employ statistical techniques such as multilinear regression, exponential smoothing, moving average, ARIMA, and Monte Carlo simulations for accurate predictions. In econometric forecasting, we analyzed short-term and long-term event impacts, attributing values based on regulatory frameworks, economic factors, and market events.


 Speak to Our Analyst