North America Agriculture Robots Market by Type (Driverless Tractors, Unmanned Aerial Vehicles (UAVs), Milking Robots, Automated Harvest Robots, and Others), Offering (Hardware, Software, and Services), Farming Type (Indoor Farming and Outdoor Farming), Application (Dairy Management, Irrigation Management, Harvest Management, Soil Management, Inventory Management, and Others), and End User (Field Crops, Fruits & Vegetables, Livestock, and Others) – Opportunity Analysis and Industry Forecast 2023–2030

North America Agriculture Robots Market

Industry:  ICT & Media | Publish Date: Jul 2023 | No of Pages:  121 | No. Tables:  102 | No. Figures:  60

Market Definition

North America Agriculture Robots Market was valued at USD 2.32 billion in 2022, and is predicted to reach USD 7.40 billion by 2030, with a CAGR of 14.5% from 2023 to 2030.

Agricultural robots, also known as agribots or agri-robots, are machines designed to automate or semi-automate various tasks in the field of agriculture. The functionalities of these robots include planting, harvesting, monitoring, and spraying crops. These robots are developed to improve efficiency, productivity, and accuracy in agriculture while reducing the dependence on manual labor and enhancing working conditions for farmers. They utilize advanced technologies like computer vision, artificial intelligence (AI), and others.

Agribots are equipped with sensors, actuators, and intelligent algorithms that enable them to perceive their environment, make decisions, and carry out specific actions. These robots can navigate through fields using GPS or mapping technologies to perform tasks such as planting seeds, harvesting crops, applying pesticides or fertilizers, and monitoring crop health. They use computer vision to identify and differentiate between crops and weeds, detect pests or diseases, and make precise actions accordingly.

Growing Practice of Precision Farming 

Precision agriculture is playing a significant role in transforming the agricultural landscape in North America, driven by advancements in technology, increasing environmental concerns, and the need for sustainable agricultural practices. Precision farming, also known as precision agriculture, involves the use of data, sensors, and automation to optimize farming operations and maximize crop production while minimizing inputs and environmental impacts. According to the U.S Department of Agriculture in February 2023, Precision agriculture technologies have been steadily adopted in the United States, with estimates suggesting that around 80% of large-scale farms and over 50% of mid-sized farms have implemented some form of precision agriculture practices.


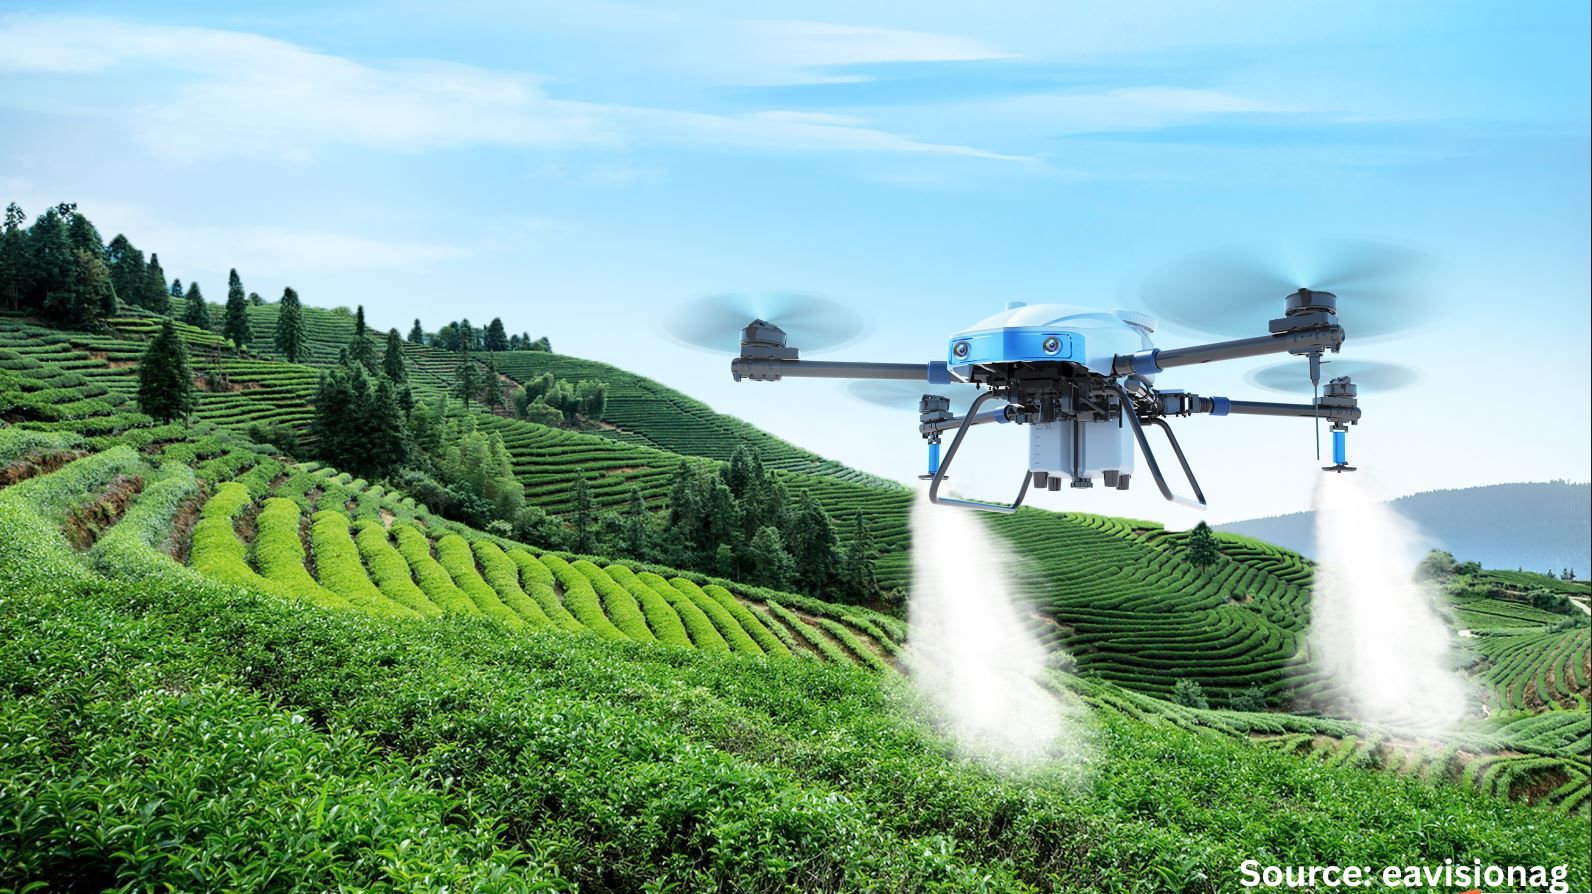
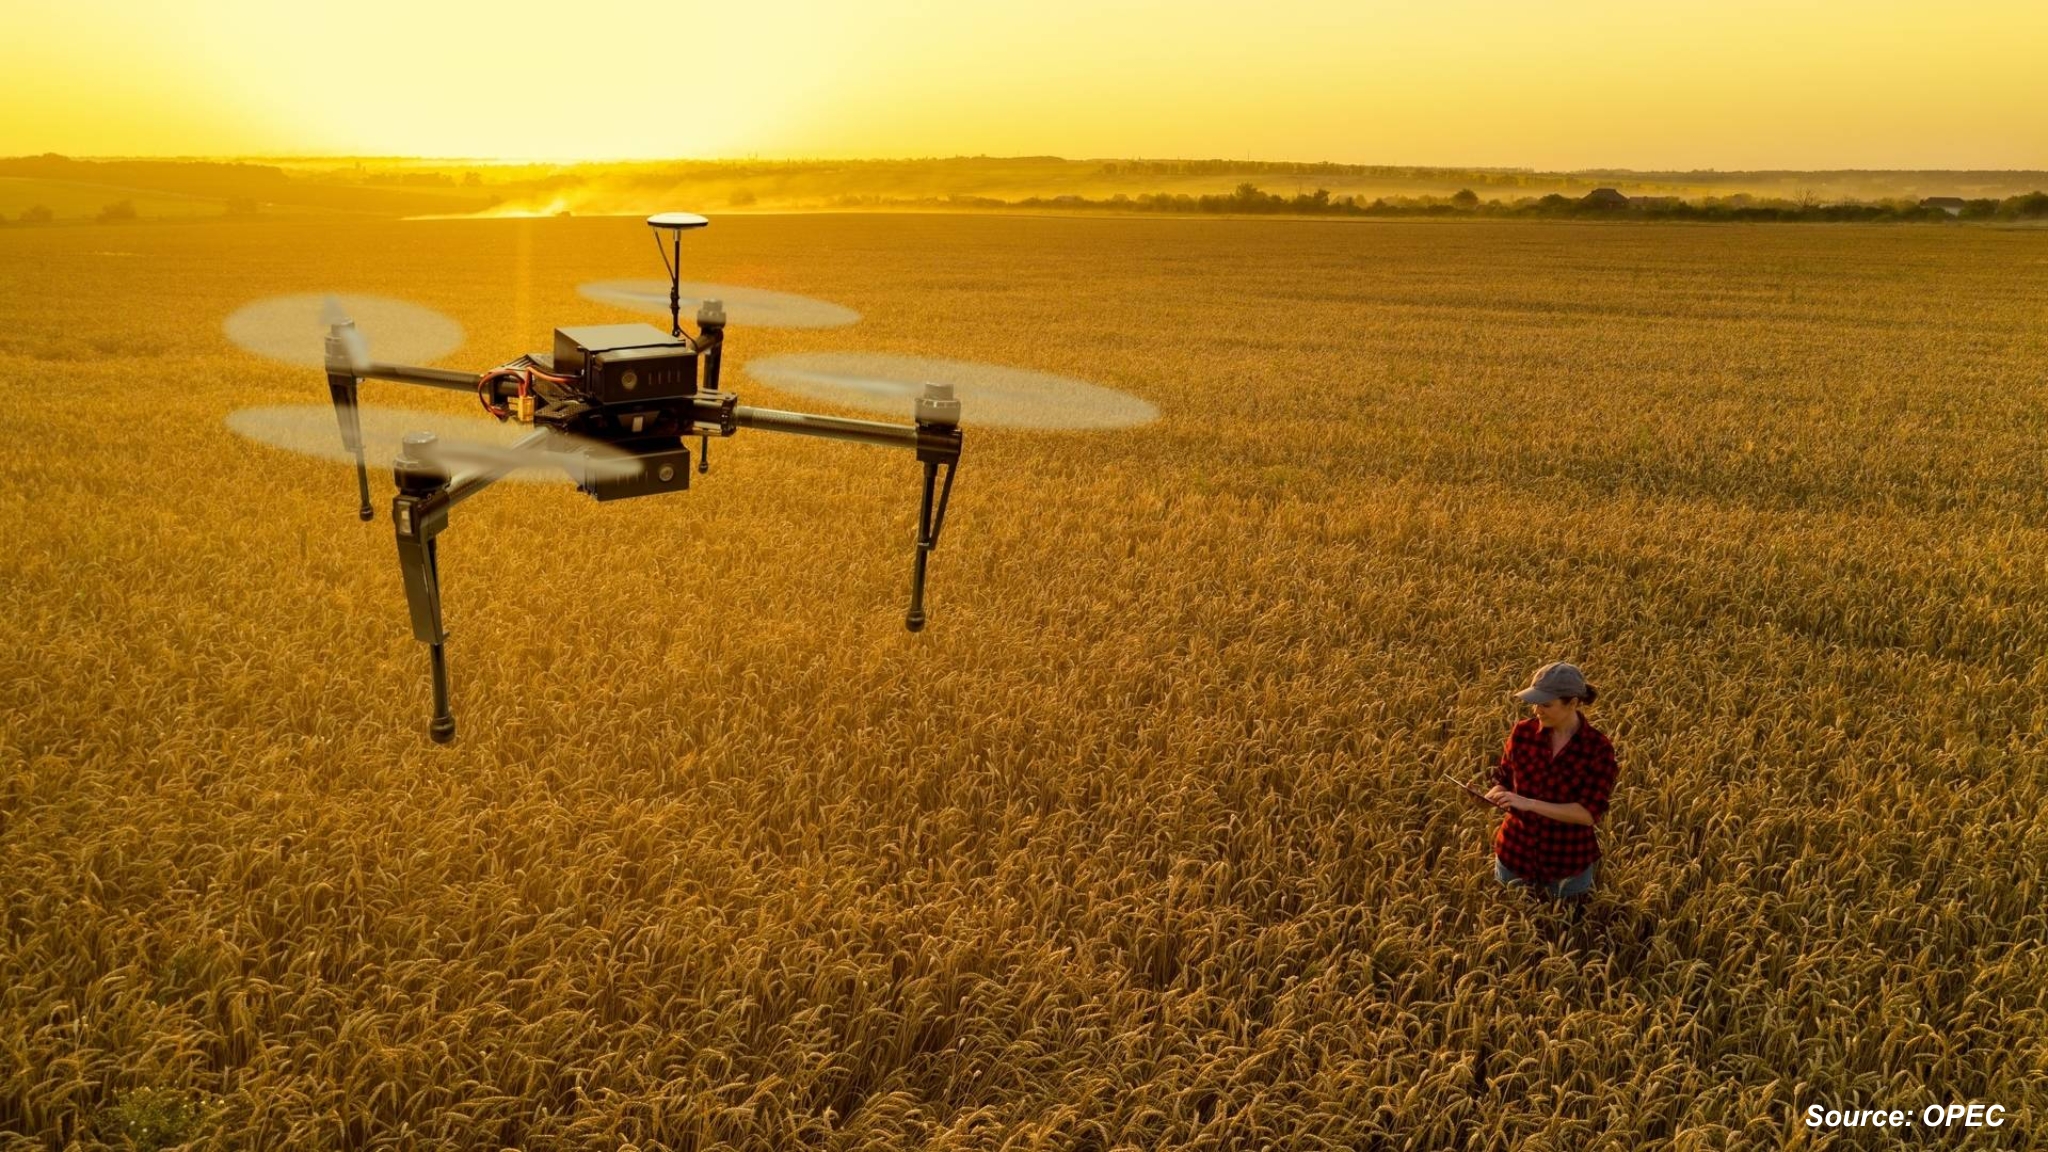
Increasing Penetration of UAV Usage in Agriculture

Unmanned aerial vehicles (UAVs) or drones are increasingly being utilized in agriculture due to their affordability and user-friendly nature. They enable the creation of time-series animations that accurately depict the crop's development over time.

The latest generation of agricultural drones is equipped with advanced technology, enabling functions such as pest control, monitoring of soil and crop conditions, mapping, and estimation of acreage and crop types. Drones are particularly beneficial in surveying areas where human access is limited.

This technology assists farmers in efficiently planning input usage, such as crop protection chemicals, by utilizing reliable detection methods and reducing monitoring costs. Effective farm assessment through drone usage contributes to the overall profitability of farmers. Thus, making unmanned aerial vehicles a driving force in the agricultural industry in North America.


Lack of Technical Expertise and High Initial Costs

The high initial expenses associated with acquiring agriculture robots, as well as the required equipment and infrastructure, pose a significant obstacle to the widespread adoption of these technologies in North America. This cost barrier can particularly impact smaller-scale farmers, limiting their ability to afford and access such robotic solutions. Furthermore, effectively utilizing agriculture robots necessitates specialized technical expertise, which may present challenges for farmers in terms of acquiring and maintaining the necessary knowledge and skills to operate and troubleshoot these advanced robotic systems. Consequently, the combination of limited technical expertise and high initial costs can impede the widespread adoption of agriculture robots in the region.

Growing Technological Advancements in the Region

The ongoing advancements in robotics such as artificial intelligence (AI), and sensor technologies offer significant opportunities for the development of advanced agriculture robots in North America. These technological advancements enable the creation of more sophisticated and capable robots that can revolutionize farming practices. This advancement is anticipated to drive substantial growth opportunities for the agriculture robots market.


Competitive Landscape

The agriculture robots industry includes several market players such as Verdant Robotics, Agrobotix LLC, DroneDeploy, Harvest Automation Inc., DeLaval Inc., Blue River Technology, John Deere, Lely Industries NV, EcoRobotix Ltd, and GEA Group. These market players are adopting various strategies such as innovation and collaboration to maintain their dominance in the market of North America.

For instance, in September 2022, GEA launched GEA Dairy Feed F4500, an autonomously driving feeding robot. This new feeding robot is designed to help dairy farms reduce their carbon footprint and operating costs while boosting flexibility on the farm.

Also, in January 2022, John Deere launched an autonomous tractor, which integrates Deere's 8R tractor, TruSet-enabled chisel plow, GPS guidance system, and innovative technologies. Farmers can expect to access the autonomous tractor later this year, marking a significant step forward in agricultural automation.

KEY BENEFITS

  • The North America agriculture robots market report provides a quantitative analysis of the current market and estimations through 2023-2030 that assists in identifying the prevailing market opportunities to capitalize on.

  • The study comprises a deep dive analysis of the market trend including the current and future trends for depicting the prevalent investment pockets in the market.

  • The information related to key drivers, restraints, and opportunities and their impact on the market is provided in the report.

  • The competitive analysis of the market players along with their market share in the North America agriculture robots market.

  • The SWOT analysis and Porter’s Five Forces model are elaborated in the study.

  • Value chain analysis in the market study provides a clear picture of the stakeholders’ roles.

NORTH AMERICA AGRICULTURE ROBOTS MARKET KEY SEGMENTS

By Component 

  • Driverless Tractors

  • Unmanned Aerial Vehicles (UAVs)

  • Milking Robots

  • Automated Harvest Robots

  • Others 

By Offering

  • Hardware

  • Software

  • Services

By Farming Type

  • Indoor Farming

  • Outdoor Farming

By Application

  • Dairy Management

  • Irrigation Management

  • Harvest Management

  • Soil Management

  • Inventory Management

  • Others 

By End User

  • Field Crops

  • Fruits & Vegetables

  • Livestock

  • Others

Test

1      INTRODUCTION

           1.1      REPORT DESCRIPTION

           1.2      RESEARCH METHODOLOGY

                         1.2.1      SECONDARY RESEARCH

                         1.2.2      DATA ANALYSIS FRAMEWORK

                         1.2.3      MARKET SIZE ESTIMATION

                         1.2.4      FORECASTING

                         1.2.5      PRIMARY RESEARCH AND DATA VALIDATION

2      NORTH AMERICA AGRICULTURE ROBOTS MARKET BY COMPONENT

           2.1      OVERVIEW

           2.2      DRIVERLESS TRACTORS

                         2.2.1      DRIVERLESS TRACTORS MARKET, BY COUNTRY

           2.3      UNMANNED AERIAL VEHICLES (UAVS)

                         2.3.1      UNMANNED AERIAL VEHICLES (UAVS) MARKET, BY COUNTRY

           2.4      MILKING ROBOTS

                         2.4.1      MILKING ROBOTS MARKET, BY COUNTRY

           2.5      AUTOMATED HARVEST ROBOTS

                         2.5.1      AUTOMATED HARVEST ROBOTS MARKET, BY COUNTRY

           2.6      OTHERS

                         2.6.1      OTHERS MARKET, BY COUNTRY

3      NORTH AMERICA AGRICULTURE ROBOTS MARKET BY OFFERING

           3.1      OVERVIEW

           3.2      HARDWARE

                         3.2.1      HARDWARE MARKET, BY COUNTRY

           3.3      SOFTWARE

                         3.3.1      SOFTWARE MARKET, BY COUNTRY

           3.4      SERVICES

                         3.4.1      SERVICES MARKET, BY COUNTRY

4      NORTH AMERICA AGRICULTURE ROBOTS MARKET BY FARMING TYPE

           4.1      OVERVIEW

           4.2      INDOOR FARMING

                         4.2.1      INDOOR FARMING MARKET, BY COUNTRY

           4.3      OUTDOOR FARMING

                         4.3.1      OUTDOOR FARMING MARKET, BY COUNTRY

5      NORTH AMERICA AGRICULTURE ROBOTS MARKET BY APPLICATION

           5.1      OVERVIEW

           5.2      DAIRY MANAGEMENT

                         5.2.1      DAIRY MANAGEMENT MARKET, BY COUNTRY

           5.3      IRRIGATION MANAGEMENT

                         5.3.1      IRRIGATION MANAGEMENT MARKET, BY COUNTRY

           5.4      HARVEST MANAGEMENT

                         5.4.1      HARVEST MANAGEMENT MARKET, BY COUNTRY

           5.5      SOIL MANAGEMENT

                         5.5.1      SOIL MANAGEMENT MARKET, BY COUNTRY

           5.6      INVENTORY MANAGEMENT

                         5.6.1      INVENTORY MANAGEMENT MARKET, BY COUNTRY

           5.7      OTHERS

                         5.7.1      OTHERS MARKET, BY COUNTRY

6    NORTH AMERICA AGRICULTURE ROBOTS MARKET BY END USER

           6.1      OVERVIEW

           6.2      FIELD CROPS

                         6.2.1      FIELD CROPS MARKET, BY COUNTRY

           6.3      FRUITS AND VEGETABLES

                         6.3.1      FRUITS AND VEGETABLES MARKET, BY COUNTRY

           6.4      LIVESTOCK

                         6.4.1      LIVESTOCK MARKET, BY COUNTRY

           6.5      OTHERS

                         6.5.1      OTHERS MARKET, BY COUNTRY

7   NORTH AMERICA AGRICULTURE ROBOTS MARKET, BY COUNTRY

           7.1   OVERVIEW

           7.2   UNITED STATES

                         7.2.1   NORTH AMERICA AGRICULTURE ROBOTS MARKET, BY COMPONENT

                         7.2.2   NORTH AMERICA AGRICULTURE ROBOTS MARKET, BY OFFERING

                         7.2.3   NORTH AMERICA AGRICULTURE ROBOTS MARKET, BY FARMING TYPE

                         7.2.4   NORTH AMERICA AGRICULTURE ROBOTS MARKET, BY APPLICATION

                         7.2.5   NORTH AMERICA AGRICULTURE ROBOTS MARKET, BY END USER

           7.3   CANADA

                         7.3.1   NORTH AMERICA AGRICULTURE ROBOTS MARKET, BY COMPONENT

                         7.3.2   NORTH AMERICA AGRICULTURE ROBOTS MARKET, BY OFFERING

                         7.3.3   NORTH AMERICA AGRICULTURE ROBOTS MARKET, BY FARMING TYPE

                         7.3.4   NORTH AMERICA AGRICULTURE ROBOTS MARKET, BY APPLICATION

                         7.3.5   NORTH AMERICA AGRICULTURE ROBOTS MARKET, BY END USER

           7.4   MEXICO

                         7.4.1   NORTH AMERICA AGRICULTURE ROBOTS MARKET, BY COMPONENT

                         7.4.2   NORTH AMERICA AGRICULTURE ROBOTS MARKET, BY OFFERING

                         7.4.3   NORTH AMERICA AGRICULTURE ROBOTS MARKET, BY FARMING TYPE

                         7.4.4   NORTH AMERICA AGRICULTURE ROBOTS MARKET, BY APPLICATION

                         7.4.5   NORTH AMERICA AGRICULTURE ROBOTS MARKET, BY END USER

8      COMPANY PROFILES

           8.1   GEA GROUP

                         8.1.1   COMPANY OVERVIEW

                         8.1.2   COMPANY SNAPSHOT

                         8.1.3   OPERATING BUSINESS SEGMENTS

                         8.1.4   PRODUCT PORTFOLIO

                         8.1.5   BUSINESS PERFORMANCE

                         8.1.6   BUSINESS SEGMENTS

                         8.1.7   GEOGRAPHIC SEGMENTS

                         8.1.8   KEY STRATEGIC MOVES AND DEVELOPMENT

                         8.1.9   PRIMARY MARKET COMPETITORS

           8.2   CNH INDUSTRIAL

                         8.2.1   COMPANY OVERVIEW

                         8.2.2   COMPANY SNAPSHOT

                         8.2.3   OPERATING BUSINESS SEGMENTS

                         8.2.4   PRODUCT PORTFOLIO

                         8.2.5   BUSINESS PERFORMANCE

                         8.2.6   BUSINESS SEGMENTS

                         8.2.7   GEOGRAPHIC SEGMENTS

                         8.2.8   KEY STRATEGIC MOVES AND DEVELOPMENT

                         8.2.9   PRIMARY MARKET COMPETITORS

           8.3   DELAVAL

                         8.3.1   COMPANY OVERVIEW

                         8.3.2   COMPANY SNAPSHOT

                         8.3.3   OPERATING BUSINESS SEGMENTS

                         8.3.4   PRODUCT PORTFOLIO

                         8.3.5   BUSINESS PERFORMANCE

                         8.3.6   BUSINESS SEGMENTS

                         8.3.7   GEOGRAPHIC SEGMENTS

                         8.3.8   KEY STRATEGIC MOVES AND DEVELOPMENT

                         8.3.9   PRIMARY MARKET COMPETITORS

           8.4   DEERE AND COMPANY

                         8.4.1   COMPANY OVERVIEW

                         8.4.2   COMPANY SNAPSHOT

                         8.4.3   OPERATING BUSINESS SEGMENTS

                         8.4.4   PRODUCT PORTFOLIO

                         8.4.5   BUSINESS PERFORMANCE

                         8.4.6   BUSINESS SEGMENTS

                         8.4.7   GEOGRAPHIC SEGMENTS

                         8.4.8   KEY STRATEGIC MOVES AND DEVELOPMENT

                         8.4.9   PRIMARY MARKET COMPETITORS

           8.5   AGCO CORPORATION

                         8.5.1   COMPANY OVERVIEW

                         8.5.2   COMPANY SNAPSHOT

                         8.5.3   OPERATING BUSINESS SEGMENTS

                         8.5.4   PRODUCT PORTFOLIO

                         8.5.5   BUSINESS PERFORMANCE

                         8.5.6   BUSINESS SEGMENTS

                         8.5.7   GEOGRAPHIC SEGMENTS

                         8.5.8   KEY STRATEGIC MOVES AND DEVELOPMENT

                         8.5.9   PRIMARY MARKET COMPETITORS

           8.6   TRIMBLE INC.

                         8.6.1   COMPANY OVERVIEW

                         8.6.2   COMPANY SNAPSHOT

                         8.6.3   OPERATING BUSINESS SEGMENTS

                         8.6.4   PRODUCT PORTFOLIO

                         8.6.5   BUSINESS PERFORMANCE

                         8.6.6   BUSINESS SEGMENTS

                         8.6.7   GEOGRAPHIC SEGMENTS

                         8.6.8   KEY STRATEGIC MOVES AND DEVELOPMENT

                         8.6.9   PRIMARY MARKET COMPETITORS

           8.7   NAIO TECHNOLOGIES

                         8.7.1   COMPANY OVERVIEW

                         8.7.2   COMPANY SNAPSHOT

                         8.7.3   OPERATING BUSINESS SEGMENTS

                         8.7.4   PRODUCT PORTFOLIO

                         8.7.5   BUSINESS PERFORMANCE

                         8.7.6   BUSINESS SEGMENTS

                         8.7.7   GEOGRAPHIC SEGMENTS

                         8.7.8   KEY STRATEGIC MOVES AND DEVELOPMENT

                         8.7.9   PRIMARY MARKET COMPETITORS

           8.8   YANMAR HOLDINGS CO. LTD.

                         8.8.1   COMPANY OVERVIEW

                         8.8.2   COMPANY SNAPSHOT

                         8.8.3   OPERATING BUSINESS SEGMENTS

                         8.8.4   PRODUCT PORTFOLIO

                         8.8.5   BUSINESS PERFORMANCE

                         8.8.6   BUSINESS SEGMENTS

                         8.8.7   GEOGRAPHIC SEGMENTS

                         8.8.8   KEY STRATEGIC MOVES AND DEVELOPMENT

                         8.8.9   PRIMARY MARKET COMPETITORS

           8.9   SZ DJI TECHNOLOGY CO. LTD.

                         8.9.1   COMPANY OVERVIEW

                         8.9.2   COMPANY SNAPSHOT

                         8.9.3   OPERATING BUSINESS SEGMENTS

                         8.9.4   PRODUCT PORTFOLIO

                         8.9.5   BUSINESS PERFORMANCE

                         8.9.6   BUSINESS SEGMENTS

                         8.9.7   GEOGRAPHIC SEGMENTS

                         8.9.8   KEY STRATEGIC MOVES AND DEVELOPMENT

                         8.9.9   PRIMARY MARKET COMPETITORS

           8.10   BOUMATIC

                         8.10.1   COMPANY OVERVIEW

                         8.10.2   COMPANY SNAPSHOT

                         8.10.3   OPERATING BUSINESS SEGMENTS

                         8.10.4   PRODUCT PORTFOLIO

                         8.10.5   BUSINESS PERFORMANCE

                         8.10.6   BUSINESS SEGMENTS

                         8.10.7   GEOGRAPHIC SEGMENTS

                         8.10.8   KEY STRATEGIC MOVES AND DEVELOPMENT

                         8.10.9   PRIMARY MARKET COMPETITORS

           8.11   HARVEST AUTOMATION INC

                         8.11.1   COMPANY OVERVIEW

                         8.11.2   COMPANY SNAPSHOT

                         8.11.3   OPERATING BUSINESS SEGMENTS

                         8.11.4   PRODUCT PORTFOLIO

                         8.11.5   BUSINESS PERFORMANCE

                         8.11.6   BUSINESS SEGMENTS

                         8.11.7   GEOGRAPHIC SEGMENTS

                         8.11.8   KEY STRATEGIC MOVES AND DEVELOPMENT

                         8.11.9   PRIMARY MARKET COMPETITORS

           8.12   AUTONOMOUS SOLUTION INC

                         8.12.1   COMPANY OVERVIEW

                         8.12.2   COMPANY SNAPSHOT

                         8.12.3   OPERATING BUSINESS SEGMENTS

                         8.12.4   PRODUCT PORTFOLIO

                         8.12.5   BUSINESS PERFORMANCE

                         8.12.6   BUSINESS SEGMENTS

                         8.12.7   GEOGRAPHIC SEGMENTS

                         8.12.8   KEY STRATEGIC MOVES AND DEVELOPMENT

                         8.12.9   PRIMARY MARKET COMPETITORS

           8.13   CLEARPATH ROBOTICS

                         8.13.1   COMPANY OVERVIEW

                         8.13.2   COMPANY SNAPSHOT

                         8.13.3   OPERATING BUSINESS SEGMENTS

                         8.13.4   PRODUCT PORTFOLIO

                         8.13.5   BUSINESS PERFORMANCE

                         8.13.6   BUSINESS SEGMENTS

                         8.13.7   GEOGRAPHIC SEGMENTS

                         8.13.8   KEY STRATEGIC MOVES AND DEVELOPMENT

                         8.13.9   PRIMARY MARKET COMPETITORS

           8.14   AGEAGLE AERIAL SYSTEM

                         8.14.1   COMPANY OVERVIEW

                         8.14.2   COMPANY SNAPSHOT

                         8.14.3   OPERATING BUSINESS SEGMENTS

                         8.14.4   PRODUCT PORTFOLIO

                         8.14.5   BUSINESS PERFORMANCE

                         8.14.6   BUSINESS SEGMENTS

                         8.14.7   GEOGRAPHIC SEGMENTS

                         8.14.8   KEY STRATEGIC MOVES AND DEVELOPMENT

                         8.14.9   PRIMARY MARKET COMPETITORS

           8.15   KUBOTA CORPORATION

                         8.15.1   COMPANY OVERVIEW

                         8.15.2   COMPANY SNAPSHOT

                         8.15.3   OPERATING BUSINESS SEGMENTS

                         8.15.4   PRODUCT PORTFOLIO

                         8.15.5   BUSINESS PERFORMANCE

                         8.15.6   BUSINESS SEGMENTS

                         8.15.7   GEOGRAPHIC SEGMENTS

                         8.15.8   KEY STRATEGIC MOVES AND DEVELOPMENT

                         8.15.9   PRIMARY MARKET COMPETITOR

LIST OF TABLES

TABLE 1. NORTH AMERICA AGRICULTURE ROBOTS MARKET VALUE, BY TYPE, 2022-2030, MILLION USD

TABLE 2. NORTH AMERICA AGRICULTURE ROBOTS MARKET VOLUME, BY TYPE, 2022-2030, UNITS

TABLE 3. NORTH AMERICA AGRICULTURE ROBOTS MARKET VALUE, BY OFFERING, 2022-2030, MILLION USD

TABLE 4. NORTH AMERICA AGRICULTURE ROBOTS MARKET VALUE, BY FARMING TYPE, 2022-2030, MILLION USD

TABLE 5. NORTH AMERICA AGRICULTURE ROBOTS MARKET VOLUME, BY FARMING TYPE, 2022-2030, UNITS

TABLE 6. NORTH AMERICA AGRICULTURE ROBOTS MARKET VALUE, BY APPLICATION, 2022-2030, MILLION USD

TABLE 7. NORTH AMERICA AGRICULTURE ROBOTS MARKET VOLUME, BY APPLICATION, 2022-2030, UNITS

TABLE 8. NORTH AMERICA AGRICULTURE ROBOTS MARKET VALUE, BY END USE, 2022-2030, MILLION USD

TABLE 9. NORTH AMERICA AGRICULTURE ROBOTS MARKET VOLUME, BY END USE, 2022-2030, UNITS

TABLE 10. NORTH AMERICA AGRICULTURE ROBOTS MARKET VALUE, BY COUNTRY, 2022-2030, MILLION USD

TABLE 11. NORTH AMERICA AGRICULTURE ROBOTS MARKET VOLUME, BY COUNTRY, 2022-2030, UNITS

TABLE 12. U.S. AGRICULTURE ROBOTS MARKET VALUE, BY TYPE, 2022-2030, MILLION USD

TABLE 13. U.S. AGRICULTURE ROBOTS MARKET VOLUME, BY TYPE, 2022-2030, UNITS

TABLE 14. U.S. AGRICULTURE ROBOTS MARKET VALUE, BY OFFERING, 2022-2030, MILLION USD

TABLE 15. U.S. AGRICULTURE ROBOTS MARKET VALUE, BY FARMING TYPE, 2022-2030, MILLION USD

TABLE 16. U.S. AGRICULTURE ROBOTS MARKET VOLUME, BY FARMING TYPE, 2022-2030, UNITS

TABLE 17. U.S. AGRICULTURE ROBOTS MARKET VALUE, BY APPLICATION, 2022-2030, MILLION USD

TABLE 18. U.S. AGRICULTURE ROBOTS MARKET VOLUME, BY APPLICATION, 2022-2030, UNITS

TABLE 19. U.S. AGRICULTURE ROBOTS MARKET VALUE, BY END USE, 2022-2030, MILLION USD

TABLE 20. U.S. AGRICULTURE ROBOTS MARKET VOLUME, BY END USE, 2022-2030, UNITS

TABLE 21. CANADA AGRICULTURE ROBOTS MARKET VALUE, BY TYPE, 2022-2030, MILLION USD

TABLE 22. CANADA AGRICULTURE ROBOTS MARKET VOLUME, BY TYPE, 2022-2030, UNITS

TABLE 23. CANADA AGRICULTURE ROBOTS MARKET VALUE, BY OFFERING, 2022-2030, MILLION USD

TABLE 24. CANADA AGRICULTURE ROBOTS MARKET VALUE, BY FARMING TYPE, 2022-2030, MILLION USD

TABLE 25. CANADA AGRICULTURE ROBOTS MARKET VOLUME, BY FARMING TYPE, 2022-2030, UNITS

TABLE 26. CANADA AGRICULTURE ROBOTS MARKET VALUE, BY APPLICATION, 2022-2030, MILLION USD

TABLE 27. CANADA AGRICULTURE ROBOTS MARKET VOLUME, BY APPLICATION, 2022-2030, UNITS

TABLE 28. CANADA AGRICULTURE ROBOTS MARKET VALUE, BY END USE, 2022-2030, MILLION USD

TABLE 29. CANADA AGRICULTURE ROBOTS MARKET VOLUME, BY END USE, 2022-2030, UNITS

TABLE 30. MEXICO AGRICULTURE ROBOTS MARKET VALUE, BY TYPE, 2022-2030, MILLION USD

TABLE 31. MEXICO AGRICULTURE ROBOTS MARKET VOLUME, BY TYPE, 2022-2030, UNITS

TABLE 32. MEXICO AGRICULTURE ROBOTS MARKET VALUE, BY OFFERING, 2022-2030, MILLION USD

TABLE 33. MEXICO AGRICULTURE ROBOTS MARKET VALUE, BY FARMING TYPE, 2022-2030, MILLION USD

TABLE 34. MEXICO AGRICULTURE ROBOTS MARKET VOLUME, BY FARMING TYPE, 2022-2030, UNITS

TABLE 35. MEXICO AGRICULTURE ROBOTS MARKET VALUE, BY APPLICATION, 2022-2030, MILLION USD

TABLE 36. MEXICO AGRICULTURE ROBOTS MARKET VOLUME, BY APPLICATION, 2022-2030, UNITS

TABLE 37. MEXICO AGRICULTURE ROBOTS MARKET VALUE, BY END USE, 2022-2030, MILLION USD

TABLE 38. MEXICO AGRICULTURE ROBOTS MARKET VOLUME, BY END USE, 2022-2030, UNITS

TABLE 39. GEA GROUP: COMPANY SNAPSHOT

TABLE 40. GEA GROUP: OPERATING SEGMENTS

TABLE 41. GEA GROUP: PRODUCT PORTFOLIO

TABLE 42. GEA GROUP: BUSINESS SEGMENT

TABLE 43. GEA GROUP: GEOGRAPHIC SEGMENT

TABLE 44. GEA GROUP: KEY STRATEGIC MOVES & DEVELOPMENTS

TABLE 45. CNH INDUSTRIAL: COMPANY SNAPSHOT

TABLE 46. CNH INDUSTRIAL: OPERATING SEGMENTS

TABLE 47. CNH INDUSTRIAL: PRODUCT PORTFOLIO

TABLE 48. CNH INDUSTRIAL: BUSINESS SEGMENT

TABLE 49. CNH INDUSTRIAL: GEOGRAPHIC SEGMENT

TABLE 50. CNH INDUSTRIAL: KEY STRATEGIC MOVES & DEVELOPMENTS

TABLE 51. DELAVAL: COMPANY SNAPSHOT

TABLE 52. DELAVAL: PRODUCT PORTFOLIO

TABLE 53. DELAVAL: KEY STRATEGIC MOVES & DEVELOPMENTS

TABLE 54. DEERE & COMPANY: COMPANY SNAPSHOT

TABLE 55. DEERE & COMPANY: OPERATING SEGMENTS

TABLE 56. DEERE & COMPANY: PRODUCT PORTFOLIO

TABLE 57. DEERE & COMPANY: BUSINESS SEGMENT

TABLE 58. DEERE & COMPANY: GEOGRAPHIC SEGMENT

TABLE 59. DEERE & COMPANY: KEY STRATEGIC MOVES & DEVELOPMENTS

TABLE 60. AGCO CORPORATION: COMPANY SNAPSHOT

TABLE 61. AGCO CORPORATION: OPERATING SEGMENTS

TABLE 62. AGCO CORPORATION: PRODUCT PORTFOLIO

TABLE 63. AGCO CORPORATION: GEOGRAPHIC SEGMENT

TABLE 64. AGCO CORPORATION: KEY STRATEGIC MOVES & DEVELOPMENTS

TABLE 65. TRIMBLE INC: COMPANY SNAPSHOT

TABLE 66. TRIMBLE INC: OPERATING SEGMENTS

TABLE 67. TRIMBLE INC: PRODUCT PORTFOLIO

TABLE 68. TRIMBLE INC: BUSINESS SEGMENT

TABLE 69. TRIMBLE INC: GEOGRAPHIC SEGMENT

TABLE 70. TRIMBLE INC: KEY STRATEGIC MOVES & DEVELOPMENTS

TABLE 71. NAIO TECHNOLOGIES: COMPANY SNAPSHOT

TABLE 72. NAIO TECHNOLOGIES: PRODUCT PORTFOLIO

TABLE 73. NAIO TECHNOLOGIES: KEY STRATEGIC MOVES & DEVELOPMENTS

TABLE 74. YANMAR HOLDINGS CO. LTD.: COMPANY SNAPSHOT

TABLE 75. YANMAR HOLDINGS CO. LTD.: PRODUCT PORTFOLIO

TABLE 76. YANMAR HOLDINGS CO. LTD.: KEY STRATEGIC MOVES & DEVELOPMENTS

TABLE 77. SZ DJI TECHNOLOGY CO. LTD.: COMPANY SNAPSHOT

TABLE 78. SZ DJI TECHNOLOGY CO. LTD.: PRODUCT PORTFOLIO

TABLE 79. SZ DJI TECHNOLOGY CO. LTD.: KEY STRATEGIC MOVES & DEVELOPMENTS

TABLE 80. BOUMATIC: COMPANY SNAPSHOT

TABLE 81. BOUMATIC: PRODUCT PORTFOLIO

TABLE 82. BOUMATIC: KEY STRATEGIC MOVES & DEVELOPMENTS

TABLE 83. HARVEST AUTOMATION INC: COMPANY SNAPSHOT

TABLE 84. HARVEST AUTOMATION INC: PRODUCT PORTFOLIO

TABLE 85. AUTONOMOUS SOLUTION INC: COMPANY SNAPSHOT

TABLE 86. AUTONOMOUS SOLUTION INC: PRODUCT PORTFOLIO

TABLE 87. AUTONOMOUS SOLUTION INC: KEY STRATEGIC MOVES & DEVELOPMENTS

TABLE 88. CLEARPATH ROBOTICS: COMPANY SNAPSHOT

TABLE 89. CLEARPATH ROBOTICS: PRODUCT PORTFOLIO

TABLE 90. CLEARPATH ROBOTICS: KEY STRATEGIC MOVES & DEVELOPMENTS

TABLE 91. AGEAGLE AERIAL SYSTEM: COMPANY SNAPSHOT

TABLE 92. AGEAGLE AERIAL SYSTEM: OPERATING SEGMENTS

TABLE 93. AGEAGLE AERIAL SYSTEM: PRODUCT PORTFOLIO

TABLE 94. AGEAGLE AERIAL SYSTEM: BUSINESS SEGMENT

TABLE 95. AGEAGLE AERIAL SYSTEM: GEOGRAPHIC SEGMENT

TABLE 96. AGEAGLE AERIAL SYSTEM: KEY STRATEGIC MOVES & DEVELOPMENTS

TABLE 97. KUBOTA CORPORATION: COMPANY SNAPSHOT

TABLE 98. KUBOTA CORPORATION: OPERATING SEGMENTS

TABLE 99. KUBOTA CORPORATION: PRODUCT PORTFOLIO

TABLE 100. KUBOTA CORPORATION: BUSINESS SEGMENT

TABLE 101. KUBOTA CORPORATION: GEOGRAPHIC SEGMENT

TABLE 102. KUBOTA CORPORATION: KEY STRATEGIC MOVES & DEVELOPMENTS

LIST OF FIGURES

FIGURE 1. NORTH AMERICA AGRICULTURE ROBOTS MARKET VALUE, BY TYPE, 2022-2030, MILLION USD

FIGURE 2. NORTH AMERICA AGRICULTURE ROBOTS MARKET VOLUME, BY TYPE, 2022-2030, UNITS

FIGURE 3. NORTH AMERICA AGRICULTURE ROBOTS MARKET VALUE, BY OFFERING, 2022-2030, MILLION USD

FIGURE 4. NORTH AMERICA AGRICULTURE ROBOTS MARKET VALUE, BY FARMING TYPE, 2022-2030, MILLION USD

FIGURE 5. NORTH AMERICA AGRICULTURE ROBOTS MARKET VOLUME, BY FARMING TYPE, 2022-2030, UNITS

FIGURE 6. NORTH AMERICA AGRICULTURE ROBOTS MARKET VALUE, BY APPLICATION, 2022-2030, MILLION USD

FIGURE 7. NORTH AMERICA AGRICULTURE ROBOTS MARKET VOLUME, BY APPLICATION, 2022-2030, UNITS

FIGURE 8. NORTH AMERICA AGRICULTURE ROBOTS MARKET VALUE, BY END USE, 2022-2030, MILLION USD

FIGURE 9. NORTH AMERICA AGRICULTURE ROBOTS MARKET VOLUME, BY END USE, 2022-2030, UNITS

FIGURE 10. NORTH AMERICA AGRICULTURE ROBOTS MARKET VALUE, BY COUNTRY, 2022-2030, MILLION USD

FIGURE 11. NORTH AMERICA AGRICULTURE ROBOTS MARKET VOLUME, BY COUNTRY, 2022-2030, UNITS

FIGURE 12. U.S. AGRICULTURE ROBOTS MARKET VALUE, BY TYPE, 2022-2030, MILLION USD

FIGURE 13. U.S. AGRICULTURE ROBOTS MARKET VOLUME, BY TYPE, 2022-2030, UNITS

FIGURE 14. U.S. AGRICULTURE ROBOTS MARKET VALUE, BY OFFERING, 2022-2030, MILLION USD

FIGURE 15. U.S. AGRICULTURE ROBOTS MARKET VALUE, BY FARMING TYPE, 2022-2030, MILLION USD

FIGURE 16. U.S. AGRICULTURE ROBOTS MARKET VOLUME, BY FARMING TYPE, 2022-2030, UNITS

FIGURE 17. U.S. AGRICULTURE ROBOTS MARKET VALUE, BY APPLICATION, 2022-2030, MILLION USD

FIGURE 18. U.S. AGRICULTURE ROBOTS MARKET VOLUME, BY APPLICATION, 2022-2030, UNITS

FIGURE 19. U.S. AGRICULTURE ROBOTS MARKET VALUE, BY END USE, 2022-2030, MILLION USD

FIGURE 20. U.S. AGRICULTURE ROBOTS MARKET VOLUME, BY END USE, 2022-2030, UNITS

FIGURE 21. CANADA AGRICULTURE ROBOTS MARKET VALUE, BY TYPE, 2022-2030, MILLION USD

FIGURE 22. CANADA AGRICULTURE ROBOTS MARKET VOLUME, BY TYPE, 2022-2030, UNITS

FIGURE 23. CANADA AGRICULTURE ROBOTS MARKET VALUE, BY OFFERING, 2022-2030, MILLION USD

FIGURE 24. CANADA AGRICULTURE ROBOTS MARKET VALUE, BY FARMING TYPE, 2022-2030, MILLION USD

FIGURE 25. CANADA AGRICULTURE ROBOTS MARKET VOLUME, BY FARMING TYPE, 2022-2030, UNITS

FIGURE 26. CANADA AGRICULTURE ROBOTS MARKET VALUE, BY APPLICATION, 2022-2030, MILLION USD

FIGURE 27. CANADA AGRICULTURE ROBOTS MARKET VOLUME, BY APPLICATION, 2022-2030, UNITS

FIGURE 28. CANADA AGRICULTURE ROBOTS MARKET VALUE, BY END USE, 2022-2030, MILLION USD

FIGURE 29. CANADA AGRICULTURE ROBOTS MARKET VOLUME, BY END USE, 2022-2030, UNITS

FIGURE 30. MEXICO AGRICULTURE ROBOTS MARKET VALUE, BY TYPE, 2022-2030, MILLION USD

FIGURE 31. MEXICO AGRICULTURE ROBOTS MARKET VOLUME, BY TYPE, 2022-2030, UNITS

FIGURE 32. MEXICO AGRICULTURE ROBOTS MARKET VALUE, BY OFFERING, 2022-2030, MILLION USD

FIGURE 33. MEXICO AGRICULTURE ROBOTS MARKET VALUE, BY FARMING TYPE, 2022-2030, MILLION USD

FIGURE 34. MEXICO AGRICULTURE ROBOTS MARKET VOLUME, BY FARMING TYPE, 2022-2030, UNITS

FIGURE 35. MEXICO AGRICULTURE ROBOTS MARKET VALUE, BY APPLICATION, 2022-2030, MILLION USD

FIGURE 36. MEXICO AGRICULTURE ROBOTS MARKET VOLUME, BY APPLICATION, 2022-2030, UNITS

FIGURE 37. MEXICO AGRICULTURE ROBOTS MARKET VALUE, BY END USE, 2022-2030, MILLION USD

FIGURE 38. MEXICO AGRICULTURE ROBOTS MARKET VOLUME, BY END USE, 2022-2030, UNITS

FIGURE 39. GEA GROUP: NET SALES, 2019–2021 ($MILLION)

FIGURE 40. GEA GROUP: PRIMARY MARKET COMPETITORS

FIGURE 41. CNH INDUSTRIAL: NET SALES, 2019–2021 ($MILLION)

FIGURE 42. CNH INDUSTRIAL: PRIMARY MARKET COMPETITORS

FIGURE 43. DELAVAL: PRIMARY MARKET COMPETITORS

FIGURE 44. DEERE & COMPANY: NET SALES, 2019–2021 ($MILLION)

FIGURE 45. DEERE & COMPANY: PRIMARY MARKET COMPETITORS

FIGURE 46. AGCO CORPORATION: NET SALES, 2019–2021 ($MILLION)

FIGURE 47. AGCO CORPORATION: PRIMARY MARKET COMPETITORS

FIGURE 48. TRIMBLE INC: NET SALES, 2019–2021 ($MILLION)

FIGURE 49. TRIMBLE INC: PRIMARY MARKET COMPETITORS

FIGURE 50. NAIO TECHNOLOGIES: PRIMARY MARKET COMPETITORS

FIGURE 51. YANMAR HOLDINGS CO. LTD.: PRIMARY MARKET COMPETITORS

FIGURE 52. SZ DJI TECHNOLOGY CO. LTD.: PRIMARY MARKET COMPETITORS

FIGURE 53. BOUMATIC: PRIMARY MARKET COMPETITORS

FIGURE 54. HARVEST AUTOMATION INC: PRIMARY MARKET COMPETITORS

FIGURE 55. AUTONOMOUS SOLUTION INC: PRIMARY MARKET COMPETITORS

FIGURE 56. CLEARPATH ROBOTICS: PRIMARY MARKET COMPETITORS

FIGURE 57. AGEAGLE AERIAL SYSTEM: NET SALES, 2019–2021 ($MILLION)

FIGURE 58. AGEAGLE AERIAL SYSTEM: PRIMARY MARKET COMPETITORS

FIGURE 59. KUBOTA CORPORATION: NET SALES, 2019–2021 ($MILLION)

FIGURE 60. KUBOTA CORPORATION: PRIMARY MARKET COMPETITORS

KEY PLAYERS

  • GEA Group

  • CNH Industrial

  • Delaval

  • Deere & Company

  • AGCO Corporation

  • Trimble Inc.

  • Naio Technologies

  • Yanmar Holdings Co. Ltd.

  • SZ DJI Technology Co. Ltd.

  • Boumatic

  • Harvest Automation Inc

  • Autonomous Solution Inc

  • Clearpath Robotics

  • Ageagle Aerial System

  • Kubota Corporation


Frequently Asked Questions
What will be the worth of North America agriculture robots market by the end of 2030?

According to the report published by Next Move Strategy Consulting, the North America agriculture robots market business is expected to hit at $7.40 billion (USD) by 2030.

Which are the top companies in the North America agriculture robots industry?

Verdant Robotics, Agrobotix LLC, DroneDeploy, Harvest Automation Inc., DeLaval Inc., Blue River Technology, John Deere, Lely Industries NV, EcoRobotix Ltd, and GEA Group.

What are the market segmentations and scope of the study?

The North America agriculture robots market share analysis is based on component, offering, farming type, application, end-user, and geography.

What are the key factors that contribute to the expansion of the agriculture robots market in North America?

The growth of the agriculture robots market in North America is driven by several key factors, including rising labor costs, advancements in technology, the need for enhanced productivity and efficiency, and the increasing demand for precision agriculture.

What are the factors that are holding back the growth of the agriculture robots market in North America?

The growth of the agriculture robots market in the United States is being impeded by several key factors, including the need for significant upfront investment, the complexity involved in implementing these robots, and the absence of standardized industry practices.