Renewable Energy Insurance Market Size, Share, and Trends Analysis – Coverage Type (Property Damage & Business Interruption, Liability Insurance, & Others), Technology (Onshore Wind, Offshore Wind, Utility Scale Solar PV, & Others), Project Phase (Construction, Operational, Decommissioning Phase Insurance), End User (Independent Power Producers, Utilities, and Others) Distribution Channel (Direct Underwriting, & Broker Intermediated) and Region — Global Industry Report and Forecast, 2026–2035
Industry: BFSI | Publishing Date: August 4, 2026 | Last Updated: August 4, 2026 | No of Pages: N/A | No. of Tables: N/A | No. of Figures: N/A | Format: PDF | Report Code: BF5542
What Is the Renewable Energy Insurance Market Size?
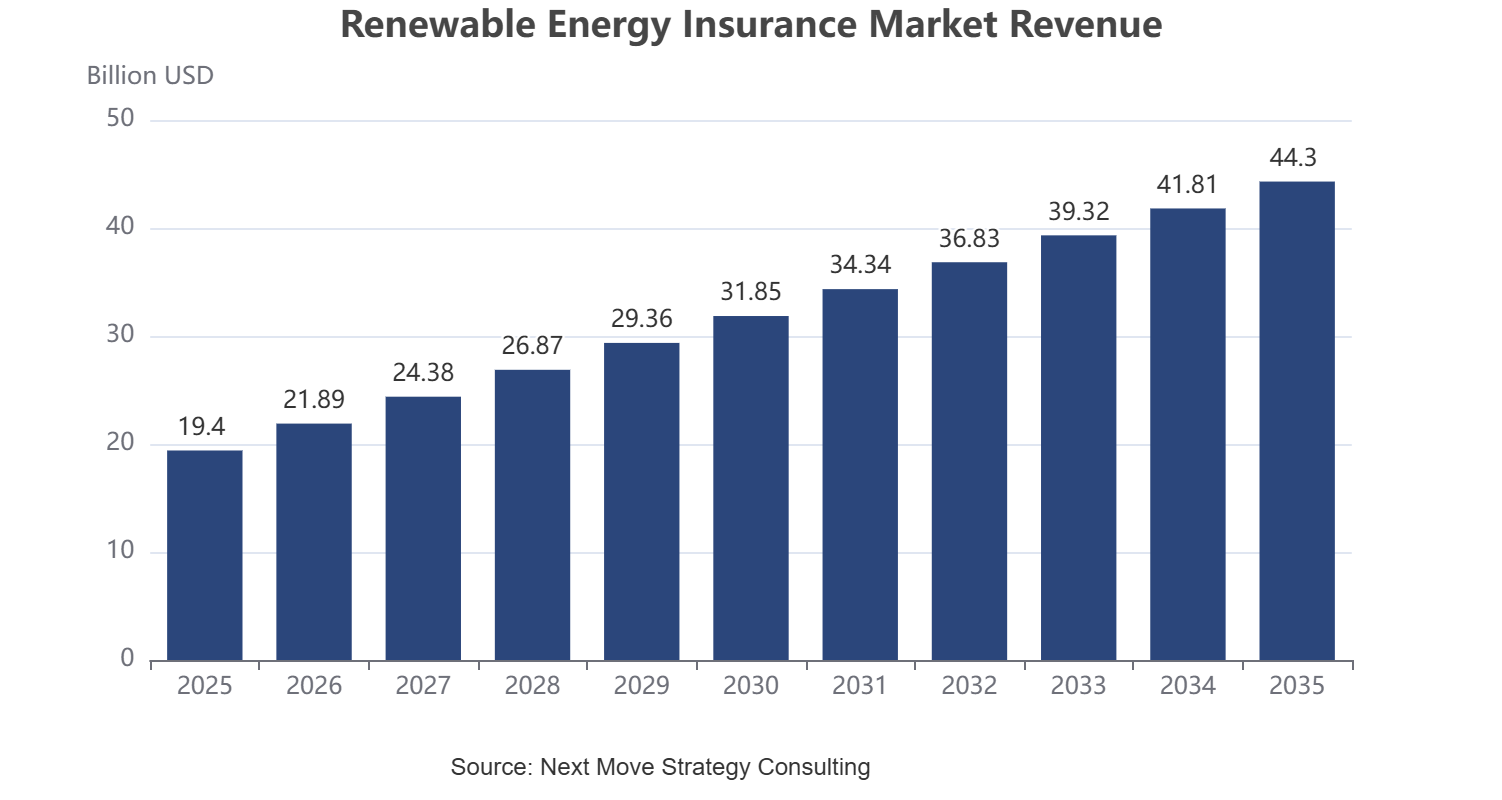
The global Renewable Energy Insurance Market size was valued at USD 19.4 Billion in 2025 and is estimated to reach USD 20.9 Billion in 2026, further advancing to USD 44.3 Billion by 2035, registering a CAGR of 8.7% between 2026 and 2035. Europe led the market with an approximate 34% share in 2025, while Property Damage & Business Interruption insurance dominated coverage types with an approximate 38% share.
|
Key Takeaways |
|
By Coverage Type: Property Damage & Business Interruption Insurance held the largest share, expanding from USD 7.4 billion in 2025 to USD 15.8 billion by 2035; Performance and Revenue Guarantee Insurance is the fastest-growing sub-segment at 10.6% CAGR from 2026–2035. |
|
By Technology Segment: Utility-Scale Solar PV held the largest share, expanding from USD 5.9 billion in 2025 to USD 13.9 billion by 2035; Offshore Wind is the fastest-growing sub-segment at 11.9% CAGR from 2026–2035. |
|
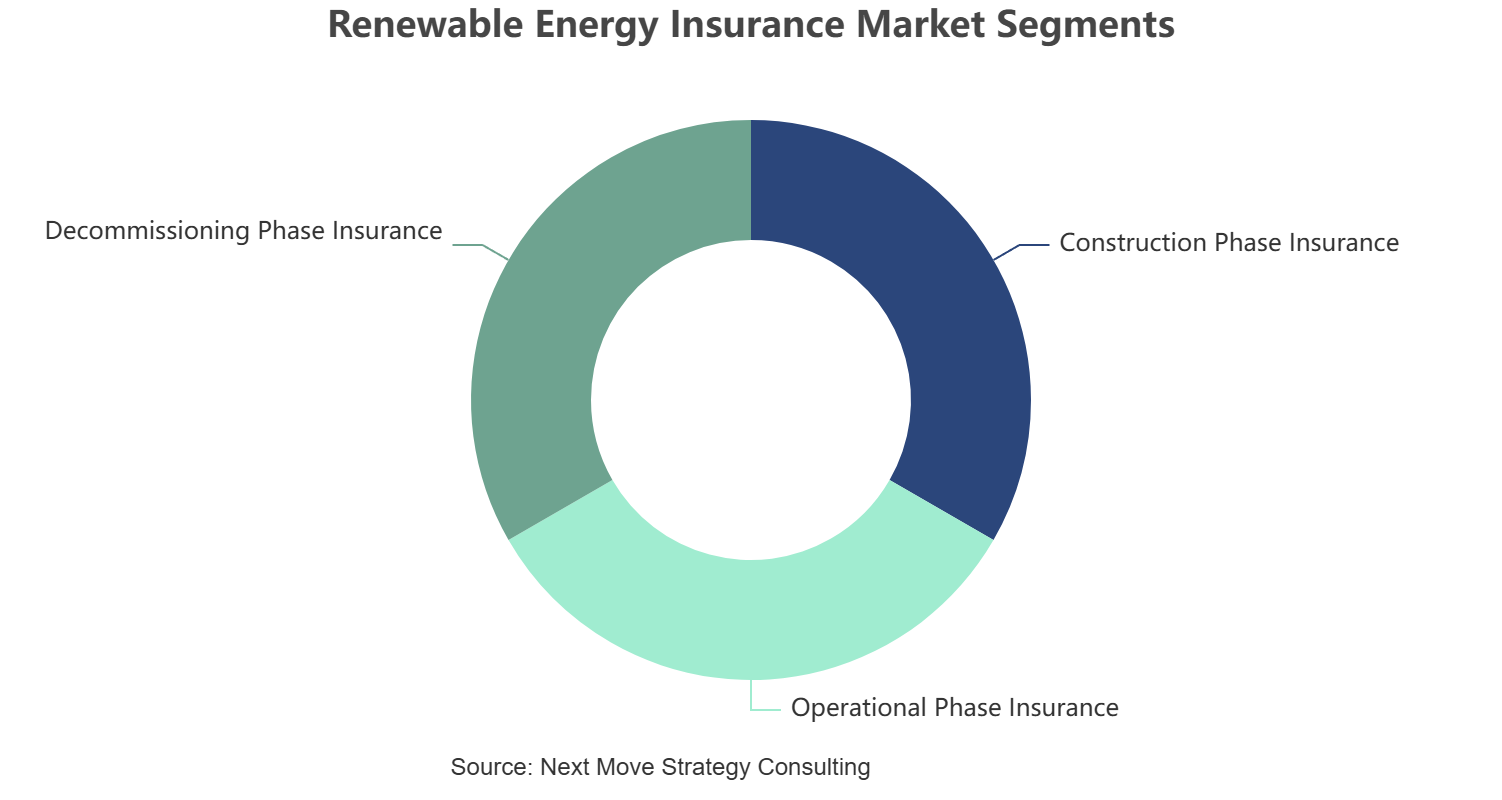
By Project Phase: Operational Phase Insurance held the largest share, expanding from USD 11.2 billion in 2025 to USD 24.6 billion by 2035; Decommissioning Phase Insurance is the fastest-growing sub-segment at 10.1% CAGR from 2026–2035. |
|
By End User: Independent Power Producers held the largest share, expanding from USD 8.6 billion in 2025 to USD 18.9 billion by 2035; Corporate and Industrial Off-Takers is the fastest-growing sub-segment at 10.4% CAGR from 2026–2035. |
|
Dominant Region: Europe dominated the market, expanding from USD 6.6 billion in 2025 to USD 13.9 billion by 2035. |
|
Fastest-Growing Region: Asia-Pacific is expected to register the highest CAGR of 10.3% during 2026–2035. |
|
Dominant Country: The United States led the market with USD 4.4 billion in 2025. |
|
Fastest-Growing Country: China is the fastest-growing country at a CAGR of 10.9% during 2026–2035. |
|
Market Opportunity: The Renewable Energy Insurance Market presents an incremental revenue opportunity of approximately USD 23.4 Billion between 2026 and 2035, positioning specialty underwriters, reinsurers, and brokers to capture sustained premium growth as global clean-energy capacity additions accelerate through the decade. |
According to NMSC analysis, the widening protection gap for offshore wind and battery storage assets, combined with lenders' bankability requirements, is compelling both traditional composite insurers and monoline renewable specialists to expand underwriting capacity across construction and operational phases.
What does the Renewable Energy Insurance Market Encompass?
The Renewable Energy Insurance Market report covers risk-transfer products designed to protect renewable energy assets, including onshore and offshore wind, utility-scale and distributed solar PV, hydropower, and battery energy storage systems, across construction, operational, and decommissioning phases. We observed that the market has evolved from generalist property and casualty coverage toward technology-specific underwriting, incorporating weather-index triggers, performance guarantees, and revenue-floor structures tailored to project finance requirements.
Regulatory frameworks including mandatory bankability insurance requirements under project finance covenants, together with national renewable portfolio standards, are shaping underwriting terms across covered geographies. Our analysis shows that insurers are increasingly deploying satellite-based asset monitoring, digital twins, and parametric weather data to refine risk pricing, reduce claims latency, and support real-time exposure management across a growing global renewable asset base.
|
Parameter |
Details |
|
Market Size in 2025 |
USD 19.4 Billion |
|
Market Size in 2026 |
USD 20.9 Billion |
|
Revenue Forecast in 2035 |
USD 44.3 Billion |
|
Growth Rate |
CAGR of 8.7% from 2026 to 2035 |
|
Analysis Period |
2025–2035 |
|
Base Year Considered |
2025 |
|
Forecast Period |
2026–2035 |
|
Market Size Estimation |
USD Billion |
|
Companies Profiled |
20 |
|
Countries Covered |
38 |
|
Market Share |
Available for Top 10 Companies |
Key Emerging Trends
We found that the Renewable Energy Insurance Market is being reshaped by four structural trends that are altering underwriting practice and product design across covered geographies.
How Is Parametric Insurance Transforming Renewable Risk Transfer?
Parametric weather-index products are gaining adoption because they settle claims against pre-agreed wind speed, irradiance, or precipitation triggers rather than lengthy loss adjustment. Developers and lenders benefit from faster liquidity following extreme weather events, improving project cash-flow resilience. Swiss Re has expanded parametric renewable energy solutions covering solar irradiance and wind resource shortfalls for utility-scale projects, reflecting broader industry migration from indemnity-only structures toward index-linked coverage for both construction and operational phases.
Why Are Offshore Wind Risk Pools Expanding in the Renewable Energy Insurance Market?
Offshore wind capacity additions are increasing exposure to cable failure, foundation damage, and marine logistics risk, prompting insurers to pool capacity through consortium placements. Munich Re and AXA XL have both expanded dedicated offshore wind underwriting teams to address rising claims severity from subsea cable losses. This trend is improving available capacity for larger projects while tightening underwriting scrutiny on construction methodology and vessel scheduling for offshore installation campaigns.
How Is Battery Storage Redefining Underwriting Criteria?
Thermal runaway incidents at battery energy storage system sites have driven insurers to introduce fire suppression and battery chemistry underwriting requirements before binding coverage. AIG and Zurich Insurance Group have both published updated risk engineering guidelines for lithium-ion storage facilities. Our findings suggest that underwriters are increasingly conditioning coverage on NFPA 855 compliance and third-party safety certification, reshaping how storage developers structure procurement and commissioning timelines.
What Role Does Technology-Enabled Risk Monitoring Play in the Renewable Energy Insurance Market?
Insurers are integrating satellite imagery, drone inspection data, and SCADA feeds into underwriting and claims workflows to improve exposure visibility across distributed renewable portfolios. During our market evaluation, we noticed that this shift is compressing claims settlement timelines and enabling dynamic premium adjustment for operational wind and solar assets. Beazley and Chubb have both invested in digital risk engineering platforms supporting real-time monitoring of insured renewable energy infrastructure across multiple regions.
Growth Drivers & Restraints
|
Factors |
Type |
(+/−) % Impact on CAGR |
Geographic Relevance |
Impact Timeline |
|
Rising utility-scale solar and wind capacity additions |
Driver |
+2.4% |
Global |
2026-2035 |
|
Lender-mandated bankability insurance requirements |
Driver |
+1.8% |
North America, Europe |
2026-2032 |
|
Growth of offshore wind and battery storage installations |
Driver |
+1.6% |
Europe, Asia-Pacific |
2026-2035 |
|
Adoption of parametric and index-based weather covers |
Driver |
+1.1% |
Global |
2027-2035 |
|
Government clean-energy investment programs |
Driver |
+0.9% |
North America, Asia-Pacific |
2026-2030 |
|
Rising extreme-weather claims frequency and severity |
Restraint |
-1.3% |
North America, Asia-Pacific |
2026-2035 |
|
Limited underwriting capacity for large offshore projects |
Restraint |
-0.9% |
Europe |
2026-2030 |
|
Elevated reinsurance costs following catastrophe losses |
Restraint |
-0.7% |
Global |
2026-2029 |
|
Fragmented regulatory standards across covered countries |
Restraint |
-0.5% |
Middle East & Africa, Latin America |
2026-2032 |
What Is the Primary Growth Driver of the Renewable Energy Insurance Market?
The primary growth driver is the sustained expansion of global renewable generation capacity, which the U.S. Energy Information Administration reports is rising steadily across utility-scale solar and wind categories. Based on research conducted by NMSC, we found that each gigawatt of newly commissioned capacity generates recurring insurable value across construction, property, and business interruption lines, directly expanding the addressable premium base for underwriters operating across covered geographies through 2035.
How Is Bankability Demand Driving Market Growth in the Renewable Energy Insurance Market?
Project finance lenders increasingly require comprehensive insurance packages as a condition of debt disbursement, embedding coverage requirements directly into loan covenants. The U.S. Department of Energy Loan Programs Office publishes financing guidelines requiring insurance evidence for supported renewable projects. Our assessment indicates that this lender-driven demand is structurally supporting premium volumes independent of short-term commodity price cycles, reinforcing the market's resilience across construction and operational phases.
What Is Restraining the Renewable Energy Insurance Market?
Rising frequency of extreme weather events is increasing claims severity for wind and hail damage to solar and wind installations, prompting some reinsurers to tighten capacity allocation. The National Oceanic and Atmospheric Administration recorded an elevated count of billion-dollar weather disasters in recent years. We observed that this loss experience is contributing to firming premium rates and more conservative underwriting terms, which can slow coverage affordability for smaller developers.
Segmentation Analysis
Segment Sizing: By Coverage Type
|
Segment |
2025 (USD Billion) |
2035 (USD Billion) |
CAGR% (2026-2035) |
|
Property Damage & Business Interruption Insurance |
7.4 |
15.8 |
8.2% |
|
Construction All Risk / Erection All Risk Insurance |
5.1 |
10.6 |
8.0% |
|
Liability Insurance |
2.9 |
6.1 |
8.3% |
|
Performance and Revenue Guarantee Insurance |
2.2 |
5.7 |
10.6% |
|
Political Risk and Trade Credit Insurance |
1.1 |
2.4 |
8.6% |
|
Others |
0.7 |
3.7 |
N/A |
|
Total |
19.4 |
44.3 |
8.7% |
What Is Driving Demand Across Coverage Type Segments?
Property Damage & Business Interruption insurance held the dominant coverage type share in 2025, reflecting lender and owner requirements to protect asset value across 20- to 25-year operating lifecycles. Our analysis shows that Performance and Revenue Guarantee insurance is the fastest-growing coverage type, supported by merchant power price volatility that is pushing developers to secure revenue-floor structures. This shift is evident particularly among offshore wind and battery storage projects with variable output profiles.
Segment Sizing: By Technology
|
Segment |
2025 (USD Billion) |
2035 (USD Billion) |
CAGR% (2026-2035) |
|
Onshore Wind |
5.4 |
10.9 |
7.7% |
|
Offshore Wind |
2.6 |
7.5 |
11.9% |
|
Utility Scale Solar PV |
5.9 |
13.9 |
9.1% |
|
Distributed Solar PV |
2.3 |
4.9 |
8.0% |
|
Hydropower |
1.9 |
3.4 |
6.3% |
|
Battery Energy Storage Systems |
0.9 |
2.9 |
13.2% |
|
Others |
0.4 |
0.8 |
N/A |
|
Total |
19.4 |
44.3 |
8.7% |
Which Technology Segment Leads the Market?
Utility Scale Solar PV led technology segments in 2025 given the sheer volume of commissioned capacity across North America, Europe, and Asia-Pacific. We found that Battery Energy Storage Systems represent the fastest-growing technology segment, propelled by rapid capacity build-out and evolving fire-safety underwriting standards. Offshore wind follows closely, driven by large single-asset exposures that require significant marine cargo and construction risk capacity from specialist underwriters.
Segment Sizing: By Project Phase
|
Segment |
2025 (USD Billion) |
2035 (USD Billion) |
CAGR% (2026-2035) |
|
Construction Phase Insurance |
6.8 |
14.4 |
8.2% |
|
Operational Phase Insurance |
11.2 |
24.6 |
8.8% |
|
Decommissioning Phase Insurance |
1.4 |
5.3 |
10.1% |
|
Total |
19.4 |
44.3 |
8.7% |
How Does Project Phase Influence Coverage Structure?
Operational Phase Insurance dominates the project phase segmentation because in-service assets accumulate premium continuously across multi-decade operating lives. During our market evaluation, we noticed that Decommissioning Phase Insurance is the fastest-growing segment, reflecting the first wave of early wind farm retirements in Europe requiring dismantlement liability and site restoration coverage, a category that was largely undeveloped before 2024.
PESTEL Analysis of the Renewable Energy Insurance Industry
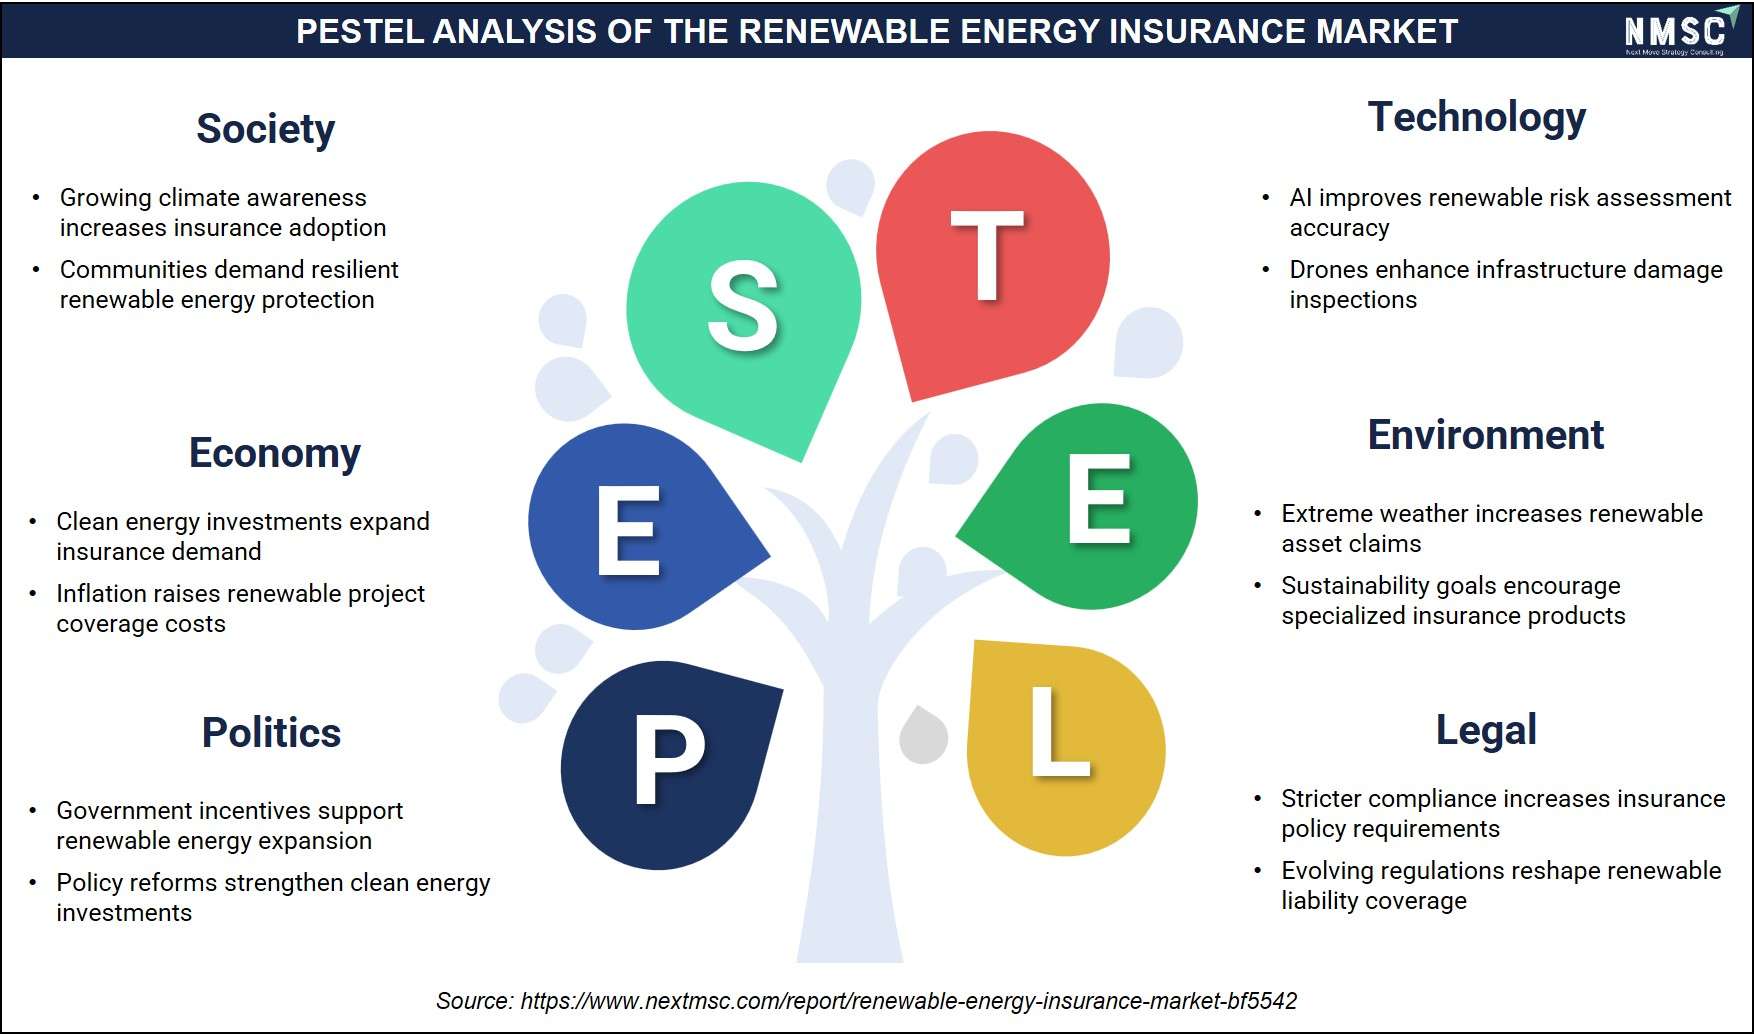
The above PESTEL analysis maps the key macro-environmental factors, such as political, economic, social, technological, environmental, and legal, shaping the renewable energy insurance market. From our analysis, we observed that political stability and government incentives support renewable energy adoption, while economic factors influence investment and insurance premiums. Social acceptance and technological advancements drive innovation, whereas environmental regulations promote sustainable practices. Legal frameworks, including compliance and policy requirements, ensure risk management and operational reliability, reflecting a comprehensive PESTEL landscape across the renewable energy insurance market.
Growth Opportunities
NMSC's analysis indicates that three distinct whitespace opportunities are emerging for insurers positioned to act early across the forecast period.
Can Captive Insurance Structures Unlock Utility-Scale Capacity in Renewable Energy Insurance Market?
Large independent power producers are forming captive insurance vehicles to self-fund predictable losses while ceding tail risk to reinsurers. This mechanism benefits utility-scale IPPs by lowering blended premium costs while preserving reinsurer participation for catastrophic exposures.
Will Repowering Create a New Underwriting Category in Renewable Energy Insurance Market?
Aging onshore wind fleets in Europe and North America are entering repowering cycles that require distinct construction and decommissioning coverage bundled together. This opportunity benefits specialist underwriters able to price combined dismantlement and re-installation risk for asset owners.
Can Embedded Insurance Expand Distributed Solar Coverage?
Distributed solar developers are integrating insurance directly into financing packages at point of sale, reducing customer acquisition friction. This mechanism benefits residential and commercial solar financiers seeking to bundle protection with lease and power purchase agreements.
Regional Outlook
|
Region |
2025 (USD Billion) |
2035 (USD Billion) |
CAGR% (2026-2035) |
Key Driver |
|
North America |
5.8 |
12.6 |
8.6% |
IRA-linked renewable investment |
|
Europe |
6.6 |
13.9 |
8.1% |
Harmonized climate and bankability rules |
|
Asia-Pacific |
4.9 |
12.5 |
10.3% |
Rapid solar and wind capacity build-out |
|
Middle East & Africa |
1.2 |
2.9 |
9.5% |
Utility-scale solar diversification programs |
|
Latin America |
0.9 |
2.4 |
10.0% |
Wind and hydropower project financing growth |
|
Total |
19.4 |
44.3 |
8.7% |
— |
North America
North America is characterized by mature underwriting infrastructure and strong lender-driven bankability demand. We observed that Inflation Reduction Act incentives are accelerating utility-scale solar and battery storage capacity additions, expanding the insurable asset base. Regulatory clarity around tax credit transferability is supporting project financing volumes, while established specialty carriers maintain deep underwriting capacity across construction and operational phases for both wind and solar portfolios.
Europe
Europe remains the largest regional market, supported by harmonized climate regulation and advanced offshore wind development pipelines. Our findings suggest that dense North Sea offshore wind clusters are driving demand for marine cargo, cable, and construction all-risk coverage. Established reinsurance capacity from European-headquartered carriers continues to underpin market depth, though rising claims from cable failures are tightening underwriting terms for new offshore placements.
Asia-Pacific
Asia-Pacific is the fastest-growing region as China, India, and Southeast Asian markets commission large-scale solar and wind capacity. We found that domestic insurers are expanding renewable underwriting expertise, supported by government clean-energy targets. Typhoon and monsoon exposure across coastal installations is prompting insurers to refine catastrophe modeling, while rising foreign direct investment into regional renewable projects is broadening demand for internationally recognized coverage structures.
Middle East & Africa
The Middle East & Africa region is expanding as national energy diversification programs channel investment into utility-scale solar. Our analysis shows that sovereign-backed project financing is embedding mandatory insurance requirements into procurement frameworks. Limited local underwriting capacity is prompting greater reliance on international reinsurers, while regulatory environments across the region remain uneven, creating variable underwriting terms between Gulf Cooperation Council markets and Sub-Saharan Africa.
Latin America
Latin America is benefiting from wind and hydropower project financing growth, particularly across Brazil's auction-driven capacity procurement model. We observed that currency volatility and political risk exposure are increasing demand for political risk and trade credit insurance alongside conventional property coverage. International reinsurers are expanding regional partnerships with domestic carriers to improve underwriting capacity for large-scale wind and solar portfolios across the region.
United States
The market in the United States was valued at approximately USD 4.4 Billion in 2025 and is projected to reach USD 9.4 Billion by 2035, growing at a CAGR of 8.5%. We observed that federal clean-energy tax incentives are sustaining strong construction-phase demand, while mature specialty underwriting capacity supports diverse coverage structures. Regulatory clarity and established loss-history data continue to differentiate the U.S. market from emerging renewable insurance geographies globally.
Canada
Based on our estimates, the Canadian market was valued at approximately USD 1.0 Billion in 2025 and is projected to reach USD 2.1 Billion by 2035, at a CAGR of 8.3%. Provincial renewable procurement programs are supporting steady wind and hydropower capacity growth. Regulatory alignment with federal climate targets is reinforcing demand for construction and operational coverage, while insurers continue to expand underwriting expertise for cold-climate wind asset exposures.
United Kingdom
As per our estimate, the UK market was valued at approximately USD 1.9 Billion in 2025 and is projected to reach USD 3.9 Billion by 2035, at a CAGR of 7.9%. Extensive offshore wind development in the North Sea is driving marine and construction all-risk demand. London-based specialty underwriting capacity remains globally significant, supporting complex risk placements for large-scale offshore projects across the broader European market.
Germany
According to our analysis, the German market was valued at approximately USD 1.5 Billion in 2025 and is projected to reach USD 3.0 Billion by 2035, at a CAGR of 7.6%. Strong onshore wind and distributed solar penetration is sustaining diversified premium demand. Regulatory support under national renewable energy legislation continues to underpin bankability requirements, while established domestic reinsurers maintain deep underwriting capacity across the country.
France
The market in France was valued at approximately USD 1.0 Billion in 2025 and is projected to reach USD 2.1 Billion by 2035, at a CAGR of 7.8%. Offshore wind auctions and utility-scale solar expansion are broadening the insurable asset base. Government-backed renewable financing mechanisms are reinforcing demand for construction phase coverage, while domestic insurers continue building specialized underwriting teams for emerging offshore wind exposures.
China
Based on our estimates, the Chinese market was valued at approximately USD 2.3 Billion in 2025 and is projected to reach USD 6.4 Billion by 2035, at a CAGR of 10.9%. Massive utility-scale solar and wind capacity additions are driving rapid premium growth. Domestic insurers are expanding renewable underwriting expertise under national clean-energy targets, while typhoon exposure across coastal wind installations continues to shape catastrophe risk pricing.
India
As per our estimate, the Indian market was valued at approximately USD 1.1 Billion in 2025 and is projected to reach USD 3.0 Billion by 2035, at a CAGR of 10.5%. Aggressive national solar capacity targets are expanding construction-phase demand significantly. Regulatory reforms supporting renewable project financing are improving bankability, while domestic and international insurers continue to build underwriting capacity for large-scale solar park developments.
Japan
According to our analysis, the Japanese market was valued at approximately USD 0.9 Billion in 2025 and is projected to reach USD 2.0 Billion by 2035, at a CAGR of 8.4%. Offshore wind auctions and distributed solar adoption are supporting steady demand growth. Established domestic insurers maintain strong underwriting capacity, while seismic and typhoon exposure continues to shape catastrophe modeling for coastal renewable installations across the country.
South Korea
The market in South Korea was valued at approximately USD 0.5 Billion in 2025 and is projected to reach USD 1.2 Billion by 2035, at a CAGR of 9.3%. Offshore wind development off the southern coast is expanding construction-phase insurance demand. Government renewable energy targets are reinforcing bankability requirements, while domestic insurers continue to partner with international reinsurers to build offshore wind underwriting capacity.
Australia
We observed that the Australian market was valued at approximately USD 0.7 Billion in 2025 and is projected to reach USD 1.6 Billion by 2035, at a CAGR of 8.6%. Utility-scale solar and onshore wind expansion across multiple states is sustaining steady demand. Bushfire and extreme weather exposure continues to influence catastrophe risk pricing, while domestic insurers maintain established underwriting relationships with international reinsurance capacity.
UAE
Based on our estimates, the UAE market was valued at approximately USD 0.4 Billion in 2025 and is projected to reach USD 1.0 Billion by 2035, at a CAGR of 9.8%. Utility-scale solar mega-projects are driving strong construction-phase demand. Sovereign-backed procurement frameworks are embedding mandatory insurance requirements, while limited local underwriting capacity continues to drive reliance on international reinsurers for large-scale project risk placements.
Saudi Arabia
As per our estimate, the Saudi Arabian market was valued at approximately USD 0.5 Billion in 2025 and is projected to reach USD 1.3 Billion by 2035, at a CAGR of 10.1%. National energy diversification programs are accelerating utility-scale solar and wind capacity additions. Government-backed financing structures are reinforcing bankability requirements, while domestic insurers continue expanding renewable underwriting expertise in partnership with global reinsurance carriers.
South Africa
According to our analysis, the South African market was valued at approximately USD 0.3 Billion in 2025 and is projected to reach USD 0.7 Billion by 2035, at a CAGR of 9.2%. Independent power producer procurement programs are supporting steady wind and solar capacity growth. Grid reliability challenges continue to influence business interruption coverage demand, while domestic insurers maintain partnerships with international reinsurers for large-scale project risk.
Brazil
The market in Brazil was valued at approximately USD 0.5 Billion in 2025 and is projected to reach USD 1.3 Billion by 2035, at a CAGR of 10.2%. Auction-driven wind and hydropower capacity procurement is sustaining strong construction-phase demand. Currency volatility and political risk exposure are increasing demand for political risk and trade credit insurance, while domestic insurers continue expanding renewable-specific underwriting expertise across the country.
Argentina
We observed that the Argentine market was valued at approximately USD 0.2 Billion in 2025 and is projected to reach USD 0.5 Billion by 2035, at a CAGR of 9.7%. Wind capacity expansion in Patagonia is supporting gradual demand growth. Economic volatility continues to shape underwriting terms and premium structures, while international reinsurers maintain a cautious but expanding presence supporting domestic renewable project financing across the region.
Regulatory Framework Impacting the Renewable Energy Insurance Industry
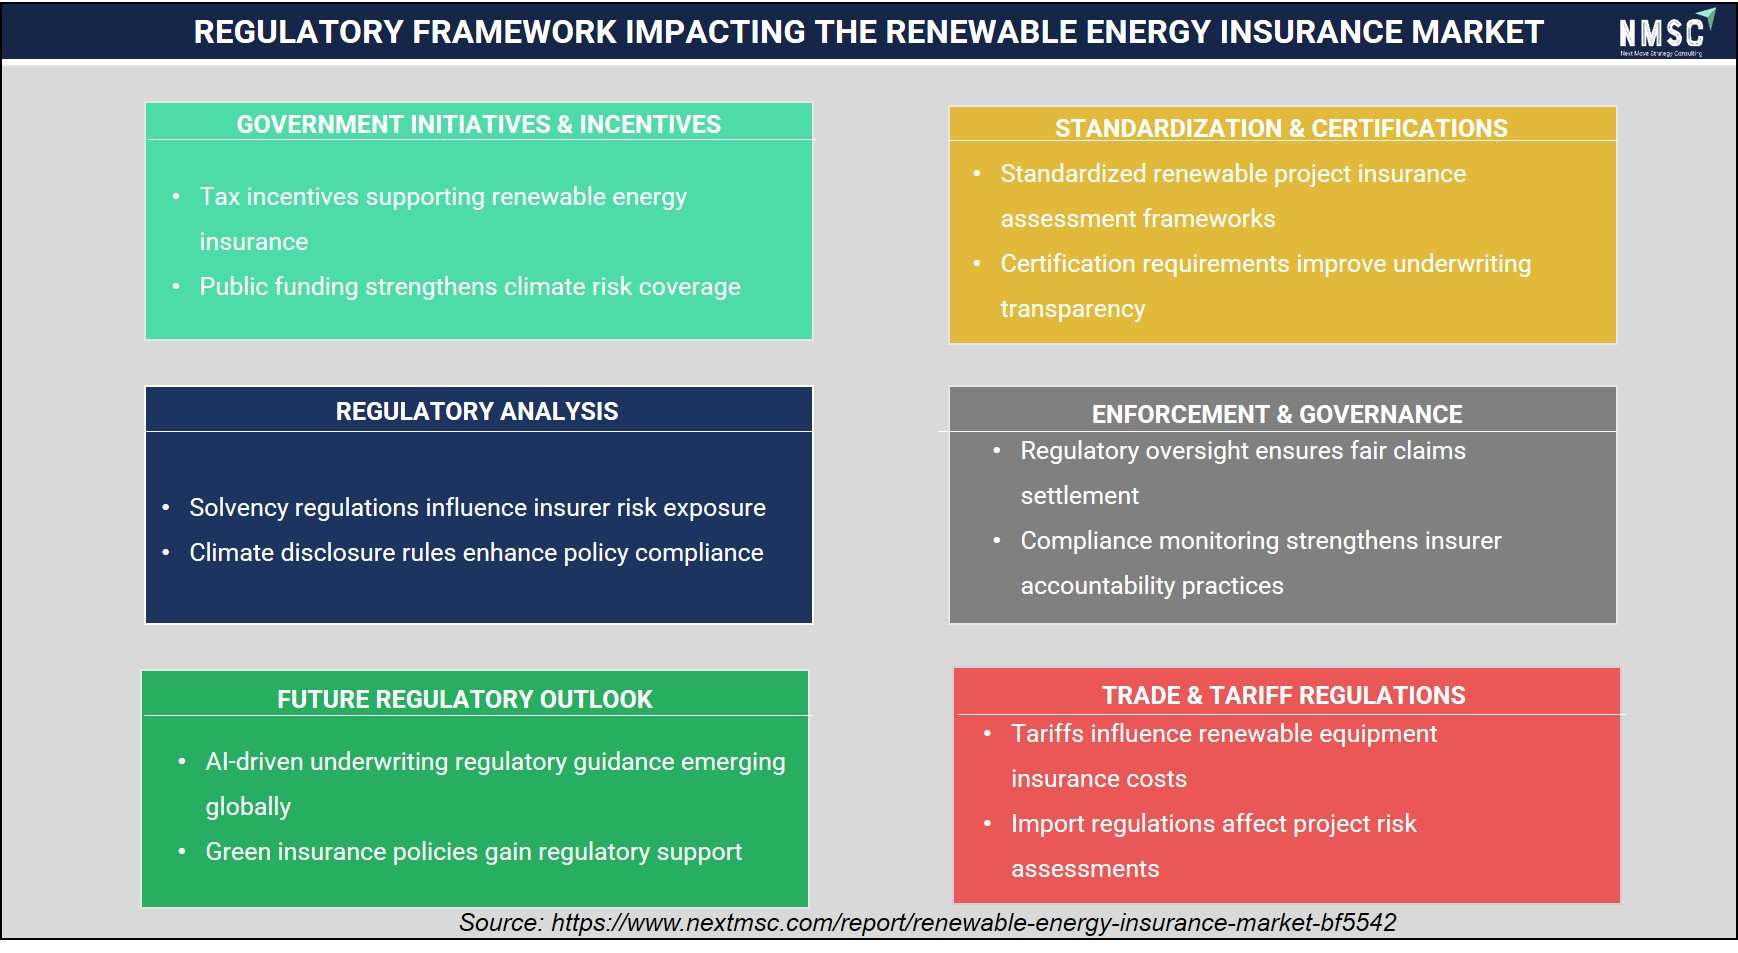
The above regulatory framework analysis maps the key regulatory components, such as government initiatives and incentives, regulatory analysis, future regulatory outlook, standardization and certifications, enforcement and governance, and trade and tariff regulations, shaping the renewable energy insurance market. From our analysis, we observed that tax incentives support renewable energy insurance and public funding strengthens climate risk coverage, while solvency regulations influence insurer risk exposure and climate disclosure rules enhance policy compliance. AI-driven underwriting guidance is emerging, and standardized assessment frameworks improve underwriting transparency, whereas regulatory oversight ensures fair claims settlement and compliance monitoring strengthens insurer accountability.
Competitive Landscape
Our assessment indicates that the Renewable Energy Insurance Market Industry remains moderately consolidated, with global reinsurers and specialty carriers commanding the largest share of complex offshore wind and utility-scale placements.
|
Dimension |
Assessment |
|
Market Structure |
Moderately consolidated, led by global reinsurers and specialty renewable energy underwriters with expanding regional broker networks |
|
Innovation Focus |
Parametric weather products, satellite-based risk monitoring, and battery storage safety underwriting frameworks |
|
M&A Activity |
Continued acquisition of specialist renewable underwriting units by diversified global insurance groups |
How Do Companies Compete in the Renewable Energy Insurance Market?
Competition centers on underwriting capacity, technical risk engineering depth, and claims settlement speed for complex offshore and battery storage exposures. Industry participants differentiate through proprietary loss databases and dedicated renewable energy underwriting teams. Our findings suggest that carriers with established offshore wind track records command preferential access to large syndicated placements, while newer entrants compete primarily on distributed solar and smaller onshore wind segments.
Which Competitive Archetypes Dominate the Renewable Energy Insurance Market?
Two archetypes dominate industry structure: diversified global reinsurers offering broad balance-sheet capacity, and specialist monoline underwriters such as former GCube built around dedicated renewable energy risk engineering expertise. We found that this differentiation theme, capacity scale versus technical specialization, explains why large offshore projects typically syndicate coverage across both carrier types to balance financial strength with granular technical underwriting judgment.
What Innovation and Differentiation Strategies Are Emerging?
Leading carriers are investing in digital risk engineering platforms that integrate satellite imagery and SCADA data for real-time exposure monitoring. During our market evaluation, we noticed that several insurers are launching parametric products indexed to wind speed and solar irradiance to reduce claims settlement timelines. This innovation focus is becoming a key differentiator as developers increasingly favor insurers offering faster liquidity after weather-related loss events.
What M&A Activity Is Shaping the Competitive Landscape?
Consolidation continues as diversified insurance groups acquire specialist renewable underwriting capability to build centers of excellence, following the precedent set by Tokio Marine HCC's acquisition of GCube. We observed that this trend is expanding geographic reach for acquired specialists while giving acquirers immediate access to established renewable energy risk engineering talent and long-standing broker relationships across covered markets.
Key Market Players
Our analysis shows that the following companies represent the leading providers of renewable energy insurance and reinsurance capacity across covered geographies, ranked by market-specific underwriting scale and operational presence.
-
Swiss Re Ltd
-
Allianz SE
-
American International Group, Inc.
-
Zurich Insurance Group Ltd
-
AXA SE
-
Tokio Marine Holdings, Inc.
-
AXIS Capital Holdings Limited
-
Talanx AG
-
Chubb Limited
-
Sompo Holdings, Inc.
-
MS&AD Insurance Group Holdings, Inc.
-
Beazley plc
-
Starr Insurance Holdings, Inc.
-
CNA Financial Corporation
-
Berkshire Hathaway Specialty Insurance Company
-
QBE Insurance Group Limited
-
Everest Group, Ltd.
Latest Developments
We found that recent developments reflect intensifying carrier investment in renewable-specific underwriting capacity and expanded reinsurance partnerships across covered geographies.
|
Date |
Event |
|
December 2025 |
Munich Re, Germany's Federal Ministry for Economic Affairs and Energy, and KfW launched an innovative financing and insurance program for deep geothermal projects. |
Investment Opportunities
How Are Capital Inflows Shaping the Renewable Energy Insurance Market?
Institutional capital continues flowing into renewable insurance-linked structures, including revenue-floor guarantees backed by investment banks for large storage and wind projects. We observed that this capital inflow is diversifying available underwriting capacity beyond traditional reinsurance balance sheets, supporting continued premium growth across construction and operational phases of the Renewable Energy Insurance Market.
What Infrastructure Investment Trends Support Growth?
The European Union has committed substantial clean-energy infrastructure investment, according to International Energy Agency reporting, directly expanding the insurable renewable asset base. Our findings suggest that this infrastructure investment trajectory is creating durable, multi-year demand for construction all-risk and operational coverage across solar, wind, and battery storage projects throughout the forecast period.
How Do ESG Considerations Influence Investment Decisions?
Insurers are increasingly integrating environmental, social, and governance criteria into underwriting decisions, favoring renewable energy portfolios that align with decarbonization commitments. Based on research conducted by NMSC, we found that this ESG alignment is attracting dedicated underwriting capital from carriers seeking to reduce fossil-fuel exposure, reinforcing capacity growth specifically directed toward renewable energy risk across covered geographies.
Key Benefits for Stakeholders
How Does This Report Benefit Industry Leaders in the Renewable Energy Insurance Market?
Industry leaders gain access to validated segmentation, regional sizing, and competitive benchmarking that supports underwriting capacity planning and portfolio diversification decisions. Our analysis shows that this report equips insurers and reinsurers with forecast data spanning 2025 through 2035, enabling more informed strategic positioning across coverage types, technologies, and geographies within the Renewable Energy Insurance Market.
How Does This Report Benefit Investors and Financial Analysts?
Investors and financial analysts benefit from consolidated market sizing, CAGR projections, and regional growth differentials that support capital allocation decisions across insurance-linked securities and specialty carrier equities. We found that the report's country-level insights provide granular visibility into emerging growth geographies, supporting more precise risk-adjusted return assessment across the Renewable Energy Insurance Market Industry.
How Does This Report Benefit Technology and Risk Engineering Teams in Renewable Energy Insurance Market?
Technology vendors and risk engineering teams gain insight into emerging underwriting trends, including parametric products and digital monitoring adoption, that shape product development priorities. Our findings suggest that this report's trend analysis supports more targeted investment in risk assessment tools aligned with insurer demand across construction, operational, and decommissioning phases of renewable energy projects.
Key Market Segments
By Coverage Type
-
Property Damage & Business Interruption Insurance
-
Construction All Risk / Erection All Risk Insurance
-
Liability Insurance
-
Performance and Revenue Guarantee Insurance
-
Political Risk and Trade Credit Insurance
-
Others
By Technology
-
Onshore Wind
-
Offshore Wind
-
Utility Scale Solar PV
-
Distributed Solar PV
-
Hydropower
-
Battery Energy Storage Systems
-
Others
By Project Phase
-
Construction Phase Insurance
-
Operational Phase Insurance
-
Decommissioning Phase Insurance
By End User
-
Independent Power Producers
-
Utilities
-
Corporate and Industrial Off-Takers
-
Government and Public Sector Entities
By Distribution Channel
-
Direct Underwriting
-
Broker Intermediated
By Region
-
North America: U.S., Canada, Mexico
-
Europe: UK, Germany, France, Italy, Spain, Sweden, Denmark, Finland, Netherlands, Rest of Europe
-
Asia-Pacific: China, India, Japan, South Korea, Taiwan, Indonesia,Vietnam, Australia, Philippines, Malaysia, Rest of APAC
-
Middle East & Africa: Saudi Arabia, UAE, Egypt, Israel, Turkey, Nigeria, South Africa, Rest of MEA
-
Latin America: Brazil, Argentina, Chile, Colombia, Rest of LATAM
Conclusion & Recommendations
What Is the Long-Term Outlook for the Renewable Energy Insurance Market?
The Renewable Energy Insurance Market is expected to sustain robust expansion through 2035, advancing from USD 20.9 Billion in 2026 to USD 44.3 Billion at a CAGR of 8.7%. Our assessment indicates that continued global renewable capacity additions, combined with maturing bankability requirements, will structurally support long-term premium growth across construction, operational, and decommissioning phases throughout the forecast period.
How Should Carriers Position Strategically in Renewable Energy Insurance Market?
Carriers should prioritize building dedicated technical underwriting expertise for offshore wind and battery storage risk, given their outsized growth trajectories through 2035. We found that specialist positioning combined with reinsurance partnerships offers the strongest competitive footing, while broad-capacity diversified insurers should focus on syndicated participation in large-scale offshore and utility-scale solar placements.
How Attractive Is the Renewable Energy Insurance Market for New Investment?
The Renewable Energy Insurance Market presents strong investment attractiveness, supported by a projected incremental opportunity of approximately USD 23.4 Billion between 2026 and 2035. Our analysis shows that Asia-Pacific's 10.3% regional CAGR and the battery storage segment's 13.2% technology CAGR represent the most attractive entry points for insurers and reinsurers seeking above-market growth exposure.
What Market Shifts and Key Risks Should Stakeholders Monitor?
Stakeholders should monitor rising extreme-weather claims severity and constrained reinsurance capacity, which could pressure premium affordability for smaller developers. We observed that regulatory fragmentation across Middle East & Africa and Latin America markets also represents a monitorable risk, potentially slowing standardized product rollout despite strong underlying capacity growth demand across these geographies.
What Are the Primary Growth Pathways Through 2035?
Primary growth pathways include expanding parametric product adoption, deepening offshore wind underwriting capacity, and developing decommissioning coverage for aging wind fleets. Based on research conducted by NMSC, we found that carriers pursuing these three pathways simultaneously are best positioned to capture a disproportionate share of the market's projected USD 23.4 Billion incremental opportunity through 2035.
About the Author
 Mayurima Roy
— Mayurima Roy is Research Analyst at Next Move Strategy Consulting, where she has spent 4 years working across the firm's full industry coverage rather than a single fixed vertical. Her work centers on structured research, ongoing trend tracking, competitive assessment, and insight-led content development, translating complex market data into clear, decision-ready narratives that support informed client decision-making across diverse global industries, market sectors, and world regions every day.
Mayurima Roy
— Mayurima Roy is Research Analyst at Next Move Strategy Consulting, where she has spent 4 years working across the firm's full industry coverage rather than a single fixed vertical. Her work centers on structured research, ongoing trend tracking, competitive assessment, and insight-led content development, translating complex market data into clear, decision-ready narratives that support informed client decision-making across diverse global industries, market sectors, and world regions every day.
About the Reviewer
 Supradip Baul
— Supradip Baul is an accomplished business consultant and strategist with over a decade of rich experience in market intelligence, strategy, technology, and business transformation. His work has included rigorous qualitative and quantitative analysis across multiple industries, helping clients shape investment decisions and long-term roadmaps. Earlier in his career, he was associated with Gartner, where he contributed to industry-leading reports and market share analyses. He has worked with leading global companies and holds an MBA with a dual specialization in Marketing and Finance.
Supradip Baul
— Supradip Baul is an accomplished business consultant and strategist with over a decade of rich experience in market intelligence, strategy, technology, and business transformation. His work has included rigorous qualitative and quantitative analysis across multiple industries, helping clients shape investment decisions and long-term roadmaps. Earlier in his career, he was associated with Gartner, where he contributed to industry-leading reports and market share analyses. He has worked with leading global companies and holds an MBA with a dual specialization in Marketing and Finance.
At Next Move Strategy Consulting, we understand that insightful market research is the cornerstone of successful business decisions. That's why we employ a robust and multifaceted approach, combining various methodologies to deliver the most accurate and actionable data for our clients.

Research Landscape
We navigate the world of research with two primary approaches:
Qualitative Approach
Our qualitative research methodologies involve immersive techniques such as in-depth interviews, focus groups, and observational studies. By engaging directly with individuals and stakeholders, we uncover valuable insights that quantitative data alone may overlook.

Quantitative Research
In tandem with qualitative methodologies, NMSC leverages the power of Quantitative Research to provide a robust foundation of numerical insights. Through systematic data collection and analysis, we quantify patterns, preferences, and market trends, offering a comprehensive view of the business landscape.
Our quantitative research approach employs diverse tools, including surveys, experiments, and statistical modelling. These methodologies enable us to gather data from a large and representative sample, ensuring the statistical significance of our findings. By employing structured questionnaires and standardized data collection methods, we guarantee the reliability and validity of the information we present to our clients.
Quantitative research is particularly effective in measuring the prevalence of trends, assessing market size, and gauging the impact of various factors on consumer behavior. The numerical precision attained through this approach equips our clients with actionable insights, facilitating data-driven decision-making and strategy formulation.


Our Specialized Toolbox for Industry-Specific Market Research
We deploy a specialized arsenal of techniques tailored to meet your unique requirements. Here's a glimpse into our comprehensive toolbox:

Information Procurement
The stage entails acquiring market data or relevant information through various sources and methodologies.


Market Research Approach
We utilize both top-down and bottom-up approaches in market research analysis to achieve a comprehensive understanding of the market dynamics, leveraging the broad perspective of industry trends and macroeconomic factors alongside detailed insights from specific segments and individual companies.

Porters Five Forces Analysis
We conduct Porter's Five Forces analysis to evaluate the competitive landscape of an industry, providing us with insights into factors that affect profitability and strategic positioning.

SWOT Analysis

Forecasting
We utilize a forecasting model to predict future consumption by considering parameters like population, economics, regulations, market competition, drivers, constraints, technology, and pricing. We also employ statistical techniques such as multilinear regression, exponential smoothing, moving average, ARIMA, and Monte Carlo simulations for accurate predictions. In econometric forecasting, we analyzed short-term and long-term event impacts, attributing values based on regulatory frameworks, economic factors, and market events.





 Speak to Our Analyst