Market")
Unmanned Ground Vehicle (UGV) Market By Mode of Operation (Tethered, Teleoperated, and Autonomous), By Mode of Locomotion (Tracked, Wheeled, Legged, and Hybrid), By Size {Small (10-200 LBS), Medium (200-500 LBS), Large (500-1000 LBS), Very Large (1000-2000 LBS), Extremely Large (>2000 LBS)}, By System (Payloads and, Controller Systems, Navigation Systems, and Others), By End User Industry (Military and Defense, and Others) – Global Opportunity Analysis and Industry Forecast, 2023–2030
Industry: Automotive & Transportation | Lastest Edition: January 9, 2026 | No of Pages: 618 | No. of Tables: 457 | No. of Figures: 402 | Format: PDF | Report Code : AT77
Market Overview
The global Unmanned Ground Vehicle (UGV) Market size was valued at USD 2.25 billion in 2022 and is expected to reach USD 4.08 billion by 2030, with a CAGR of 6.9% from 2023 to 2030. Unmanned ground vehicles (UGVs) are robots designed to operate on land without a human operator. They come in a range of sizes, from small and lightweight robots that a single person can carry to larger and rugged vehicles that can travel over rough terrains.
Some UGVs are designed for specific tasks, such as inspecting pipelines or hazardous materials, while others are more versatile and can be customized for different applications. These vehicles are equipped with sensors, cameras, and other specialized equipment to enable them to perform various tasks.
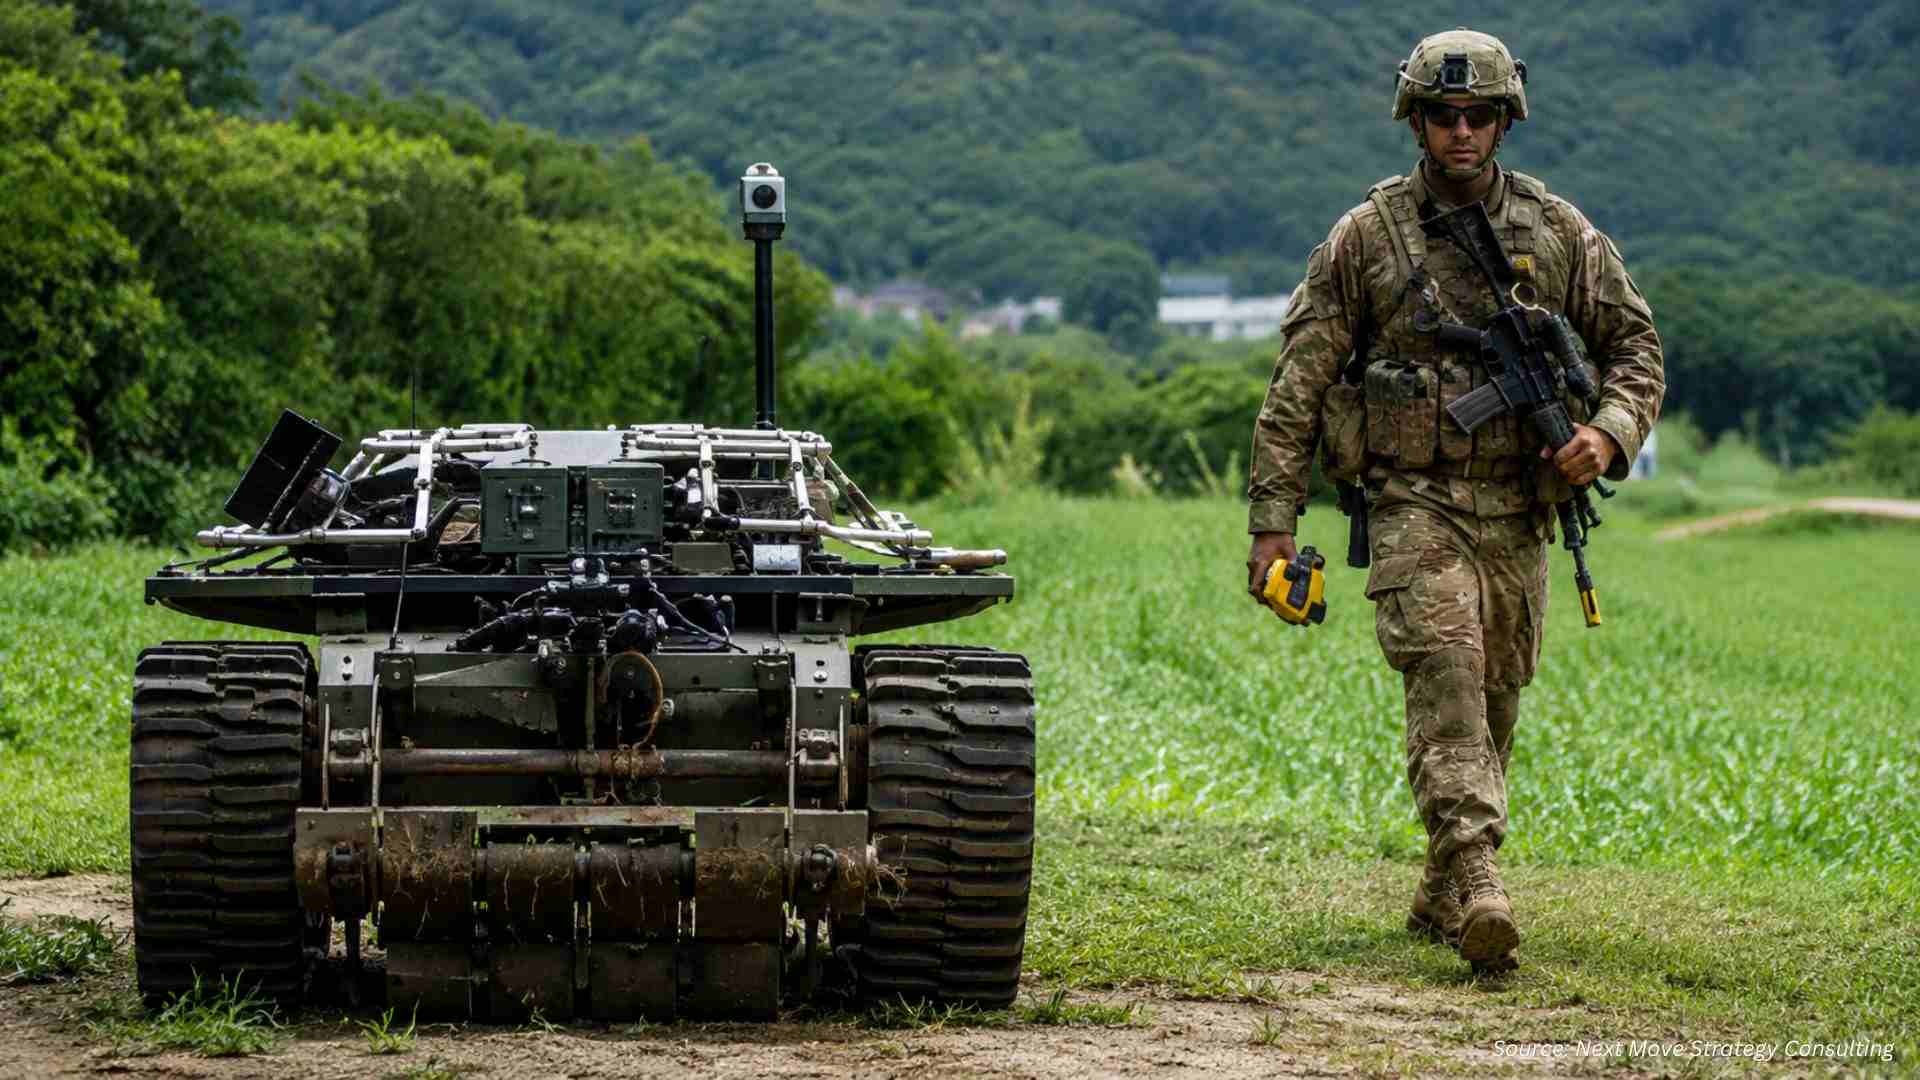
UGVs are used for various tasks, including inspection, surveillance, mapping, and search & rescue operations. These vehicles are typically used for hazardous, dull, or dirty tasks, and can be deployed in various environments, including urban, rural, and off-road settings. These can also be used in various applications, including military, search & rescue, agriculture, and transportation.
UGVs can be either fully autonomous and can navigate & make decisions on their own or operated remotely by a human operator. One of the main advantages of UGVs is that they can perform tasks in environments that are dangerous or inaccessible to humans.
For instance, they are used to defuse bombs, inspect hazardous chemical spills, or search for survivors in collapsed buildings. These vehicles are used for tasks that are tedious or monotonous for humans, such as surveillance or patrolling. They can also be used in agriculture and forestry for tasks, such as mapping & monitoring crops or inspecting & maintaining irrigation systems.
Accelerated Global Defense Modernization and Rising Adoption of Uncrewed Multi-domain Warfare Systems
Countries across North America, Europe, and Asia are rapidly modernizing their armed forces and shifting toward multi-domain, uncrewed-enabled strategies to enhance operational resilience and reduce reliance on personnel in high-risk missions. Recent global defense initiatives emphasize integrating UGVs for frontline logistics, perimeter security, autonomous reconnaissance, and explosive ordnance disposal—functions traditionally requiring human presence in hostile environments. Governments are now prioritizing next-generation land robotics under rapid procurement models, focusing on scalable designs, secure communications, hybrid-electric mobility, and AI-backed autonomy. This shift is accelerating UGV acquisition as militaries prepare for future conflict scenarios characterized by electronic warfare, urban combat, and contested borders. Such modernization efforts are driving unprecedented global demand for rugged, mission-adaptable UGV platforms that can seamlessly integrate into joint operations alongside aerial and maritime autonomous assets.
Expanding Commercial Automation Needs Across Logistics, Energy, Mining, and Urban Security
Beyond defense, the global push toward industrial automation, predictive maintenance, and worker safety is significantly boosting UGV adoption across commercial sectors. Industries such as mining, oil and gas, agriculture, utilities, and logistics are deploying UGVs to automate site mapping, cargo movement, equipment inspection, and hazard mitigation. The rise of autonomous warehouses, smart mining operations, and digitally monitored energy infrastructure is further accelerating demand for ground robots capable of navigating complex terrains and interacting with industrial assets. Recent advancements in AI-driven navigation, all-weather sensors, and modular payloads are enabling UGVs to operate around the clock with minimal oversight. As companies prioritize operational continuity, cost efficiency, and reduced human exposure to hazardous environments, UGVs are becoming central to next-generation industrial automation strategies worldwide.
Regulatory Uncertainty and Growing Cybersecurity Requirements Limit Large-scale Adoption
A major global restraint for UGV deployment is the lack of unified regulatory frameworks governing autonomous ground operations, safety certification, liability assignment, and cross-border data security. With UGVs increasingly connected to cloud systems, encrypted networks, and mission-critical data pipelines, cybersecurity expectations have become significantly stricter. Nations are now introducing new standards for secure autonomous navigation, system redundancy, and AI decision auditing, but these frameworks vary widely by region. This inconsistency complicates international deployment, slows interoperability efforts, and increases compliance costs for manufacturers. Additionally, unresolved liability questions—particularly concerning autonomous failures—continue to discourage large-scale commercial adoption. These regulatory and security challenges collectively extend development cycles and hinder rapid integration into both defense and civilian markets.
Global Surge in Demand for Ugvs in Extreme-environment Infrastructure Monitoring and Climate-resilience Tasks
The growing need to inspect and maintain critical infrastructure under increasingly extreme environmental conditions presents a major global opportunity for the UGV market. Countries are investing in robotics solutions to monitor tunnels, pipelines, power grids, offshore installations, and disaster-prone regions affected by flooding, wildfires, and seismic activity. UGVs equipped with thermal imaging, LiDAR, gas detection, radiation sensors, and autonomous navigation are becoming essential for ensuring infrastructure resilience and minimizing human risk. Governments and international agencies are funding initiatives to deploy robotic systems capable of operating in contaminated zones, collapsed structures, and remote energy sites. This rising demand is driving innovation in durable chassis design, long-endurance power systems, sensor fusion, and autonomous fault detection. As global climate-related risks intensify, UGVs designed for tough, unpredictable environments are poised to become one of the most rapidly expanding segments of the market.
North America Holds the Dominant Market Share in the Unmanned Ground Vehicle Market
North America is expected to steadily rise in the UGV market, owing to increased expenditure on military sectors in countries such as the U.S. and Canada. As governments invest more resources in their military capabilities, there is a corresponding increase in demand for UGVs for various military applications, such as surveillance, reconnaissance, and explosive ordnance disposal.
UGVs in these applications provide military forces with increased capabilities while reducing risks to human operators. In addition, the increase in the deployment of UGVs in various industries, such as mining, agriculture, and military industries, propels the growth and development of UGVs in this region.
Moreover, the increase in benefits of robots for people and the rise in support from governments for the development and integration of robotics in the region are expected to accelerate the growth of the UGV market. For instance, in February 2021, the National Science Foundation (NSF) issued a new National Robotics Initiative (NRI) named NRI-3.0: Innovations in Integration of Robotics. The new initiative promoted fundamental research in the U.S. to enhance the science of robot integration. The initiative funds research initiatives that encourage the use of robots in ways that benefit people, such as improving their flexibility and safety.
Asia-Pacific is Expected to Show Steady Growth in the Global Unmanned Ground Vehicle Market
The Asia-Pacific UGV market is expected to witness significant growth, owing to increased spending in the defense sector in countries, such as China, India, and Japan. Countries in Asia-Pacific increased their defense spending, which indicates increased investment in new technologies and equipment including UGVs. This step has been taken to improve their military capabilities and infrastructure. This, in turn, accelerates the growth of the unmanned ground vehicle market.
In addition, an increase in government initiatives and investments in research & development activities for UGV projects helped companies in the countries of this region to develop advanced UGV technology and compete in the global market. This factor is further expected to boost the growth of the market.
Moreover, the presence of advanced technologies and the robotics industry in countries such as China and Japan have resulted in a significant increase in UGV use in this region. Innovation in robotics and automation in various industries, such as manufacturing, logistics, and agriculture, have led to a rise in demand for UGVs. This, in turn, is expected to drive the growth of the unmanned ground vehicle market in this region.
Competitive Landscape
Several market players operating in the unmanned ground vehicle industry include Teledyne FLIR LLC, Textron Systems Corporation, Rheinmetall AG, General Dynamics Corporation, QinetiQ plc, L3Harris Technologies, Inc., Milrem Robotics AS, Elbit Systems Ltd., Lockheed Martin Corporation, Hanwha Aerospace, BAE Systems plc, Israel Aerospace Industries, Roboteam Ltd., ST Engineering, Hyundai Rotem Company, Aselsan A.Åž., Exail, Diehl Defence GmbH & Co. KG, Ghost Robotics Corporation, KNDS N.V. These market players are adopting strategies such as product launches across various regions to maintain their dominance in the global market.
For instance, in November 2022, General Dynamics supplied the U.S. Army with Small Multipurpose Equipment Transport (S-MET) vehicles. These vehicles will function as robotic mules, effectively alleviating the weight of equipment transportation. These S-MET vehicles are designed with eight wheels and incorporate advanced robotic technology to assist soldiers on foot.
Moreover, in September 2022, QinetiQ launched Talon 6 EOD UGV. The Talon 6 is the latest series of EOD UGVs developed by QinetiQ. The Talon 6 features interoperability (IOP) ports on the arm, easing the integration of sensors and other payloads.
Unmanned Ground Vehicle Market Key Segments
By Mode of Operation
-
Tethered
-
Teleoperated
-
Autonomous
-
Fully Autonomous
-
Semi-Autonomous
-
By Mode of Locomotion
-
Tracked
-
Wheeled
-
Legged
-
Hybrid
By Size
-
Small (Less than 200 LBS)
-
Medium (200 to 500 LBS)
-
Large (501 to 1000 LBS)
-
Very Large (1001 to 2000 LBS)
-
Extremely Large (>2000 LBS)
By System
-
Payloads
-
Sensors
-
Radars
-
Lasers
-
Cameras
-
Motor Encoders
-
Articulated Arms
-
GPS Antennas
-
Other Payloads
-
-
Controller Systems
-
Navigation Systems
-
Power Systems
-
Solar Rechargeable Battery
-
Electric Non-Solar Rechargeable Battery
-
Lithium-Ion Battery
-
Sealed Lead Acid Battery
-
Nickel Cadmium
-
Nickel Metal Hydride Battery
-
-
-
Other Systems
By End User Industry
-
Military and Defense
-
Agriculture
-
Mining
-
Law Enforcement
-
Others
By Region
-
North America
-
U.S.
-
Canada
-
Mexico
-
-
Europe
-
U.K.
-
Germany
-
France
-
Spain
-
Italy
-
Netherlands
-
Denmark
-
Finland
-
Norway
-
Sweden
-
Russia
-
Rest of Europe
-
-
Asia-Pacific
-
China
-
Japan
-
India
-
Australia
-
South Korea
-
Indonesia
-
Thailand
-
Taiwan
-
Singapore
-
Rest of Asia-Pacific
-
-
Rest of the World (RoW)
-
Latin America
-
Middle East
-
Africa
-
Key Players:
-
Teledyne FLIR LLC
-
Textron Systems Corporation
-
KNDS N.V.
-
Rheinmetall AG
-
General Dynamics Corporation
-
QinetiQ plc
-
L3Harris Technologies, Inc.
-
Milrem Robotics AS
-
Elbit Systems Ltd.
-
Lockheed Martin Corporation
-
Hanwha Aerospace
-
BAE Systems plc
-
Israel Aerospace Industries
-
Roboteam Ltd.
-
ST Engineering
-
Hyundai Rotem Company
-
Aselsan A.Åž.
-
Exail
-
Diehl Defence GmbH & Co. KG
-
Ghost Robotics Corporation
Report Scope and Segmentation
|
Parameters |
Details |
|
Market Size in 2022 |
USD 2.25 Billion |
|
Revenue Forecast in 2030 |
USD 4.08 Billion |
|
Growth Rate |
CAGR of 6.9% from 2023 to 2030 |
|
Analysis Period |
2023–2030 |
|
Base Year Considered |
2022 |
|
Forecast Period |
2023–2030 |
|
Market Size Estimation |
Billion (USD) |
|
Growth Factors |
|
|
Countries Covered |
28 |
|
Companies Profiled |
15 |
|
Market Share |
Available for 10 companies |
|
Customization Scope |
Free customization (equivalent up to 80 working hours of analysts) after purchase. Addition or alteration to country, regional, and segment scope. |
|
Pricing and Purchase Options |
Avail customized purchase options to meet your exact research needs. |
 Market Revenue by 2030 (Billion USD)")
 Market Segmentation")
 Market Major Regions")
About the Author
 Sikha Haritwal is an assistant manager with strong expertise in market research, data analysis, and cross-functional coordination. She plays a key role in leading complex research initiatives, strengthening analytical rigor, and enabling data-driven decision-making across teams. Known for her leadership mindset and structured problem-solving approach, she supports process improvement, enhances operational efficiency, and contributes to building scalable frameworks that drive long-term strategic outcomes and organizational effectiveness.
About the Reviewer
 Supradip Baul is an accomplished business consultant and strategist with over a decade of rich experience in market intelligence, strategy, technology, and business transformation. His work has included rigorous qualitative and quantitative analysis across multiple industries, helping clients shape investment decisions and long-term roadmaps. Earlier in his career, he was associated with Gartner, where he contributed to industry-leading reports and market share analyses. He has worked with leading global companies and holds an MBA with a dual specialization in Marketing and Finance.
At Next Move Strategy Consulting, we understand that insightful market research is the cornerstone of successful business decisions. That's why we employ a robust and multifaceted approach, combining various methodologies to deliver the most accurate and actionable data for our clients.

Research Landscape
We navigate the world of research with two primary approaches:
Qualitative Approach
Our qualitative research methodologies involve immersive techniques such as in-depth interviews, focus groups, and observational studies. By engaging directly with individuals and stakeholders, we uncover valuable insights that quantitative data alone may overlook.

Quantitative Research
In tandem with qualitative methodologies, NMSC leverages the power of Quantitative Research to provide a robust foundation of numerical insights. Through systematic data collection and analysis, we quantify patterns, preferences, and market trends, offering a comprehensive view of the business landscape.
Our quantitative research approach employs diverse tools, including surveys, experiments, and statistical modelling. These methodologies enable us to gather data from a large and representative sample, ensuring the statistical significance of our findings. By employing structured questionnaires and standardized data collection methods, we guarantee the reliability and validity of the information we present to our clients.
Quantitative research is particularly effective in measuring the prevalence of trends, assessing market size, and gauging the impact of various factors on consumer behavior. The numerical precision attained through this approach equips our clients with actionable insights, facilitating data-driven decision-making and strategy formulation.


Our Specialized Toolbox for Industry-Specific Market Research
We deploy a specialized arsenal of techniques tailored to meet your unique requirements. Here's a glimpse into our comprehensive toolbox:

Information Procurement
The stage entails acquiring market data or relevant information through various sources and methodologies.


Market Research Approach
We utilize both top-down and bottom-up approaches in market research analysis to achieve a comprehensive understanding of the market dynamics, leveraging the broad perspective of industry trends and macroeconomic factors alongside detailed insights from specific segments and individual companies.

Porters Five Forces Analysis
We conduct Porter's Five Forces analysis to evaluate the competitive landscape of an industry, providing us with insights into factors that affect profitability and strategic positioning.

SWOT Analysis

Forecasting
We utilize a forecasting model to predict future consumption by considering parameters like population, economics, regulations, market competition, drivers, constraints, technology, and pricing. We also employ statistical techniques such as multilinear regression, exponential smoothing, moving average, ARIMA, and Monte Carlo simulations for accurate predictions. In econometric forecasting, we analyzed short-term and long-term event impacts, attributing values based on regulatory frameworks, economic factors, and market events.


 Speak to Our Analyst