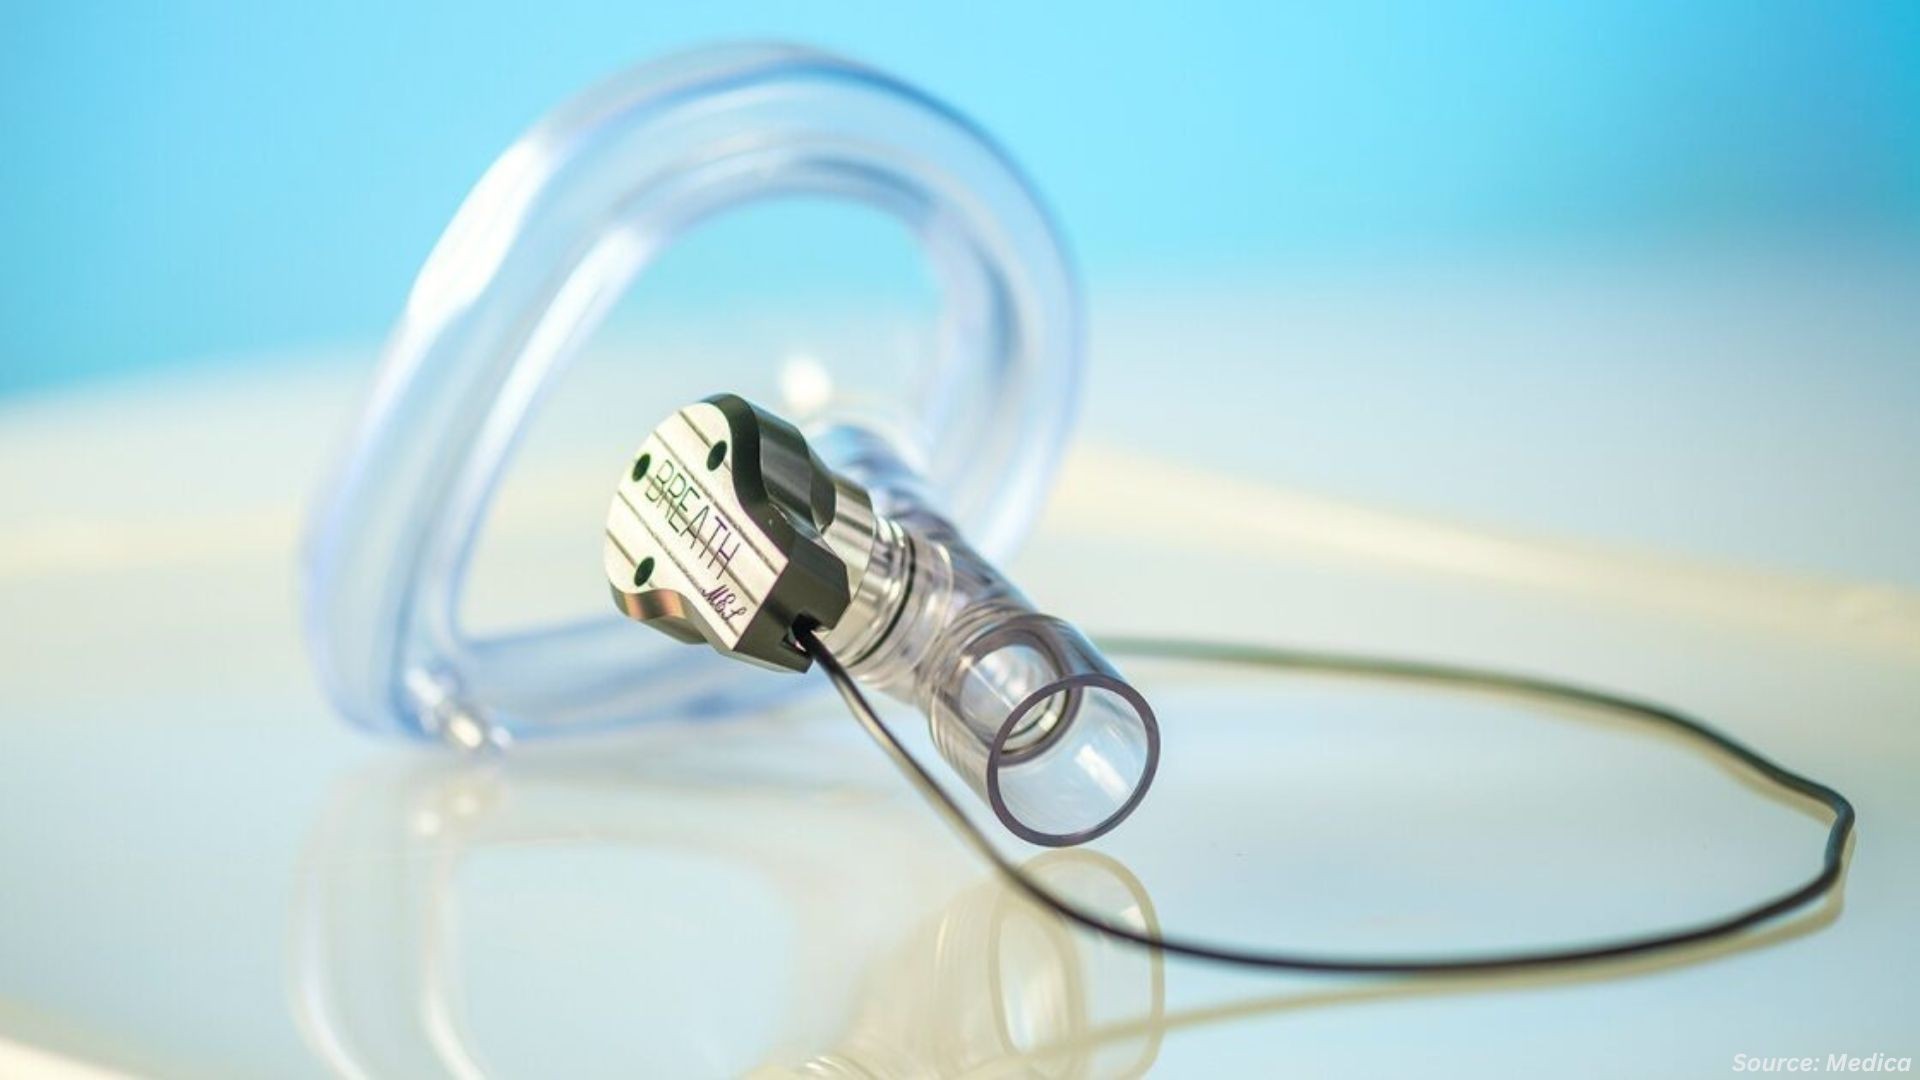
Urinary Incontinence Devices Market by Product (Urinary Catheters, Electrical Stimulation Devices, Vaginal Slings, Artificial Urinary Sphincters, and Other Devices), Category (External Urinary Incontinence Devices, and Internal Urinary Incontinence Devices), Incontinence Type (Stress Incontinence, Overflow Incontinence, Urge Incontinence, and Functional Incontinence) and End User (Clinics, Hospitals, and Other): Global Opportunity Analysis and Industry Forecast, 2020 – 2030

Urinary Incontinence Devices Market

Industry:  Life Sciences & Healthcare | Publish Date: Nov 2020 | No of Pages:  310 | No. Tables:  269 | No. Figures:  239

Market Definition:

At an estimated value of over USD 2.34 billion in 2019, the Global Urinary Incontinence Devices Market is predicted to thrive at a CAGR of 8.5% and valued at over USD 5.74 billion over the forecast year 2020-2030. Urinary incontinence is the medical condition that causes unintended leakage of urine. It is differentiated into types including, stress urinary incontinence, overflow urinary incontinence, urge urinary incontinence, and functional urinary incontinence. It is more common in women than men and the likelihood of urinary incontinence surges with age. For instance, as per the American Urological Association (AUA), about 15 million men and women suffers from Urinary incontinence and it affects about 33% of older women and 15% to 20% of older men.    

Market Dynamics and Trends:

Rising occurrence of urinary incontinence, development of technologically advanced urinary catheters, and upsurge in elderly population that normally suffers from urinary incontinence or the incontinence related to chronic conditions drive the market growth. However, lack of awareness among the incontinent patient is projected to hamper the growth of the market during forecast period. On the other hand, emerging economies around the globe are expected to offer lucrative opportunities for the market expansion. This is attributed to the burgeoning population and limited penetration of the urinary incontinence devices across these countries.


Market Segmentations and Scope of the Study:

The global urinary incontinence devices market share is segmented on the basis of product, category, incontinence type, end user, and geography. On the basis of product, the market is categorized into urinary catheters, electrical stimulation devices, vaginal slings, artificial urinary sphincters, and other devices. According to the category, the market is segmented into external urinary incontinence devices, and internal urinary incontinence devices. As per the incontinence type, the market is divided into stress incontinence, overflow incontinence, urge incontinence, and functional incontinence. On the basis of end user, the market is segmented into clinics, hospitals, and others.

Geographic fragmentation and analysis of each segment includes regions comprising North America, Europe, Asia Pacific and RoW.


Geographical Analysis:

In terms of geography, North America held major share of the market in 2019. This is due to the increased number of elderly population and the availability of technologically advanced healthcare infrastructure. However, Asia pacific is expected to witness highest growth during the forecast period due to the rising awareness regarding advanced medical devices in the region. In addition, the upsurge in number of elderly population in Japan is one of the key drivers for the urinary incontinence market in the region during the forecast period.


Competitive Landscape:

Lucrative growth opportunities make the urinary incontinence devices market highly competitive. Some of the major players in the market are Coloplast, C. R. Bard, Boston Scientific Corporation, Inc., ConvaTec Group Plc, Ethicon, Inc., Covidien plc (Medtronic), Prosurg, Inc., Caldera Medical Inc, Cook Medical, Cogentix Medical Inc. and many more. A number of developmental strategies have been adopted by companies in the past few years. For instance, in August 2019, Elidah Inc., a medical device company launched ELITONE, the only and first patented medical device that offers non-invasive treatment for stress urinary incontinence in women.

KEY BENEFITS:

  • The urinary incontinence devices market report provides the quantitative analysis of the current market and estimations through 2020-2030 that assists in identifying the prevailing market opportunities to capitalize on.

  • The study comprises an extensive analysis of the urinary incontinence devices market trend including the current and future trends for depicting the prevalent investment pockets in the market

  • The information related to key drivers, restraints and opportunities and their impact on the urinary incontinence devices market is provided in the report.

  • The market share of the players in the global Urinary Incontinence Devices market along with their competitive analysis.

  • Value chain analysis in the market study provides a clear picture of the stakeholders’ roles.

KEY MARKET SEGMENTS:

By Product

  • Urinary Catheters

    • Foley catheters

    • Other urinary catheters

  • Electrical Stimulation Devices

  • Vaginal Slings

    • Conventional vaginal slings

    • Advanced vaginal slings

  • Artificial Urinary Sphincters

  • Other Devices

By Category

  • External Urinary Incontinence Devices

  • Internal Urinary Incontinence Devices

By Incontinence Type

  • Stress Incontinence

  • Overflow Incontinence

  • Urge Incontinence

  • Functional Incontinence

By End User

  • Clinics

  • Hospitals

  • Other

By Region

  • North America

    • U.S.

    • Canada

    • Mexico

  • Europe

    • UK

    • Germany

    • Spain

    • France

    • Rest of Europe

  • Asia-Pacific

    • Japan

    • India

    • Australia

    • China

    • Rest of Asia-Pacific

  • RoW

    • Brazil

    • South Africa

    • Turkey

    • Saudi Arabia

    • Remaining Countries

REPORT SCOPE AND SEGMENTATION:

Parameters

Details

Analysis Period

2019–2030

Base Year Considered

2020

Forecast Period

2020–2030

Market Size Estimation

Billion (USD)

Market Segmentation

By Product (Urinary Catheters, Vaginal Slings, Electrical Stimulation Devices, Artificial Urinary Sphincters, Other Product) By Incontinence Type (Stress Urinary Incontinence, Urge Urinary Incontinence, Overflow Urinary Incontinence, Functional Urinary Incontinence) By Category (External Urinary Incontinence Devices, Internal Urinary Incontinence Devices) By End User (Hospitals, Clinics, Other End User)

Geographical Segmentation

North America (U.S., Canada, Mexico) Europe (UK, Germany, Spain, France, Rest of Europe), Asia-Pacific (China, Japan, India, Australia, Rest of APAC), Rest of the World (Brazil, Turkey, South Africa, Saudi Arabia, Remaining Countries)

Companies Profiled

Coloplast, C. R. Bard, Boston Scientific Corporation, Inc., ConvaTec Group Plc, Ethicon, Inc., Covidien plc (Medtronic), Prosurg, Inc., Caldera Medical Inc, Cook Medical, Cogentix Medical Inc.

column chart pie chart

Test

TABLE OF CONTENT

1.... INTRODUCTION

1.1.           REPORT DESCRIPTION

1.2.           Research Methodology

1.2.1               Secondary Research

1.2.2               Data Analysis Framework

1.2.3               Market size estimation

1.2.4               Forecasting

1.2.5               Primary Research and Data Validation

2.... MARKET SNAPSHOT, 2019-2030 Million USD

2.1.           MARKET SNAPSHOT

3.... PORTER’S FIVE FORCE MODEL ANALYSIS

4.... MARKET DYNAMICS

4.1.           GROWTH DRIVERS

4.1.1               DRIVER 1

4.1.2               DRIVER 2

4.1.3               DRIVER 3

4.1.4               DRIVER 4

4.2.           CHALLENGES

4.2.1               CHALLENGE 1

4.2.2               CHALLENGE 2

4.3.           OPPORTUNITIES

4.3.1               OPPORTUNITY 1

4.3.2               OPPORTUNITY 2

5.... Global  Urinary Incontinence Devices  Market, By Product

5.1.           Overview

5.2.           Urinary Catheters

5.2.1               Global Urinary Catheters Market, By Product

5.2.1.1          Foley Catheters Market, By Region

5.2.1.1.1          North America Foley Catheters Market, By Country

5.2.1.1.2          Europe Foley Catheters Market, By Country

5.2.1.1.3          Asia-Pacific Foley Catheters Market, By Country

5.2.1.1.4          Rest of World Foley Catheters Market, By Country

5.2.1.2          Other Urinary Catheters Market, By Region

5.2.1.2.1          North America Other Urinary Catheters Market, By Country

5.2.1.2.2          Europe Other Urinary Catheters Market, By Country

5.2.1.2.3          Asia-Pacific Other Urinary Catheters Market, By Country

5.2.1.2.4          Rest of World Other Urinary Catheters Market, By Country

5.2.2               Urinary Catheters Market, By Region

5.2.2.1          North America Urinary Catheters Market, By Country

5.2.2.2          Europe Urinary Catheters Market, By Country

5.2.2.3          Asia-Pacific Urinary Catheters Market, By Country

5.2.2.4          Rest of World Urinary Catheters Market, By Country

5.3.           Vaginal Slings

5.3.1               Global Vaginal Slings Market, By Product

5.3.1.1          Conventional Vaginal Slings Market, By Region

5.3.1.1.1          North America Conventional Vaginal Slings Market, By Country

5.3.1.1.2          Europe Conventional Vaginal Slings Market, By Country

5.3.1.1.3          Asia-Pacific Conventional Vaginal Slings Market, By Country

5.3.1.1.4          Rest of World Conventional Vaginal Slings Market, By Country

5.3.1.2          Advanced  Vaginal Slings Market, By Region

5.3.1.2.1          North America Advanced  Vaginal Slings Market, By Country

5.3.1.2.2          Europe Advanced  Vaginal Slings Market, By Country

5.3.1.2.3          Asia-Pacific Advanced  Vaginal Slings Market, By Country

5.3.1.2.4          Rest of World Advanced  Vaginal Slings Market, By Country

5.3.2               Vaginal Slings Market, By Region

5.3.2.1          North America Vaginal Slings Market, By Country

5.3.2.2          Europe Vaginal Slings Market, By Country

5.3.2.3          Asia-Pacific Vaginal Slings Market, By Country

5.3.2.4          Rest of World Vaginal Slings Market, By Country

5.4.           Electrical Stimulation Devices

5.4.1               Electrical Stimulation Devices Market, By Region

5.4.1.1          North America Electrical Stimulation Devices Market, By Country

5.4.1.2          Europe Electrical Stimulation Devices Market, By Country

5.4.1.3          Asia-Pacific Electrical Stimulation Devices Market, By Country

5.4.1.4          Rest of World Electrical Stimulation Devices Market, By Country

5.5.           Artificial Urinary Sphincters

5.5.1               Artificial Urinary Sphincters Market, By Region

5.5.1.1          North America Artificial Urinary Sphincters Market, By Country

5.5.1.2          Europe Artificial Urinary Sphincters Market, By Country

5.5.1.3          Asia-Pacific Artificial Urinary Sphincters Market, By Country

5.5.1.4          Rest of World Artificial Urinary Sphincters Market, By Country

5.6.           Other Product

5.6.1               Other Product Market, By Region

5.6.1.1          North America Other Product Market, By Country

5.6.1.2          Europe Other Product Market, By Country

5.6.1.3          Asia-Pacific Other Product Market, By Country

5.6.1.4          Rest of World Other Product Market, By Country

6.... Global  Urinary Incontinence Devices  Market, By Incontinence Type

6.1.           Overview

6.2.           Stress Urinary Incontinence

6.2.1               Stress Urinary Incontinence Market, By Region

6.2.1.1          North America Stress Urinary Incontinence Market, By Country

6.2.1.2          Europe Stress Urinary Incontinence Market, By Country

6.2.1.3          Asia-Pacific Stress Urinary Incontinence Market, By Country

6.2.1.4          Rest of World Stress Urinary Incontinence Market, By Country

6.3.           Urge Urinary Incontinence

6.3.1               Urge Urinary Incontinence Market, By Region

6.3.1.1          North America Urge Urinary Incontinence Market, By Country

6.3.1.2          Europe Urge Urinary Incontinence Market, By Country

6.3.1.3          Asia-Pacific Urge Urinary Incontinence Market, By Country

6.3.1.4          Rest of World Urge Urinary Incontinence Market, By Country

6.4.           Overflow Urinary Incontinence

6.4.1               Overflow Urinary Incontinence Market, By Region

6.4.1.1          North America Overflow Urinary Incontinence Market, By Country

6.4.1.2          Europe Overflow Urinary Incontinence Market, By Country

6.4.1.3          Asia-Pacific Overflow Urinary Incontinence Market, By Country

6.4.1.4          Rest of World Overflow Urinary Incontinence Market, By Country

6.5.           Functional Urinary Incontinence

6.5.1               Functional Urinary Incontinence Market, By Region

6.5.1.1          North America Functional Urinary Incontinence Market, By Country

6.5.1.2          Europe Functional Urinary Incontinence Market, By Country

6.5.1.3          Asia-Pacific Functional Urinary Incontinence Market, By Country

6.5.1.4          Rest of World Functional Urinary Incontinence Market, By Country

7.... Global  Urinary Incontinence Devices  Market, By Category

7.1.           Overview

7.2.           External Urinary Incontinence Devices

7.2.1               External Urinary Incontinence Devices Market, By Region

7.2.1.1          North America External Urinary Incontinence Devices Market, By Country

7.2.1.2          Europe External Urinary Incontinence Devices Market, By Country

7.2.1.3          Asia-Pacific External Urinary Incontinence Devices Market, By Country

7.2.1.4          Rest of World External Urinary Incontinence Devices Market, By Country

7.3.           Internal Urinary Incontinence Devices

7.3.1               Internal Urinary Incontinence Devices Market, By Region

7.3.1.1          North America Internal Urinary Incontinence Devices Market, By Country

7.3.1.2          Europe Internal Urinary Incontinence Devices Market, By Country

7.3.1.3          Asia-Pacific Internal Urinary Incontinence Devices Market, By Country

7.3.1.4          Rest of World Internal Urinary Incontinence Devices Market, By Country

8.... Global  Urinary Incontinence Devices  Market, By End User

8.1.           Overview

8.2.           Hospitals

8.2.1               Hospitals Market, By Region

8.2.1.1          North America Hospitals Market, By Country

8.2.1.2          Europe Hospitals Market, By Country

8.2.1.3          Asia-Pacific Hospitals Market, By Country

8.2.1.4          Rest of World Hospitals Market, By Country

8.3.           Clinics

8.3.1               Clinics Market, By Region

8.3.1.1          North America Clinics Market, By Country

8.3.1.2          Europe Clinics Market, By Country

8.3.1.3          Asia-Pacific Clinics Market, By Country

8.3.1.4          Rest of World Clinics Market, By Country

8.4.           Other End User

8.4.1               Other End User Market, By Region

8.4.1.1          North America Other End User Market, By Country

8.4.1.2          Europe Other End User Market, By Country

8.4.1.3          Asia-Pacific Other End User Market, By Country

8.4.1.4          Rest of World Other End User Market, By Country

9.... Global  Urinary Incontinence Devices  Market, By Region

9.1.           Overview

9.2.           North America

9.2.1               North America Urinary Incontinence Devices  Market, By Product

9.2.1.1          North America  Urinary Catheters Market, By Product

9.2.1.2          North America  Vaginal Slings Market, By Product

9.2.2               North America Urinary Incontinence Devices  Market, By Incontinence Type

9.2.3               North America Urinary Incontinence Devices  Market, By Category

9.2.4               North America Urinary Incontinence Devices  Market, By End User

9.2.5               North America Urinary Incontinence Devices , Market By Country

9.2.5.1          U.S.

9.2.5.1.1          U.S. Urinary Incontinence Devices  Market, By Product

9.2.5.1.1.1.      U.S. Urinary Catheters Market, By Product

9.2.5.1.1.2.      U.S. Vaginal Slings Market, By Product

9.2.5.1.2          U.S. Urinary Incontinence Devices  Market, By Incontinence Type

9.2.5.1.3          U.S. Urinary Incontinence Devices  Market, By Category

9.2.5.1.4          U.S. Urinary Incontinence Devices  Market, By End User

9.2.5.2          Canada

9.2.5.2.1          Canada Urinary Incontinence Devices  Market, By Product

9.2.5.2.1.1.      Canada Urinary Catheters Market, By Product

9.2.5.2.1.2.      Canada Vaginal Slings Market, By Product

9.2.5.2.2          Canada Urinary Incontinence Devices  Market, By Incontinence Type

9.2.5.2.3          Canada Urinary Incontinence Devices  Market, By Category

9.2.5.2.4          Canada Urinary Incontinence Devices  Market, By End User

9.2.5.3          Mexico

9.2.5.3.1          Mexico Urinary Incontinence Devices  Market, By Product

9.2.5.3.1.1.      Mexico Urinary Catheters Market, By Product

9.2.5.3.1.2.      Mexico Vaginal Slings Market, By Product

9.2.5.3.2          Mexico Urinary Incontinence Devices  Market, By Incontinence Type

9.2.5.3.3          Mexico Urinary Incontinence Devices  Market, By Category

9.2.5.3.4          Mexico Urinary Incontinence Devices  Market, By End User

9.3.           Europe

9.3.1               Europe Urinary Incontinence Devices  Market, By Product

9.3.1.1          Europe  Urinary Catheters Market, By Product

9.3.1.2          Europe  Vaginal Slings Market, By Product

9.3.2               Europe Urinary Incontinence Devices  Market, By Incontinence Type

9.3.3               Europe Urinary Incontinence Devices  Market, By Category

9.3.4               Europe Urinary Incontinence Devices  Market, By End User

9.3.5               Europe Urinary Incontinence Devices , Market By Country

9.3.5.1          UK

9.3.5.1.1          UK Urinary Incontinence Devices  Market, By Product

9.3.5.1.1.1.      UK Urinary Catheters Market, By Product

9.3.5.1.1.2.      UK Vaginal Slings Market, By Product

9.3.5.1.2          UK Urinary Incontinence Devices  Market, By Incontinence Type

9.3.5.1.3          UK Urinary Incontinence Devices  Market, By Category

9.3.5.1.4          UK Urinary Incontinence Devices  Market, By End User

9.3.5.2          Germany

9.3.5.2.1          Germany Urinary Incontinence Devices  Market, By Product

9.3.5.2.1.1.      Germany Urinary Catheters Market, By Product

9.3.5.2.1.2.      Germany Vaginal Slings Market, By Product

9.3.5.2.2          Germany Urinary Incontinence Devices  Market, By Incontinence Type

9.3.5.2.3          Germany Urinary Incontinence Devices  Market, By Category

9.3.5.2.4          Germany Urinary Incontinence Devices  Market, By End User

9.3.5.3          France

9.3.5.3.1          France Urinary Incontinence Devices  Market, By Product

9.3.5.3.1.1.      France Urinary Catheters Market, By Product

9.3.5.3.1.2.      France Vaginal Slings Market, By Product

9.3.5.3.2          France Urinary Incontinence Devices  Market, By Incontinence Type

9.3.5.3.3          France Urinary Incontinence Devices  Market, By Category

9.3.5.3.4          France Urinary Incontinence Devices  Market, By End User

9.3.5.4          Spain

9.3.5.4.1          Spain Urinary Incontinence Devices  Market, By Product

9.3.5.4.1.1.      Spain Urinary Catheters Market, By Product

9.3.5.4.1.2.      Spain Vaginal Slings Market, By Product

9.3.5.4.2          Spain Urinary Incontinence Devices  Market, By Incontinence Type

9.3.5.4.3          Spain Urinary Incontinence Devices  Market, By Category

9.3.5.4.4          Spain Urinary Incontinence Devices  Market, By End User

9.3.5.5          Rest of Europe

9.3.5.5.1          Rest of Europe Urinary Incontinence Devices  Market, By Product

9.3.5.5.1.1.      Rest of Europe Urinary Catheters Market, By Product

9.3.5.5.1.2.      Rest of Europe Vaginal Slings Market, By Product

9.3.5.5.2          Rest of Europe Urinary Incontinence Devices  Market, By Incontinence Type

9.3.5.5.3          Rest of Europe Urinary Incontinence Devices  Market, By Category

9.3.5.5.4          Rest of Europe Urinary Incontinence Devices  Market, By End User

9.4.           Asia-Pacific

9.4.1               Asia-Pacific Urinary Incontinence Devices  Market, By Product

9.4.1.1          Asia-Pacific  Urinary Catheters Market, By Product

9.4.1.2          Asia-Pacific  Vaginal Slings Market, By Product

9.4.2               Asia-Pacific Urinary Incontinence Devices  Market, By Incontinence Type

9.4.3               Asia-Pacific Urinary Incontinence Devices  Market, By Category

9.4.4               Asia-Pacific Urinary Incontinence Devices  Market, By End User

9.4.5               Asia-Pacific Urinary Incontinence Devices , Market By Country

9.4.5.1          India

9.4.5.1.1          India Urinary Incontinence Devices  Market, By Product

9.4.5.1.1.1.      India Urinary Catheters Market, By Product

9.4.5.1.1.2.      India Vaginal Slings Market, By Product

9.4.5.1.2          India Urinary Incontinence Devices  Market, By Incontinence Type

9.4.5.1.3          India Urinary Incontinence Devices  Market, By Category

9.4.5.1.4          India Urinary Incontinence Devices  Market, By End User

9.4.5.2          China

9.4.5.2.1          China Urinary Incontinence Devices  Market, By Product

9.4.5.2.1.1.      China Urinary Catheters Market, By Product

9.4.5.2.1.2.      China Vaginal Slings Market, By Product

9.4.5.2.2          China Urinary Incontinence Devices  Market, By Incontinence Type

9.4.5.2.3          China Urinary Incontinence Devices  Market, By Category

9.4.5.2.4          China Urinary Incontinence Devices  Market, By End User

9.4.5.3          Japan

9.4.5.3.1          Japan Urinary Incontinence Devices  Market, By Product

9.4.5.3.1.1.      Japan Urinary Catheters Market, By Product

9.4.5.3.1.2.      Japan Vaginal Slings Market, By Product

9.4.5.3.2          Japan Urinary Incontinence Devices  Market, By Incontinence Type

9.4.5.3.3          Japan Urinary Incontinence Devices  Market, By Category

9.4.5.3.4          Japan Urinary Incontinence Devices  Market, By End User

9.4.5.4          Australia

9.4.5.4.1          Australia Urinary Incontinence Devices  Market, By Product

9.4.5.4.1.1.      Australia Urinary Catheters Market, By Product

9.4.5.4.1.2.      Australia Vaginal Slings Market, By Product

9.4.5.4.2          Australia Urinary Incontinence Devices  Market, By Incontinence Type

9.4.5.4.3          Australia Urinary Incontinence Devices  Market, By Category

9.4.5.4.4          Australia Urinary Incontinence Devices  Market, By End User

9.4.5.5          Rest of Asia-Pacific

9.4.5.5.1          Rest of Asia-Pacific Urinary Incontinence Devices  Market, By Product

9.4.5.5.1.1.      Rest of Asia-Pacific Urinary Catheters Market, By Product

9.4.5.5.1.2.      Rest of Asia-Pacific Vaginal Slings Market, By Product

9.4.5.5.2          Rest of Asia-Pacific Urinary Incontinence Devices  Market, By Incontinence Type

9.4.5.5.3          Rest of Asia-Pacific Urinary Incontinence Devices  Market, By Category

9.4.5.5.4          Rest of Asia-Pacific Urinary Incontinence Devices  Market, By End User

9.5.           Rest of World

9.5.1               Rest of World Urinary Incontinence Devices  Market, By Product

9.5.1.1          Rest of World  Urinary Catheters Market, By Product

9.5.1.2          Rest of World  Vaginal Slings Market, By Product

9.5.2               Rest of World Urinary Incontinence Devices  Market, By Incontinence Type

9.5.3               Rest of World Urinary Incontinence Devices  Market, By Category

9.5.4               Rest of World Urinary Incontinence Devices  Market, By End User

9.5.5               Rest of World Urinary Incontinence Devices , Market By Country

9.5.5.1          Brazil

9.5.5.1.1          Brazil Urinary Incontinence Devices  Market, By Product

9.5.5.1.1.1.      Brazil Urinary Catheters Market, By Product

9.5.5.1.1.2.      Brazil Vaginal Slings Market, By Product

9.5.5.1.2          Brazil Urinary Incontinence Devices  Market, By Incontinence Type

9.5.5.1.3          Brazil Urinary Incontinence Devices  Market, By Category

9.5.5.1.4          Brazil Urinary Incontinence Devices  Market, By End User

9.5.5.2          Turkey

9.5.5.2.1          Turkey Urinary Incontinence Devices  Market, By Product

9.5.5.2.1.1.      Turkey Urinary Catheters Market, By Product

9.5.5.2.1.2.      Turkey Vaginal Slings Market, By Product

9.5.5.2.2          Turkey Urinary Incontinence Devices  Market, By Incontinence Type

9.5.5.2.3          Turkey Urinary Incontinence Devices  Market, By Category

9.5.5.2.4          Turkey Urinary Incontinence Devices  Market, By End User

9.5.5.3          South Africa

9.5.5.3.1          South Africa Urinary Incontinence Devices  Market, By Product

9.5.5.3.1.1.      South Africa Urinary Catheters Market, By Product

9.5.5.3.1.2.      South Africa Vaginal Slings Market, By Product

9.5.5.3.2          South Africa Urinary Incontinence Devices  Market, By Incontinence Type

9.5.5.3.3          South Africa Urinary Incontinence Devices  Market, By Category

9.5.5.3.4          South Africa Urinary Incontinence Devices  Market, By End User

9.5.5.4          Saudi Arabia

9.5.5.4.1          Saudi Arabia Urinary Incontinence Devices  Market, By Product

9.5.5.4.1.1.      Saudi Arabia Urinary Catheters Market, By Product

9.5.5.4.1.2.      Saudi Arabia Vaginal Slings Market, By Product

9.5.5.4.2          Saudi Arabia Urinary Incontinence Devices  Market, By Incontinence Type

9.5.5.4.3          Saudi Arabia Urinary Incontinence Devices  Market, By Category

9.5.5.4.4          Saudi Arabia Urinary Incontinence Devices  Market, By End User

9.5.5.5          Remaining Countries

9.5.5.5.1          Remaining Countries Urinary Incontinence Devices  Market, By Product

9.5.5.5.1.1.      Remaining Countries Urinary Catheters Market, By Product

9.5.5.5.1.2.      Remaining Countries Vaginal Slings Market, By Product

9.5.5.5.2          Remaining Countries Urinary Incontinence Devices  Market, By Incontinence Type

9.5.5.5.3          Remaining Countries Urinary Incontinence Devices  Market, By Category

9.5.5.5.4          Remaining Countries Urinary Incontinence Devices  Market, By End User

10. COMPANY PROFILES

10.1.         Boston Scientific Corporation

10.1.1             COMPANY OVERVIEW

10.1.2             COMPANY SNAPSHOT

10.1.3             OPERATING BUSINESS SEGMENTS

10.1.4             PRODUCT PORTFOLIO

10.1.5             BUSINESS PERFORMANCE

10.1.6             KEY STRATEGIC MOVES AND DEVELOPMENT

10.2.         Caldera Medical

10.2.1             COMPANY OVERVIEW

10.2.2             COMPANY SNAPSHOT

10.2.3             OPERATING BUSINESS SEGMENTS

10.2.4             PRODUCT PORTFOLIO

10.2.5             BUSINESS PERFORMANCE

10.2.6             KEY STRATEGIC MOVES AND DEVELOPMENT

10.3.         Cogentix Medical Inc.

10.3.1             COMPANY OVERVIEW

10.3.2             COMPANY SNAPSHOT

10.3.3             OPERATING BUSINESS SEGMENTS

10.3.4             PRODUCT PORTFOLIO

10.3.5             BUSINESS PERFORMANCE

10.3.6             KEY STRATEGIC MOVES AND DEVELOPMENT

10.4.         Coloplast A/S

10.4.1             COMPANY OVERVIEW

10.4.2             COMPANY SNAPSHOT

10.4.3             OPERATING BUSINESS SEGMENTS

10.4.4             PRODUCT PORTFOLIO

10.4.5             BUSINESS PERFORMANCE

10.4.6             KEY STRATEGIC MOVES AND DEVELOPMENT

10.5.         ConvaTec Healthcare B S..r.l.

10.5.1             COMPANY OVERVIEW

10.5.2             COMPANY SNAPSHOT

10.5.3             OPERATING BUSINESS SEGMENTS

10.5.4             PRODUCT PORTFOLIO

10.5.5             BUSINESS PERFORMANCE

10.5.6             KEY STRATEGIC MOVES AND DEVELOPMENT

10.6.         Cook Medical

10.6.1             COMPANY OVERVIEW

10.6.2             COMPANY SNAPSHOT

10.6.3             OPERATING BUSINESS SEGMENTS

10.6.4             PRODUCT PORTFOLIO

10.6.5             BUSINESS PERFORMANCE

10.6.6             KEY STRATEGIC MOVES AND DEVELOPMENT

10.7.         C.R. Bard Inc.

10.7.1             COMPANY OVERVIEW

10.7.2             COMPANY SNAPSHOT

10.7.3             OPERATING BUSINESS SEGMENTS

10.7.4             PRODUCT PORTFOLIO

10.7.5             BUSINESS PERFORMANCE

10.7.6             KEY STRATEGIC MOVES AND DEVELOPMENT

10.8.         Johnson & Johnson (Ethicon Inc.)

10.8.1             COMPANY OVERVIEW

10.8.2             COMPANY SNAPSHOT

10.8.3             OPERATING BUSINESS SEGMENTS

10.8.4             PRODUCT PORTFOLIO

10.8.5             BUSINESS PERFORMANCE

10.8.6             KEY STRATEGIC MOVES AND DEVELOPMENT

10.9.         Medtronic Plc. (Covidien Ltd.)

10.9.1             COMPANY OVERVIEW

10.9.2             COMPANY SNAPSHOT

10.9.3             OPERATING BUSINESS SEGMENTS

10.9.4             PRODUCT PORTFOLIO

10.9.5             BUSINESS PERFORMANCE

10.9.6             KEY STRATEGIC MOVES AND DEVELOPMENT

10.10.      ProSurg Inc.

10.10.1          COMPANY OVERVIEW

10.10.2          COMPANY SNAPSHOT

10.10.3          OPERATING BUSINESS SEGMENTS

10.10.4          PRODUCT PORTFOLIO

10.10.5          BUSINESS PERFORMANCE

10.10.6          KEY STRATEGIC MOVES AND DEVELOPMENT

LIST OF TABLES

TABLE 1.          Global  Urinary Incontinence Devices  Market Value, By Product, 2019-2030, Million USD

TABLE 2.          Global Urinary Catheters Market Value, By Product, 2019-2030, Million USD

TABLE 3.          Foley Catheters Market Value, By Region, 2019-2030, Million USD

TABLE 4.          North America Foley Catheters Market Value, By Country, 2019-2030, Million USD

TABLE 5.          Europe Foley Catheters Market Value, By Country, 2019-2030, Million USD

TABLE 6.          Asia-Pacific Foley Catheters Market Value, By Country, 2019-2030, Million USD

TABLE 7.          Rest of World Foley Catheters Market Value, By Country, 2019-2030, Million USD

TABLE 8.          Other Urinary Catheters Market Value, By Region, 2019-2030, Million USD

TABLE 9.          North America Other Urinary Catheters Market Value, By Country, 2019-2030, Million USD

TABLE 10.       Europe Other Urinary Catheters Market Value, By Country, 2019-2030, Million USD

TABLE 11.       Asia-Pacific Other Urinary Catheters Market Value, By Country, 2019-2030, Million USD

TABLE 12.       Rest of World Other Urinary Catheters Market Value, By Country, 2019-2030, Million USD

TABLE 13.       Urinary Catheters Market Value, By Region, 2019-2030, Million USD

TABLE 14.       North America Urinary Catheters Market Value, By Country, 2019-2030, Million USD

TABLE 15.       Europe Urinary Catheters Market Value, By Country, 2019-2030, Million USD

TABLE 16.       Asia-Pacific Urinary Catheters Market Value, By Country, 2019-2030, Million USD

TABLE 17.       Rest of World Urinary Catheters Market Value, By Country, 2019-2030, Million USD

TABLE 18.       Global Vaginal Slings Market Value, By Product, 2019-2030, Million USD

TABLE 19.       Conventional Vaginal Slings Market Value, By Region, 2019-2030, Million USD

TABLE 20.       North America Conventional Vaginal Slings Market Value, By Country, 2019-2030, Million USD

TABLE 21.       Europe Conventional Vaginal Slings Market Value, By Country, 2019-2030, Million USD

TABLE 22.       Asia-Pacific Conventional Vaginal Slings Market Value, By Country, 2019-2030, Million USD

TABLE 23.       Rest of World Conventional Vaginal Slings Market Value, By Country, 2019-2030, Million USD

TABLE 24.       Advanced  Vaginal Slings Market Value, By Region, 2019-2030, Million USD

TABLE 25.       North America Advanced  Vaginal Slings Market Value, By Country, 2019-2030, Million USD

TABLE 26.       Europe Advanced  Vaginal Slings Market Value, By Country, 2019-2030, Million USD

TABLE 27.       Asia-Pacific Advanced  Vaginal Slings Market Value, By Country, 2019-2030, Million USD

TABLE 28.       Rest of World Advanced  Vaginal Slings Market Value, By Country, 2019-2030, Million USD

TABLE 29.       Vaginal Slings Market Value, By Region, 2019-2030, Million USD

TABLE 30.       North America Vaginal Slings Market Value, By Country, 2019-2030, Million USD

TABLE 31.       Europe Vaginal Slings Market Value, By Country, 2019-2030, Million USD

TABLE 32.       Asia-Pacific Vaginal Slings Market Value, By Country, 2019-2030, Million USD

TABLE 33.       Rest of World Vaginal Slings Market Value, By Country, 2019-2030, Million USD

TABLE 34.       Electrical Stimulation Devices Market Value, By Region, 2019-2030, Million USD

TABLE 35.       North America Electrical Stimulation Devices Market Value, By Country, 2019-2030, Million USD

TABLE 36.       Europe Electrical Stimulation Devices Market Value, By Country, 2019-2030, Million USD

TABLE 37.       Asia-Pacific Electrical Stimulation Devices Market Value, By Country, 2019-2030, Million USD

TABLE 38.       Rest of World Electrical Stimulation Devices Market Value, By Country, 2019-2030, Million USD

TABLE 39.       Artificial Urinary Sphincters Market Value, By Region, 2019-2030, Million USD

TABLE 40.       North America Artificial Urinary Sphincters Market Value, By Country, 2019-2030, Million USD

TABLE 41.       Europe Artificial Urinary Sphincters Market Value, By Country, 2019-2030, Million USD

TABLE 42.       Asia-Pacific Artificial Urinary Sphincters Market Value, By Country, 2019-2030, Million USD

TABLE 43.       Rest of World Artificial Urinary Sphincters Market Value, By Country, 2019-2030, Million USD

TABLE 44.       Other Product Market Value, By Region, 2019-2030, Million USD

TABLE 45.       North America Other Product Market Value, By Country, 2019-2030, Million USD

TABLE 46.       Europe Other Product Market Value, By Country, 2019-2030, Million USD

TABLE 47.       Asia-Pacific Other Product Market Value, By Country, 2019-2030, Million USD

TABLE 48.       Rest of World Other Product Market Value, By Country, 2019-2030, Million USD

TABLE 49.       Global  Urinary Incontinence Devices  Market Value, By Incontinence Type, 2019-2030, Million USD

TABLE 50.       Stress Urinary Incontinence Market Value, By Region, 2019-2030, Million USD

TABLE 51.       North America Stress Urinary Incontinence Market Value, By Country, 2019-2030, Million USD

TABLE 52.       Europe Stress Urinary Incontinence Market Value, By Country, 2019-2030, Million USD

TABLE 53.       Asia-Pacific Stress Urinary Incontinence Market Value, By Country, 2019-2030, Million USD

TABLE 54.       Rest of World Stress Urinary Incontinence Market Value, By Country, 2019-2030, Million USD

TABLE 55.       Urge Urinary Incontinence Market Value, By Region, 2019-2030, Million USD

TABLE 56.       North America Urge Urinary Incontinence Market Value, By Country, 2019-2030, Million USD

TABLE 57.       Europe Urge Urinary Incontinence Market Value, By Country, 2019-2030, Million USD

TABLE 58.       Asia-Pacific Urge Urinary Incontinence Market Value, By Country, 2019-2030, Million USD

TABLE 59.       Rest of World Urge Urinary Incontinence Market Value, By Country, 2019-2030, Million USD

TABLE 60.       Overflow Urinary Incontinence Market Value, By Region, 2019-2030, Million USD

TABLE 61.       North America Overflow Urinary Incontinence Market Value, By Country, 2019-2030, Million USD

TABLE 62.       Europe Overflow Urinary Incontinence Market Value, By Country, 2019-2030, Million USD

TABLE 63.       Asia-Pacific Overflow Urinary Incontinence Market Value, By Country, 2019-2030, Million USD

TABLE 64.       Rest of World Overflow Urinary Incontinence Market Value, By Country, 2019-2030, Million USD

TABLE 65.       Functional Urinary Incontinence Market Value, By Region, 2019-2030, Million USD

TABLE 66.       North America Functional Urinary Incontinence Market Value, By Country, 2019-2030, Million USD

TABLE 67.       Europe Functional Urinary Incontinence Market Value, By Country, 2019-2030, Million USD

TABLE 68.       Asia-Pacific Functional Urinary Incontinence Market Value, By Country, 2019-2030, Million USD

TABLE 69.       Rest of World Functional Urinary Incontinence Market Value, By Country, 2019-2030, Million USD

TABLE 70.       Global  Urinary Incontinence Devices  Market Value, By Category, 2019-2030, Million USD

TABLE 71.       External Urinary Incontinence Devices Market Value, By Region, 2019-2030, Million USD

TABLE 72.       North America External Urinary Incontinence Devices Market Value, By Country, 2019-2030, Million USD

TABLE 73.       Europe External Urinary Incontinence Devices Market Value, By Country, 2019-2030, Million USD

TABLE 74.       Asia-Pacific External Urinary Incontinence Devices Market Value, By Country, 2019-2030, Million USD

TABLE 75.       Rest of World External Urinary Incontinence Devices Market Value, By Country, 2019-2030, Million USD

TABLE 76.       Internal Urinary Incontinence Devices Market Value, By Region, 2019-2030, Million USD

TABLE 77.       North America Internal Urinary Incontinence Devices Market Value, By Country, 2019-2030, Million USD

TABLE 78.       Europe Internal Urinary Incontinence Devices Market Value, By Country, 2019-2030, Million USD

TABLE 79.       Asia-Pacific Internal Urinary Incontinence Devices Market Value, By Country, 2019-2030, Million USD

TABLE 80.       Rest of World Internal Urinary Incontinence Devices Market Value, By Country, 2019-2030, Million USD

TABLE 81.       Global  Urinary Incontinence Devices  Market Value, By End User, 2019-2030, Million USD

TABLE 82.       Hospitals Market Value, By Region, 2019-2030, Million USD

TABLE 83.       North America Hospitals Market Value, By Country, 2019-2030, Million USD

TABLE 84.       Europe Hospitals Market Value, By Country, 2019-2030, Million USD

TABLE 85.       Asia-Pacific Hospitals Market Value, By Country, 2019-2030, Million USD

TABLE 86.       Rest of World Hospitals Market Value, By Country, 2019-2030, Million USD

TABLE 87.       Clinics Market Value, By Region, 2019-2030, Million USD

TABLE 88.       North America Clinics Market Value, By Country, 2019-2030, Million USD

TABLE 89.       Europe Clinics Market Value, By Country, 2019-2030, Million USD

TABLE 90.       Asia-Pacific Clinics Market Value, By Country, 2019-2030, Million USD

TABLE 91.       Rest of World Clinics Market Value, By Country, 2019-2030, Million USD

TABLE 92.       Other End User Market Value, By Region, 2019-2030, Million USD

TABLE 93.       North America Other End User Market Value, By Country, 2019-2030, Million USD

TABLE 94.       Europe Other End User Market Value, By Country, 2019-2030, Million USD

TABLE 95.       Asia-Pacific Other End User Market Value, By Country, 2019-2030, Million USD

TABLE 96.       Rest of World Other End User Market Value, By Country, 2019-2030, Million USD

TABLE 97.       Global  Urinary Incontinence Devices  Market Value, By Region, 2019-2030, Million USD

TABLE 98.       North America Urinary Incontinence Devices  Market Value, By Product, 2019-2030, Million USD

TABLE 99.       North America  Urinary Catheters Market Value, By Product, 2019-2030, Million USD

TABLE 100.    North America  Vaginal Slings Market Value, By Product, 2019-2030, Million USD

TABLE 101.    North America Urinary Incontinence Devices  Market Value, By Incontinence Type, 2019-2030, Million USD

TABLE 102.    North America Urinary Incontinence Devices  Market Value, By Category, 2019-2030, Million USD

TABLE 103.    North America Urinary Incontinence Devices  Market Value, By End User, 2019-2030, Million USD

TABLE 104.    U.S. Urinary Incontinence Devices  Market Value, By Product, 2019-2030, Million USD

TABLE 105.    U.S. Urinary Catheters Market Value, By Product, 2019-2030, Million USD

TABLE 106.    U.S. Vaginal Slings Market Value, By Product, 2019-2030, Million USD

TABLE 107.    U.S. Urinary Incontinence Devices  Market Value, By Incontinence Type, 2019-2030, Million USD

TABLE 108.    U.S. Urinary Incontinence Devices  Market Value, By Category, 2019-2030, Million USD

TABLE 109.    U.S. Urinary Incontinence Devices  Market Value, By End User, 2019-2030, Million USD

TABLE 110.    Canada Urinary Incontinence Devices  Market Value, By Product, 2019-2030, Million USD

TABLE 111.    Canada Urinary Catheters Market Value, By Product, 2019-2030, Million USD

TABLE 112.    Canada Vaginal Slings Market Value, By Product, 2019-2030, Million USD

TABLE 113.    Canada Urinary Incontinence Devices  Market Value, By Incontinence Type, 2019-2030, Million USD

TABLE 114.    Canada Urinary Incontinence Devices  Market Value, By Category, 2019-2030, Million USD

TABLE 115.    Canada Urinary Incontinence Devices  Market Value, By End User, 2019-2030, Million USD

TABLE 116.    Mexico Urinary Incontinence Devices  Market Value, By Product, 2019-2030, Million USD

TABLE 117.    Mexico Urinary Catheters Market Value, By Product, 2019-2030, Million USD

TABLE 118.    Mexico Vaginal Slings Market Value, By Product, 2019-2030, Million USD

TABLE 119.    Mexico Urinary Incontinence Devices  Market Value, By Incontinence Type, 2019-2030, Million USD

TABLE 120.    Mexico Urinary Incontinence Devices  Market Value, By Category, 2019-2030, Million USD

TABLE 121.    Mexico Urinary Incontinence Devices  Market Value, By End User, 2019-2030, Million USD

TABLE 122.    Europe Urinary Incontinence Devices  Market Value, By Product, 2019-2030, Million USD

TABLE 123.    Europe  Urinary Catheters Market Value, By Product, 2019-2030, Million USD

TABLE 124.    Europe  Vaginal Slings Market Value, By Product, 2019-2030, Million USD

TABLE 125.    Europe Urinary Incontinence Devices  Market Value, By Incontinence Type, 2019-2030, Million USD

TABLE 126.    Europe Urinary Incontinence Devices  Market Value, By Category, 2019-2030, Million USD

TABLE 127.    Europe Urinary Incontinence Devices  Market Value, By End User, 2019-2030, Million USD

TABLE 128.    UK Urinary Incontinence Devices  Market Value, By Product, 2019-2030, Million USD

TABLE 129.    UK Urinary Catheters Market Value, By Product, 2019-2030, Million USD

TABLE 130.    UK Vaginal Slings Market Value, By Product, 2019-2030, Million USD

TABLE 131.    UK Urinary Incontinence Devices  Market Value, By Incontinence Type, 2019-2030, Million USD

TABLE 132.    UK Urinary Incontinence Devices  Market Value, By Category, 2019-2030, Million USD

TABLE 133.    UK Urinary Incontinence Devices  Market Value, By End User, 2019-2030, Million USD

TABLE 134.    Germany Urinary Incontinence Devices  Market Value, By Product, 2019-2030, Million USD

TABLE 135.    Germany Urinary Catheters Market Value, By Product, 2019-2030, Million USD

TABLE 136.    Germany Vaginal Slings Market Value, By Product, 2019-2030, Million USD

TABLE 137.    Germany Urinary Incontinence Devices  Market Value, By Incontinence Type, 2019-2030, Million USD

TABLE 138.    Germany Urinary Incontinence Devices  Market Value, By Category, 2019-2030, Million USD

TABLE 139.    Germany Urinary Incontinence Devices  Market Value, By End User, 2019-2030, Million USD

TABLE 140.    France Urinary Incontinence Devices  Market Value, By Product, 2019-2030, Million USD

TABLE 141.    France Urinary Catheters Market Value, By Product, 2019-2030, Million USD

TABLE 142.    France Vaginal Slings Market Value, By Product, 2019-2030, Million USD

TABLE 143.    France Urinary Incontinence Devices  Market Value, By Incontinence Type, 2019-2030, Million USD

TABLE 144.    France Urinary Incontinence Devices  Market Value, By Category, 2019-2030, Million USD

TABLE 145.    France Urinary Incontinence Devices  Market Value, By End User, 2019-2030, Million USD

TABLE 146.    Spain Urinary Incontinence Devices  Market Value, By Product, 2019-2030, Million USD

TABLE 147.    Spain Urinary Catheters Market Value, By Product, 2019-2030, Million USD

TABLE 148.    Spain Vaginal Slings Market Value, By Product, 2019-2030, Million USD

TABLE 149.    Spain Urinary Incontinence Devices  Market Value, By Incontinence Type, 2019-2030, Million USD

TABLE 150.    Spain Urinary Incontinence Devices  Market Value, By Category, 2019-2030, Million USD

TABLE 151.    Spain Urinary Incontinence Devices  Market Value, By End User, 2019-2030, Million USD

TABLE 152.    Rest of Europe Urinary Incontinence Devices  Market Value, By Product, 2019-2030, Million USD

TABLE 153.    Rest of Europe Urinary Catheters Market Value, By Product, 2019-2030, Million USD

TABLE 154.    Rest of Europe Vaginal Slings Market Value, By Product, 2019-2030, Million USD

TABLE 155.    Rest of Europe Urinary Incontinence Devices  Market Value, By Incontinence Type, 2019-2030, Million USD

TABLE 156.    Rest of Europe Urinary Incontinence Devices  Market Value, By Category, 2019-2030, Million USD

TABLE 157.    Rest of Europe Urinary Incontinence Devices  Market Value, By End User, 2019-2030, Million USD

TABLE 158.    Asia-Pacific Urinary Incontinence Devices  Market Value, By Product, 2019-2030, Million USD

TABLE 159.    Asia-Pacific  Urinary Catheters Market Value, By Product, 2019-2030, Million USD

TABLE 160.    Asia-Pacific  Vaginal Slings Market Value, By Product, 2019-2030, Million USD

TABLE 161.    Asia-Pacific Urinary Incontinence Devices  Market Value, By Incontinence Type, 2019-2030, Million USD

TABLE 162.    Asia-Pacific Urinary Incontinence Devices  Market Value, By Category, 2019-2030, Million USD

TABLE 163.    Asia-Pacific Urinary Incontinence Devices  Market Value, By End User, 2019-2030, Million USD

TABLE 164.    India Urinary Incontinence Devices  Market Value, By Product, 2019-2030, Million USD

TABLE 165.    India Urinary Catheters Market Value, By Product, 2019-2030, Million USD

TABLE 166.    India Vaginal Slings Market Value, By Product, 2019-2030, Million USD

TABLE 167.    India Urinary Incontinence Devices  Market Value, By Incontinence Type, 2019-2030, Million USD

TABLE 168.    India Urinary Incontinence Devices  Market Value, By Category, 2019-2030, Million USD

TABLE 169.    India Urinary Incontinence Devices  Market Value, By End User, 2019-2030, Million USD

TABLE 170.    China Urinary Incontinence Devices  Market Value, By Product, 2019-2030, Million USD

TABLE 171.    China Urinary Catheters Market Value, By Product, 2019-2030, Million USD

TABLE 172.    China Vaginal Slings Market Value, By Product, 2019-2030, Million USD

TABLE 173.    China Urinary Incontinence Devices  Market Value, By Incontinence Type, 2019-2030, Million USD

TABLE 174.    China Urinary Incontinence Devices  Market Value, By Category, 2019-2030, Million USD

TABLE 175.    China Urinary Incontinence Devices  Market Value, By End User, 2019-2030, Million USD

TABLE 176.    Japan Urinary Incontinence Devices  Market Value, By Product, 2019-2030, Million USD

TABLE 177.    Japan Urinary Catheters Market Value, By Product, 2019-2030, Million USD

TABLE 178.    Japan Vaginal Slings Market Value, By Product, 2019-2030, Million USD

TABLE 179.    Japan Urinary Incontinence Devices  Market Value, By Incontinence Type, 2019-2030, Million USD

TABLE 180.    Japan Urinary Incontinence Devices  Market Value, By Category, 2019-2030, Million USD

TABLE 181.    Japan Urinary Incontinence Devices  Market Value, By End User, 2019-2030, Million USD

TABLE 182.    Australia Urinary Incontinence Devices  Market Value, By Product, 2019-2030, Million USD

TABLE 183.    Australia Urinary Catheters Market Value, By Product, 2019-2030, Million USD

TABLE 184.    Australia Vaginal Slings Market Value, By Product, 2019-2030, Million USD

TABLE 185.    Australia Urinary Incontinence Devices  Market Value, By Incontinence Type, 2019-2030, Million USD

TABLE 186.    Australia Urinary Incontinence Devices  Market Value, By Category, 2019-2030, Million USD

TABLE 187.    Australia Urinary Incontinence Devices  Market Value, By End User, 2019-2030, Million USD

TABLE 188.    Rest of Asia-Pacific Urinary Incontinence Devices  Market Value, By Product, 2019-2030, Million USD

TABLE 189.    Rest of Asia-Pacific Urinary Catheters Market Value, By Product, 2019-2030, Million USD

TABLE 190.    Rest of Asia-Pacific Vaginal Slings Market Value, By Product, 2019-2030, Million USD

TABLE 191.    Rest of Asia-Pacific Urinary Incontinence Devices  Market Value, By Incontinence Type, 2019-2030, Million USD

TABLE 192.    Rest of Asia-Pacific Urinary Incontinence Devices  Market Value, By Category, 2019-2030, Million USD

TABLE 193.    Rest of Asia-Pacific Urinary Incontinence Devices  Market Value, By End User, 2019-2030, Million USD

TABLE 194.    Rest of World Urinary Incontinence Devices  Market Value, By Product, 2019-2030, Million USD

TABLE 195.    Rest of World  Urinary Catheters Market Value, By Product, 2019-2030, Million USD

TABLE 196.    Rest of World  Vaginal Slings Market Value, By Product, 2019-2030, Million USD

TABLE 197.    Rest of World Urinary Incontinence Devices  Market Value, By Incontinence Type, 2019-2030, Million USD

TABLE 198.    Rest of World Urinary Incontinence Devices  Market Value, By Category, 2019-2030, Million USD

TABLE 199.    Rest of World Urinary Incontinence Devices  Market Value, By End User, 2019-2030, Million USD

TABLE 200.    Brazil Urinary Incontinence Devices  Market Value, By Product, 2019-2030, Million USD

TABLE 201.    Brazil Urinary Catheters Market Value, By Product, 2019-2030, Million USD

TABLE 202.    Brazil Vaginal Slings Market Value, By Product, 2019-2030, Million USD

TABLE 203.    Brazil Urinary Incontinence Devices  Market Value, By Incontinence Type, 2019-2030, Million USD

TABLE 204.    Brazil Urinary Incontinence Devices  Market Value, By Category, 2019-2030, Million USD

TABLE 205.    Brazil Urinary Incontinence Devices  Market Value, By End User, 2019-2030, Million USD

TABLE 206.    Turkey Urinary Incontinence Devices  Market Value, By Product, 2019-2030, Million USD

TABLE 207.    Turkey Urinary Catheters Market Value, By Product, 2019-2030, Million USD

TABLE 208.    Turkey Vaginal Slings Market Value, By Product, 2019-2030, Million USD

TABLE 209.    Turkey Urinary Incontinence Devices  Market Value, By Incontinence Type, 2019-2030, Million USD

TABLE 210.    Turkey Urinary Incontinence Devices  Market Value, By Category, 2019-2030, Million USD

TABLE 211.    Turkey Urinary Incontinence Devices  Market Value, By End User, 2019-2030, Million USD

TABLE 212.    South Africa Urinary Incontinence Devices  Market Value, By Product, 2019-2030, Million USD

TABLE 213.    South Africa Urinary Catheters Market Value, By Product, 2019-2030, Million USD

TABLE 214.    South Africa Vaginal Slings Market Value, By Product, 2019-2030, Million USD

TABLE 215.    South Africa Urinary Incontinence Devices  Market Value, By Incontinence Type, 2019-2030, Million USD

TABLE 216.    South Africa Urinary Incontinence Devices  Market Value, By Category, 2019-2030, Million USD

TABLE 217.    South Africa Urinary Incontinence Devices  Market Value, By End User, 2019-2030, Million USD

TABLE 218.    Saudi Arabia Urinary Incontinence Devices  Market Value, By Product, 2019-2030, Million USD

TABLE 219.    Saudi Arabia Urinary Catheters Market Value, By Product, 2019-2030, Million USD

TABLE 220.    Saudi Arabia Vaginal Slings Market Value, By Product, 2019-2030, Million USD

TABLE 221.    Saudi Arabia Urinary Incontinence Devices  Market Value, By Incontinence Type, 2019-2030, Million USD

TABLE 222.    Saudi Arabia Urinary Incontinence Devices  Market Value, By Category, 2019-2030, Million USD

TABLE 223.    Saudi Arabia Urinary Incontinence Devices  Market Value, By End User, 2019-2030, Million USD

TABLE 224.    Remaining Countries Urinary Incontinence Devices  Market Value, By Product, 2019-2030, Million USD

TABLE 225.    Remaining Countries Urinary Catheters Market Value, By Product, 2019-2030, Million USD

TABLE 226.    Remaining Countries Vaginal Slings Market Value, By Product, 2019-2030, Million USD

TABLE 227.    Remaining Countries Urinary Incontinence Devices  Market Value, By Incontinence Type, 2019-2030, Million USD

TABLE 228.    Remaining Countries Urinary Incontinence Devices  Market Value, By Category, 2019-2030, Million USD

TABLE 229.    Remaining Countries Urinary Incontinence Devices  Market Value, By End User, 2019-2030, Million USD

TABLE 230.    Boston Scientific Corporation: COMPANY SNAPSHOT

TABLE 231.    Boston Scientific Corporation: OPERATING SEGMENTS

TABLE 232.    Boston Scientific Corporation: PRODUCT PORTFOLIO

TABLE 233.    Boston Scientific Corporation: KEY STRATERGY

TABLE 234.    Caldera Medical: COMPANY SNAPSHOT

TABLE 235.    Caldera Medical: OPERATING SEGMENTS

TABLE 236.    Caldera Medical: PRODUCT PORTFOLIO

TABLE 237.    Caldera Medical: KEY STRATERGY

TABLE 238.    Cogentix Medical Inc.: COMPANY SNAPSHOT

TABLE 239.    Cogentix Medical Inc.: OPERATING SEGMENTS

TABLE 240.    Cogentix Medical Inc.: PRODUCT PORTFOLIO

TABLE 241.    Cogentix Medical Inc.: KEY STRATERGY

TABLE 242.    Coloplast A/S: COMPANY SNAPSHOT

TABLE 243.    Coloplast A/S: OPERATING SEGMENTS

TABLE 244.    Coloplast A/S: PRODUCT PORTFOLIO

TABLE 245.    Coloplast A/S: KEY STRATERGY

TABLE 246.    ConvaTec Healthcare B S..r.l.: COMPANY SNAPSHOT

TABLE 247.    ConvaTec Healthcare B S..r.l.: OPERATING SEGMENTS

TABLE 248.    ConvaTec Healthcare B S..r.l.: PRODUCT PORTFOLIO

TABLE 249.    ConvaTec Healthcare B S..r.l.: KEY STRATERGY

TABLE 250.    Cook Medical: COMPANY SNAPSHOT

TABLE 251.    Cook Medical: OPERATING SEGMENTS

TABLE 252.    Cook Medical: PRODUCT PORTFOLIO

TABLE 253.    Cook Medical: KEY STRATERGY

TABLE 254.    C.R. Bard Inc.: COMPANY SNAPSHOT

TABLE 255.    C.R. Bard Inc.: OPERATING SEGMENTS

TABLE 256.    C.R. Bard Inc.: PRODUCT PORTFOLIO

TABLE 257.    C.R. Bard Inc.: KEY STRATERGY

TABLE 258.    Johnson & Johnson (Ethicon Inc.): COMPANY SNAPSHOT

TABLE 259.    Johnson & Johnson (Ethicon Inc.): OPERATING SEGMENTS

TABLE 260.    Johnson & Johnson (Ethicon Inc.): PRODUCT PORTFOLIO

TABLE 261.    Johnson & Johnson (Ethicon Inc.): KEY STRATERGY

TABLE 262.    Medtronic Plc. (Covidien Ltd.): COMPANY SNAPSHOT

TABLE 263.    Medtronic Plc. (Covidien Ltd.): OPERATING SEGMENTS

TABLE 264.    Medtronic Plc. (Covidien Ltd.): PRODUCT PORTFOLIO

TABLE 265.    Medtronic Plc. (Covidien Ltd.): KEY STRATERGY

TABLE 266.    ProSurg Inc.: COMPANY SNAPSHOT

TABLE 267.    ProSurg Inc.: OPERATING SEGMENTS

TABLE 268.    ProSurg Inc.: PRODUCT PORTFOLIO

TABLE 269.    ProSurg Inc.: KEY STRATERGY 

LIST OF FIGURES

FIGURE 1.       Global  Urinary Incontinence Devices  Market Value, By Product, 2019-2030, Million USD

FIGURE 2.       Global Urinary Catheters Market Value, By Product, 2019-2030, Million USD

FIGURE 3.       Foley Catheters Market Value, By Region, 2019-2030, Million USD

FIGURE 4.       North America Foley Catheters Market Value, By Country, 2019-2030, Million USD

FIGURE 5.       Europe Foley Catheters Market Value, By Country, 2019-2030, Million USD

FIGURE 6.       Asia-Pacific Foley Catheters Market Value, By Country, 2019-2030, Million USD

FIGURE 7.       Rest of World Foley Catheters Market Value, By Country, 2019-2030, Million USD

FIGURE 8.       Other Urinary Catheters Market Value, By Region, 2019-2030, Million USD

FIGURE 9.       North America Other Urinary Catheters Market Value, By Country, 2019-2030, Million USD

FIGURE 10.    Europe Other Urinary Catheters Market Value, By Country, 2019-2030, Million USD

FIGURE 11.    Asia-Pacific Other Urinary Catheters Market Value, By Country, 2019-2030, Million USD

FIGURE 12.    Rest of World Other Urinary Catheters Market Value, By Country, 2019-2030, Million USD

FIGURE 13.    Urinary Catheters Market Value, By Region, 2019-2030, Million USD

FIGURE 14.    North America Urinary Catheters Market Value, By Country, 2019-2030, Million USD

FIGURE 15.    Europe Urinary Catheters Market Value, By Country, 2019-2030, Million USD

FIGURE 16.    Asia-Pacific Urinary Catheters Market Value, By Country, 2019-2030, Million USD

FIGURE 17.    Rest of World Urinary Catheters Market Value, By Country, 2019-2030, Million USD

FIGURE 18.    Global Vaginal Slings Market Value, By Product, 2019-2030, Million USD

FIGURE 19.    Conventional Vaginal Slings Market Value, By Region, 2019-2030, Million USD

FIGURE 20.    North America Conventional Vaginal Slings Market Value, By Country, 2019-2030, Million USD

FIGURE 21.    Europe Conventional Vaginal Slings Market Value, By Country, 2019-2030, Million USD

FIGURE 22.    Asia-Pacific Conventional Vaginal Slings Market Value, By Country, 2019-2030, Million USD

FIGURE 23.    Rest of World Conventional Vaginal Slings Market Value, By Country, 2019-2030, Million USD

FIGURE 24.    Advanced  Vaginal Slings Market Value, By Region, 2019-2030, Million USD

FIGURE 25.    North America Advanced  Vaginal Slings Market Value, By Country, 2019-2030, Million USD

FIGURE 26.    Europe Advanced  Vaginal Slings Market Value, By Country, 2019-2030, Million USD

FIGURE 27.    Asia-Pacific Advanced  Vaginal Slings Market Value, By Country, 2019-2030, Million USD

FIGURE 28.    Rest of World Advanced  Vaginal Slings Market Value, By Country, 2019-2030, Million USD

FIGURE 29.    Vaginal Slings Market Value, By Region, 2019-2030, Million USD

FIGURE 30.    North America Vaginal Slings Market Value, By Country, 2019-2030, Million USD

FIGURE 31.    Europe Vaginal Slings Market Value, By Country, 2019-2030, Million USD

FIGURE 32.    Asia-Pacific Vaginal Slings Market Value, By Country, 2019-2030, Million USD

FIGURE 33.    Rest of World Vaginal Slings Market Value, By Country, 2019-2030, Million USD

FIGURE 34.    Electrical Stimulation Devices Market Value, By Region, 2019-2030, Million USD

FIGURE 35.    North America Electrical Stimulation Devices Market Value, By Country, 2019-2030, Million USD

FIGURE 36.    Europe Electrical Stimulation Devices Market Value, By Country, 2019-2030, Million USD

FIGURE 37.    Asia-Pacific Electrical Stimulation Devices Market Value, By Country, 2019-2030, Million USD

FIGURE 38.    Rest of World Electrical Stimulation Devices Market Value, By Country, 2019-2030, Million USD

FIGURE 39.    Artificial Urinary Sphincters Market Value, By Region, 2019-2030, Million USD

FIGURE 40.    North America Artificial Urinary Sphincters Market Value, By Country, 2019-2030, Million USD

FIGURE 41.    Europe Artificial Urinary Sphincters Market Value, By Country, 2019-2030, Million USD

FIGURE 42.    Asia-Pacific Artificial Urinary Sphincters Market Value, By Country, 2019-2030, Million USD

FIGURE 43.    Rest of World Artificial Urinary Sphincters Market Value, By Country, 2019-2030, Million USD

FIGURE 44.    Other Product Market Value, By Region, 2019-2030, Million USD

FIGURE 45.    North America Other Product Market Value, By Country, 2019-2030, Million USD

FIGURE 46.    Europe Other Product Market Value, By Country, 2019-2030, Million USD

FIGURE 47.    Asia-Pacific Other Product Market Value, By Country, 2019-2030, Million USD

FIGURE 48.    Rest of World Other Product Market Value, By Country, 2019-2030, Million USD

FIGURE 49.    Global  Urinary Incontinence Devices  Market Value, By Incontinence Type, 2019-2030, Million USD

FIGURE 50.    Stress Urinary Incontinence Market Value, By Region, 2019-2030, Million USD

FIGURE 51.    North America Stress Urinary Incontinence Market Value, By Country, 2019-2030, Million USD

FIGURE 52.    Europe Stress Urinary Incontinence Market Value, By Country, 2019-2030, Million USD

FIGURE 53.    Asia-Pacific Stress Urinary Incontinence Market Value, By Country, 2019-2030, Million USD

FIGURE 54.    Rest of World Stress Urinary Incontinence Market Value, By Country, 2019-2030, Million USD

FIGURE 55.    Urge Urinary Incontinence Market Value, By Region, 2019-2030, Million USD

FIGURE 56.    North America Urge Urinary Incontinence Market Value, By Country, 2019-2030, Million USD

FIGURE 57.    Europe Urge Urinary Incontinence Market Value, By Country, 2019-2030, Million USD

FIGURE 58.    Asia-Pacific Urge Urinary Incontinence Market Value, By Country, 2019-2030, Million USD

FIGURE 59.    Rest of World Urge Urinary Incontinence Market Value, By Country, 2019-2030, Million USD

FIGURE 60.    Overflow Urinary Incontinence Market Value, By Region, 2019-2030, Million USD

FIGURE 61.    North America Overflow Urinary Incontinence Market Value, By Country, 2019-2030, Million USD

FIGURE 62.    Europe Overflow Urinary Incontinence Market Value, By Country, 2019-2030, Million USD

FIGURE 63.    Asia-Pacific Overflow Urinary Incontinence Market Value, By Country, 2019-2030, Million USD

FIGURE 64.    Rest of World Overflow Urinary Incontinence Market Value, By Country, 2019-2030, Million USD

FIGURE 65.    Functional Urinary Incontinence Market Value, By Region, 2019-2030, Million USD

FIGURE 66.    North America Functional Urinary Incontinence Market Value, By Country, 2019-2030, Million USD

FIGURE 67.    Europe Functional Urinary Incontinence Market Value, By Country, 2019-2030, Million USD

FIGURE 68.    Asia-Pacific Functional Urinary Incontinence Market Value, By Country, 2019-2030, Million USD

FIGURE 69.    Rest of World Functional Urinary Incontinence Market Value, By Country, 2019-2030, Million USD

FIGURE 70.    Global  Urinary Incontinence Devices  Market Value, By Category, 2019-2030, Million USD

FIGURE 71.    External Urinary Incontinence Devices Market Value, By Region, 2019-2030, Million USD

FIGURE 72.    North America External Urinary Incontinence Devices Market Value, By Country, 2019-2030, Million USD

FIGURE 73.    Europe External Urinary Incontinence Devices Market Value, By Country, 2019-2030, Million USD

FIGURE 74.    Asia-Pacific External Urinary Incontinence Devices Market Value, By Country, 2019-2030, Million USD

FIGURE 75.    Rest of World External Urinary Incontinence Devices Market Value, By Country, 2019-2030, Million USD

FIGURE 76.    Internal Urinary Incontinence Devices Market Value, By Region, 2019-2030, Million USD

FIGURE 77.    North America Internal Urinary Incontinence Devices Market Value, By Country, 2019-2030, Million USD

FIGURE 78.    Europe Internal Urinary Incontinence Devices Market Value, By Country, 2019-2030, Million USD

FIGURE 79.    Asia-Pacific Internal Urinary Incontinence Devices Market Value, By Country, 2019-2030, Million USD

FIGURE 80.    Rest of World Internal Urinary Incontinence Devices Market Value, By Country, 2019-2030, Million USD

FIGURE 81.    Global  Urinary Incontinence Devices  Market Value, By End User, 2019-2030, Million USD

FIGURE 82.    Hospitals Market Value, By Region, 2019-2030, Million USD

FIGURE 83.    North America Hospitals Market Value, By Country, 2019-2030, Million USD

FIGURE 84.    Europe Hospitals Market Value, By Country, 2019-2030, Million USD

FIGURE 85.    Asia-Pacific Hospitals Market Value, By Country, 2019-2030, Million USD

FIGURE 86.    Rest of World Hospitals Market Value, By Country, 2019-2030, Million USD

FIGURE 87.    Clinics Market Value, By Region, 2019-2030, Million USD

FIGURE 88.    North America Clinics Market Value, By Country, 2019-2030, Million USD

FIGURE 89.    Europe Clinics Market Value, By Country, 2019-2030, Million USD

FIGURE 90.    Asia-Pacific Clinics Market Value, By Country, 2019-2030, Million USD

FIGURE 91.    Rest of World Clinics Market Value, By Country, 2019-2030, Million USD

FIGURE 92.    Other End User Market Value, By Region, 2019-2030, Million USD

FIGURE 93.    North America Other End User Market Value, By Country, 2019-2030, Million USD

FIGURE 94.    Europe Other End User Market Value, By Country, 2019-2030, Million USD

FIGURE 95.    Asia-Pacific Other End User Market Value, By Country, 2019-2030, Million USD

FIGURE 96.    Rest of World Other End User Market Value, By Country, 2019-2030, Million USD

FIGURE 97.    Global  Urinary Incontinence Devices  Market Value, By Region, 2019-2030, Million USD

FIGURE 98.    North America Urinary Incontinence Devices  Market Value, By Product, 2019-2030, Million USD

FIGURE 99.    North America  Urinary Catheters Market Value, By Product, 2019-2030, Million USD

FIGURE 100. North America  Vaginal Slings Market Value, By Product, 2019-2030, Million USD

FIGURE 101. North America Urinary Incontinence Devices  Market Value, By Incontinence Type, 2019-2030, Million USD

FIGURE 102. North America Urinary Incontinence Devices  Market Value, By Category, 2019-2030, Million USD

FIGURE 103. North America Urinary Incontinence Devices  Market Value, By End User, 2019-2030, Million USD

FIGURE 104. U.S. Urinary Incontinence Devices  Market Value, By Product, 2019-2030, Million USD

FIGURE 105. U.S. Urinary Catheters Market Value, By Product, 2019-2030, Million USD

FIGURE 106. U.S. Vaginal Slings Market Value, By Product, 2019-2030, Million USD

FIGURE 107. U.S. Urinary Incontinence Devices  Market Value, By Incontinence Type, 2019-2030, Million USD

FIGURE 108. U.S. Urinary Incontinence Devices  Market Value, By Category, 2019-2030, Million USD

FIGURE 109. U.S. Urinary Incontinence Devices  Market Value, By End User, 2019-2030, Million USD

FIGURE 110. Canada Urinary Incontinence Devices  Market Value, By Product, 2019-2030, Million USD

FIGURE 111. Canada Urinary Catheters Market Value, By Product, 2019-2030, Million USD

FIGURE 112. Canada Vaginal Slings Market Value, By Product, 2019-2030, Million USD

FIGURE 113. Canada Urinary Incontinence Devices  Market Value, By Incontinence Type, 2019-2030, Million USD

FIGURE 114. Canada Urinary Incontinence Devices  Market Value, By Category, 2019-2030, Million USD

FIGURE 115. Canada Urinary Incontinence Devices  Market Value, By End User, 2019-2030, Million USD

FIGURE 116. Mexico Urinary Incontinence Devices  Market Value, By Product, 2019-2030, Million USD

FIGURE 117. Mexico Urinary Catheters Market Value, By Product, 2019-2030, Million USD

FIGURE 118. Mexico Vaginal Slings Market Value, By Product, 2019-2030, Million USD

FIGURE 119. Mexico Urinary Incontinence Devices  Market Value, By Incontinence Type, 2019-2030, Million USD

FIGURE 120. Mexico Urinary Incontinence Devices  Market Value, By Category, 2019-2030, Million USD

FIGURE 121. Mexico Urinary Incontinence Devices  Market Value, By End User, 2019-2030, Million USD

FIGURE 122. Europe Urinary Incontinence Devices  Market Value, By Product, 2019-2030, Million USD

FIGURE 123. Europe  Urinary Catheters Market Value, By Product, 2019-2030, Million USD

FIGURE 124. Europe  Vaginal Slings Market Value, By Product, 2019-2030, Million USD

FIGURE 125. Europe Urinary Incontinence Devices  Market Value, By Incontinence Type, 2019-2030, Million USD

FIGURE 126. Europe Urinary Incontinence Devices  Market Value, By Category, 2019-2030, Million USD

FIGURE 127. Europe Urinary Incontinence Devices  Market Value, By End User, 2019-2030, Million USD

FIGURE 128. UK Urinary Incontinence Devices  Market Value, By Product, 2019-2030, Million USD

FIGURE 129. UK Urinary Catheters Market Value, By Product, 2019-2030, Million USD

FIGURE 130. UK Vaginal Slings Market Value, By Product, 2019-2030, Million USD

FIGURE 131. UK Urinary Incontinence Devices  Market Value, By Incontinence Type, 2019-2030, Million USD

FIGURE 132. UK Urinary Incontinence Devices  Market Value, By Category, 2019-2030, Million USD

FIGURE 133. UK Urinary Incontinence Devices  Market Value, By End User, 2019-2030, Million USD

FIGURE 134. Germany Urinary Incontinence Devices  Market Value, By Product, 2019-2030, Million USD

FIGURE 135. Germany Urinary Catheters Market Value, By Product, 2019-2030, Million USD

FIGURE 136. Germany Vaginal Slings Market Value, By Product, 2019-2030, Million USD

FIGURE 137. Germany Urinary Incontinence Devices  Market Value, By Incontinence Type, 2019-2030, Million USD

FIGURE 138. Germany Urinary Incontinence Devices  Market Value, By Category, 2019-2030, Million USD

FIGURE 139. Germany Urinary Incontinence Devices  Market Value, By End User, 2019-2030, Million USD

FIGURE 140. France Urinary Incontinence Devices  Market Value, By Product, 2019-2030, Million USD

FIGURE 141. France Urinary Catheters Market Value, By Product, 2019-2030, Million USD

FIGURE 142. France Vaginal Slings Market Value, By Product, 2019-2030, Million USD

FIGURE 143. France Urinary Incontinence Devices  Market Value, By Incontinence Type, 2019-2030, Million USD

FIGURE 144. France Urinary Incontinence Devices  Market Value, By Category, 2019-2030, Million USD

FIGURE 145. France Urinary Incontinence Devices  Market Value, By End User, 2019-2030, Million USD

FIGURE 146. Spain Urinary Incontinence Devices  Market Value, By Product, 2019-2030, Million USD

FIGURE 147. Spain Urinary Catheters Market Value, By Product, 2019-2030, Million USD

FIGURE 148. Spain Vaginal Slings Market Value, By Product, 2019-2030, Million USD

FIGURE 149. Spain Urinary Incontinence Devices  Market Value, By Incontinence Type, 2019-2030, Million USD

FIGURE 150. Spain Urinary Incontinence Devices  Market Value, By Category, 2019-2030, Million USD

FIGURE 151. Spain Urinary Incontinence Devices  Market Value, By End User, 2019-2030, Million USD

FIGURE 152. Rest of Europe Urinary Incontinence Devices  Market Value, By Product, 2019-2030, Million USD

FIGURE 153. Rest of Europe Urinary Catheters Market Value, By Product, 2019-2030, Million USD

FIGURE 154. Rest of Europe Vaginal Slings Market Value, By Product, 2019-2030, Million USD

FIGURE 155. Rest of Europe Urinary Incontinence Devices  Market Value, By Incontinence Type, 2019-2030, Million USD

FIGURE 156. Rest of Europe Urinary Incontinence Devices  Market Value, By Category, 2019-2030, Million USD

FIGURE 157. Rest of Europe Urinary Incontinence Devices  Market Value, By End User, 2019-2030, Million USD

FIGURE 158. Asia-Pacific Urinary Incontinence Devices  Market Value, By Product, 2019-2030, Million USD

FIGURE 159. Asia-Pacific  Urinary Catheters Market Value, By Product, 2019-2030, Million USD

FIGURE 160. Asia-Pacific  Vaginal Slings Market Value, By Product, 2019-2030, Million USD

FIGURE 161. Asia-Pacific Urinary Incontinence Devices  Market Value, By Incontinence Type, 2019-2030, Million USD

FIGURE 162. Asia-Pacific Urinary Incontinence Devices  Market Value, By Category, 2019-2030, Million USD

FIGURE 163. Asia-Pacific Urinary Incontinence Devices  Market Value, By End User, 2019-2030, Million USD

FIGURE 164. India Urinary Incontinence Devices  Market Value, By Product, 2019-2030, Million USD

FIGURE 165. India Urinary Catheters Market Value, By Product, 2019-2030, Million USD

FIGURE 166. India Vaginal Slings Market Value, By Product, 2019-2030, Million USD

FIGURE 167. India Urinary Incontinence Devices  Market Value, By Incontinence Type, 2019-2030, Million USD

FIGURE 168. India Urinary Incontinence Devices  Market Value, By Category, 2019-2030, Million USD

FIGURE 169. India Urinary Incontinence Devices  Market Value, By End User, 2019-2030, Million USD

FIGURE 170. China Urinary Incontinence Devices  Market Value, By Product, 2019-2030, Million USD

FIGURE 171. China Urinary Catheters Market Value, By Product, 2019-2030, Million USD

FIGURE 172. China Vaginal Slings Market Value, By Product, 2019-2030, Million USD

FIGURE 173. China Urinary Incontinence Devices  Market Value, By Incontinence Type, 2019-2030, Million USD

FIGURE 174. China Urinary Incontinence Devices  Market Value, By Category, 2019-2030, Million USD

FIGURE 175. China Urinary Incontinence Devices  Market Value, By End User, 2019-2030, Million USD

FIGURE 176. Japan Urinary Incontinence Devices  Market Value, By Product, 2019-2030, Million USD

FIGURE 177. Japan Urinary Catheters Market Value, By Product, 2019-2030, Million USD

FIGURE 178. Japan Vaginal Slings Market Value, By Product, 2019-2030, Million USD

FIGURE 179. Japan Urinary Incontinence Devices  Market Value, By Incontinence Type, 2019-2030, Million USD

FIGURE 180. Japan Urinary Incontinence Devices  Market Value, By Category, 2019-2030, Million USD

FIGURE 181. Japan Urinary Incontinence Devices  Market Value, By End User, 2019-2030, Million USD

FIGURE 182. Australia Urinary Incontinence Devices  Market Value, By Product, 2019-2030, Million USD

FIGURE 183. Australia Urinary Catheters Market Value, By Product, 2019-2030, Million USD

FIGURE 184. Australia Vaginal Slings Market Value, By Product, 2019-2030, Million USD

FIGURE 185. Australia Urinary Incontinence Devices  Market Value, By Incontinence Type, 2019-2030, Million USD

FIGURE 186. Australia Urinary Incontinence Devices  Market Value, By Category, 2019-2030, Million USD

FIGURE 187. Australia Urinary Incontinence Devices  Market Value, By End User, 2019-2030, Million USD

FIGURE 188. Rest of Asia-Pacific Urinary Incontinence Devices  Market Value, By Product, 2019-2030, Million USD

FIGURE 189. Rest of Asia-Pacific Urinary Catheters Market Value, By Product, 2019-2030, Million USD

FIGURE 190. Rest of Asia-Pacific Vaginal Slings Market Value, By Product, 2019-2030, Million USD

FIGURE 191. Rest of Asia-Pacific Urinary Incontinence Devices  Market Value, By Incontinence Type, 2019-2030, Million USD

FIGURE 192. Rest of Asia-Pacific Urinary Incontinence Devices  Market Value, By Category, 2019-2030, Million USD

FIGURE 193. Rest of Asia-Pacific Urinary Incontinence Devices  Market Value, By End User, 2019-2030, Million USD

FIGURE 194. Rest of World Urinary Incontinence Devices  Market Value, By Product, 2019-2030, Million USD

FIGURE 195. Rest of World  Urinary Catheters Market Value, By Product, 2019-2030, Million USD

FIGURE 196. Rest of World  Vaginal Slings Market Value, By Product, 2019-2030, Million USD

FIGURE 197. Rest of World Urinary Incontinence Devices  Market Value, By Incontinence Type, 2019-2030, Million USD

FIGURE 198. Rest of World Urinary Incontinence Devices  Market Value, By Category, 2019-2030, Million USD

FIGURE 199. Rest of World Urinary Incontinence Devices  Market Value, By End User, 2019-2030, Million USD

FIGURE 200. Brazil Urinary Incontinence Devices  Market Value, By Product, 2019-2030, Million USD

FIGURE 201. Brazil Urinary Catheters Market Value, By Product, 2019-2030, Million USD

FIGURE 202. Brazil Vaginal Slings Market Value, By Product, 2019-2030, Million USD

FIGURE 203. Brazil Urinary Incontinence Devices  Market Value, By Incontinence Type, 2019-2030, Million USD

FIGURE 204. Brazil Urinary Incontinence Devices  Market Value, By Category, 2019-2030, Million USD

FIGURE 205. Brazil Urinary Incontinence Devices  Market Value, By End User, 2019-2030, Million USD

FIGURE 206. Turkey Urinary Incontinence Devices  Market Value, By Product, 2019-2030, Million USD

FIGURE 207. Turkey Urinary Catheters Market Value, By Product, 2019-2030, Million USD

FIGURE 208. Turkey Vaginal Slings Market Value, By Product, 2019-2030, Million USD

FIGURE 209. Turkey Urinary Incontinence Devices  Market Value, By Incontinence Type, 2019-2030, Million USD

FIGURE 210. Turkey Urinary Incontinence Devices  Market Value, By Category, 2019-2030, Million USD

FIGURE 211. Turkey Urinary Incontinence Devices  Market Value, By End User, 2019-2030, Million USD

FIGURE 212. South Africa Urinary Incontinence Devices  Market Value, By Product, 2019-2030, Million USD

FIGURE 213. South Africa Urinary Catheters Market Value, By Product, 2019-2030, Million USD

FIGURE 214. South Africa Vaginal Slings Market Value, By Product, 2019-2030, Million USD

FIGURE 215. South Africa Urinary Incontinence Devices  Market Value, By Incontinence Type, 2019-2030, Million USD

FIGURE 216. South Africa Urinary Incontinence Devices  Market Value, By Category, 2019-2030, Million USD

FIGURE 217. South Africa Urinary Incontinence Devices  Market Value, By End User, 2019-2030, Million USD

FIGURE 218. Saudi Arabia Urinary Incontinence Devices  Market Value, By Product, 2019-2030, Million USD

FIGURE 219. Saudi Arabia Urinary Catheters Market Value, By Product, 2019-2030, Million USD

FIGURE 220. Saudi Arabia Vaginal Slings Market Value, By Product, 2019-2030, Million USD

FIGURE 221. Saudi Arabia Urinary Incontinence Devices  Market Value, By Incontinence Type, 2019-2030, Million USD

FIGURE 222. Saudi Arabia Urinary Incontinence Devices  Market Value, By Category, 2019-2030, Million USD

FIGURE 223. Saudi Arabia Urinary Incontinence Devices  Market Value, By End User, 2019-2030, Million USD

FIGURE 224. Remaining Countries Urinary Incontinence Devices  Market Value, By Product, 2019-2030, Million USD

FIGURE 225. Remaining Countries Urinary Catheters Market Value, By Product, 2019-2030, Million USD

FIGURE 226. Remaining Countries Vaginal Slings Market Value, By Product, 2019-2030, Million USD

FIGURE 227. Remaining Countries Urinary Incontinence Devices  Market Value, By Incontinence Type, 2019-2030, Million USD

FIGURE 228. Remaining Countries Urinary Incontinence Devices  Market Value, By Category, 2019-2030, Million USD

FIGURE 229. Remaining Countries Urinary Incontinence Devices  Market Value, By End User, 2019-2030, Million USD

FIGURE 230. Boston Scientific Corporation: NET SALES,2017-2019

FIGURE 231. Caldera Medical: NET SALES,2017-2019

FIGURE 232. Cogentix Medical Inc.: NET SALES,2017-2019

FIGURE 233. Coloplast A/S: NET SALES,2017-2019

FIGURE 234. ConvaTec Healthcare B S..r.l.: NET SALES,2017-2019

FIGURE 235. Cook Medical: NET SALES,2017-2019

FIGURE 236. C.R. Bard Inc.: NET SALES,2017-2019

FIGURE 237. Johnson & Johnson (Ethicon Inc.): NET SALES,2017-2019

FIGURE 238. Medtronic Plc. (Covidien Ltd.): NET SALES,2017-2019

FIGURE 239. ProSurg Inc.: NET SALES,2017-2019

KEY PLAYERS

  • Coloplast

  • C. R. Bard

  • Boston Scientific Corporation, Inc.

  • ConvaTec Group Plc

  • Ethicon, Inc.

  • Covidien plc (Medtronic)

  • Prosurg, Inc.

  • Caldera Medical Inc

  • Cook Medical

  • Cogentix Medical Inc.


Frequently Asked Questions
What will be the worth of global Urinary Incontinence Devices market by the end of 2030?

According to the report published by Next Move Strategy Consulting, the Urinary Incontinence Devices market business is expected to hit at $5.74 billion (USD) by 2030.

Which region is expected to hold the highest market share in the Urinary Incontinence Devices market?

North America is expected to hold the highest market share in the global market. The region is expected to witness remarkable growth as it houses the major key players in the market.

Which are the top companies in the Urinary Incontinence Devices industry?

Coloplast, C. R. Bard, Boston Scientific Corporation, Inc., ConvaTec Group Plc, Ethicon, Inc., Covidien plc (Medtronic), Prosurg, Inc., Caldera Medical Inc, Cook Medical, Cogentix Medical Inc.

What are the market segmentations and scope of the study?

The global Urinary Incontinence Devices market share analysis is based on product, category, incontinence type, end user, and geography.

How big is the Urinary Incontinence Devices market?

Currently (in 2019), the market value stands at USD 2.34 billion and it is anticipated to reach USD 5.74 billion by 2030.