How to Make Market Forecasts Easier to Share
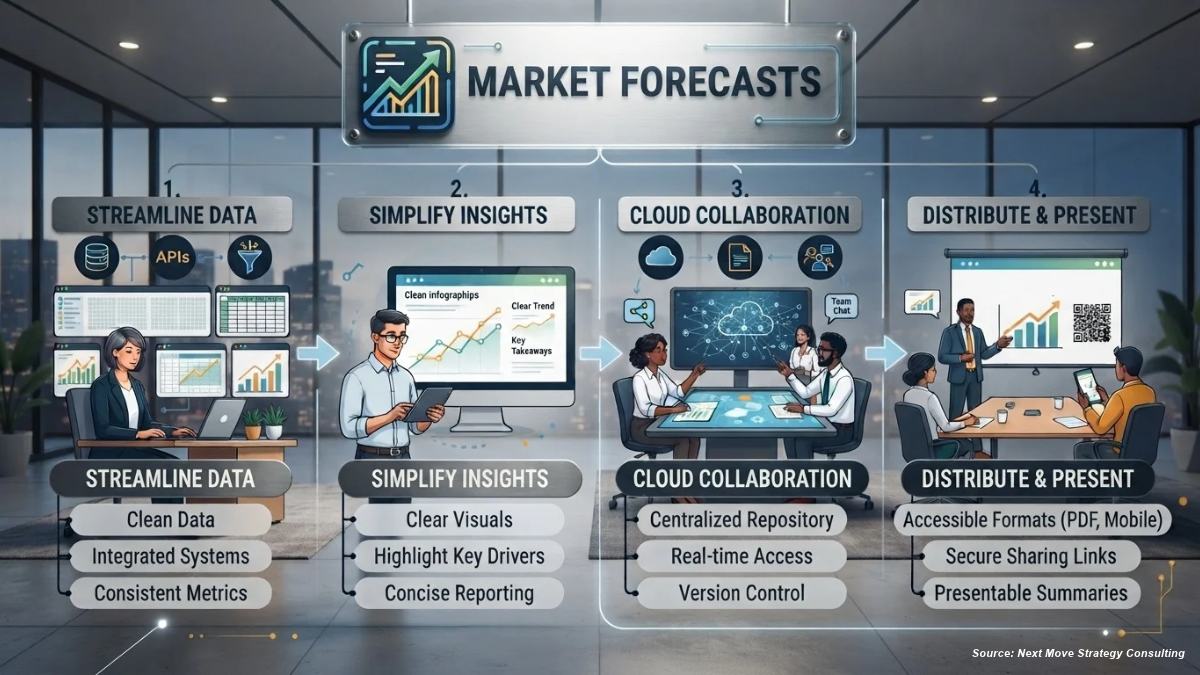
Market forecasts are easier to share when they clearly state the expected outcome, the assumptions behind it, and the relevance to a business decision. The audience should be able to interpret the main finding without reviewing the full research report.
For B2B organizations in particular, each shared forecast must preserve analytical accuracy while meeting the needs of different departments.
The following steps explain how to prepare forecasts so that they are easier to share.
Define the Business Purpose of Your Market Forecasts
First, identify the decision that the market forecast will inform and the people responsible for that decision. For instance, a procurement manager assessing supply requirements needs different information from an executive evaluating market entry.
Specify the relevant industry, geographic market, customer segment, and forecast period. Clear boundaries prevent readers from applying a finding to markets or time frames that the research does not cover.
Select the measures that directly support the decision. Revenue growth may be relevant to commercial planning, while unit demand and utilization rates may be more useful for production planning.
State the business question at the beginning of the shared document. A question such as “How could regional demand affect capacity requirements over the next two years?” gives the audience a clear basis for interpreting the analysis.
Retain secondary findings in the supporting report. The summary should prioritize decision-relevant information without removing qualifications that materially affect its meaning.
Create a Summary That Retains Essential Context
Prepare a short summary that can accompany the forecast across presentations, emails, and internal reports. It should remain understandable when separated from the original research document.
Include these essential elements:
-
The projected change and forecast period
-
The assumptions that materially affect the estimate
-
The business decision the analysis supports
Use specific language rather than broad assessments. For example, “Demand is projected to increase if planned infrastructure spending proceeds” communicates both the expected direction and a condition affecting the result.
Distinguish the forecast from its business implications. An increase in projected demand may justify reviewing production capacity, but it does not independently establish that additional investment is necessary.
Include the market scope and units beside the main finding. Readers should not have to consult another document to determine whether a figure represents revenue, shipment volume, or annual growth.
Select a Visual Format to Make Forecasts Easier to Interpret
Consider the visual format of the forecast. The right visual approach could make it easier to interpret.
You should match the visual format to the relationship being presented. Line charts can show changes over time, while bar charts can compare projected outcomes across industries, regions, or customer groups.
Also, including a short looping animation could be useful when sharing the forecast online. Canva’s free online GIF converter can turn videos into GIFs in just a few seconds.
It could show how projected demand changes across successive periods. Keep dates, units, and scenario labels visible throughout the sequence so readers can interpret each stage.
Provide a static chart and written summary alongside the animation so readers can review exact values and assumptions without relying on the animation.
Present Assumptions and Uncertainty Clearly
State the central estimate and the conditions on which it depends. Place material qualifications near the relevant figure rather than restricting them to methodology notes.
Forecasts can be presented with assumptions and uncertainty information. B2B research teams can apply the same principle by including relevant limitations in every shared version.
Distinguish Scenarios From Predicted Outcomes
Use consistent time frames, units, and market definitions when comparing base, upside, and downside scenarios. Explain the assumptions that change between scenarios so readers understand the reasons for the differences.
Do not assign probabilities unless the methodology supports them. A scenario based on delayed investment should be described as a conditional outcome, not automatically presented as a likely result.
Explain whether uncertainty reflects incomplete data, changing market conditions, or assumptions about future events. Specific explanations allow readers to assess which developments would require a forecast review.
Adapt the Material to Each Distribution Channel
Prepare channel-specific versions from one approved analysis. An executive presentation may require a single chart and decision summary, while a research note may need detailed assumptions and methodology, for instance.
Maintain the same figures, definitions, and qualifications across all versions. Shortening a document should not change the interpretation of its findings.
Both presentation and technical language should be considerations in communicating uncertainty. Review both when adapting technical research for colleagues outside the analysis team.
Check each version in its intended format. Chart labels must remain readable in presentation slides, exported documents, and email previews.
Ask a colleague unfamiliar with the analysis to summarize the main finding and its limitations. Revise any wording or visual element that leads to an interpretation the research does not support.
Document Sources and Control Revisions
Include the publication date, data cutoff, geographic coverage, measurement units, and methodology reference with the shared forecast. Readers need enough information to identify the evidence and assess whether it remains relevant.
Distinguish the publication date from the period covered by the underlying data. A recently published forecast may still depend on observations collected several months earlier.
Assign an owner and version identifier to each forecast package. Store approved materials in a designated location and clearly label superseded versions.
Record material revisions and explain their causes. Changes resulting from updated data should be distinguished from changes to assumptions, definitions, or modeling methods.
Set a review schedule and identify developments that would trigger an earlier reassessment. Relevant triggers may include major policy changes, revised customer demand estimates, or significant changes in input costs.
Keeping Shared Market Forecasts Clear and Consistent
Effective communication of market forecasts requires a defined business purpose, concise summaries, appropriate visuals, and explicit assumptions. Consistent formatting, source documentation, and revision controls help preserve accuracy as the analysis is shared.
Hopefully this article has been helpful. If that is the case, take a moment of your time to explore some of our other informative and insightful posts.
About the Author
 Sanyukta Deb
— Sanyukta Deb is Digital Marketing Team Lead at Next Move Strategy Consulting, where she has led content strategy and technical SEO for the firm's B2B market research publications for over 2 years. Her editorial process translates NextMSC's primary and secondary research — spanning technology, industrial, and consumer sectors — into commercial narratives, backed by search-intent, keyword, and competitive analysis. She brings 5 years of overall experience in digital marketing and content strategy.
About the Reviewer
 Debashree Dey
— Debashree Dey is Assistant Manager at Next Move Strategy Consulting, where she supports cross-vertical market content and communications across diverse industries for 6 years. Her professional background includes senior content writing, communications, and published manuscript authorship, with experience developing audience-focused business narratives and maintaining clear, consistent messaging. Her role supports research-led content development and editorial quality across NextMSC publications.
















Add Comment