What Is Inside a Market Research Report? Sections Explained
A Record USD 617 Million Quarter at The RealReal and a 6% Slide in Recycled Gold Show Why Every Section of a Market Report Has to Earn Its Numbers
On August 6, 2026, The RealReal, Inc. reported record quarterly gross merchandise value (GMV) of USD 617 million for the quarter ended June 30, 2026, a 22% increase on the second quarter of 2025 and its fourth consecutive quarter of GMV growth above 20%, according to the company's results release of that date. The company raised its full-year 2026 GMV guidance to a range of USD 2.535 billion to USD 2.565 billion and reported that direct revenue grew 26% and consignment revenue 15% year over year. The figure spans fashion, fine jewelry, watches and other luxury categories sold on the platform, so it is a signal about the category rather than a measure of it. That gap between a strong company result and a sized market is the reason decision-makers turn to a market research report: a structured document that converts scattered signals into a base-year value, a forecast, a segment view and a stated method. This article walks through each section of such a report, using the Pre-Owned Jewelry Market as the worked example.
According to Next Move Strategy Consulting's Pre-Owned Jewelry Market report, the global pre-owned jewelry market was valued at USD 34.2 billion in 2025 and is projected to reach USD 89.5 billion by 2035, growing at a CAGR of 10.3% from 2026 to 2035. NextMSC primary research and analysis estimates the market at USD 37.1 billion in 2026 and quantifies the absolute dollar opportunity between 2026 and 2035 at USD 52.4 billion.
For More Information: Download FREE Sample on Pre-Owned Jewelry Market Report
How a Market Research Report Is Organized
Market research reports follow a recognizable sequence, and each section answers a question a decision-maker would otherwise have to guess at. The table below maps the sections of NextMSC's Pre-Owned Jewelry Market report to the question each one answers.
Sections of a Market Research Report and the Question Each Answers
|
Report Section |
Question It Answers |
Pre-Owned Jewelry Market Example |
|
Market Size and Forecast |
How large is the category, and how fast is it growing? |
USD 34.2 billion (2025) to USD 89.5 billion (2035); 10.3% CAGR |
|
Segmentation |
Which parts of the market hold the value, and which are growing fastest? |
Rings: USD 10.94 billion in 2025; Body Jewelry: 15.4% CAGR |
|
Drivers and Restraints |
What moves the forecast, where and for how long? |
Authenticated-luxury preference: +3.4%; counterfeit risk: -1.5% |
|
Regional Outlook |
Where is the value earned? |
Asia-Pacific: approximately 38% share; Middle East & Africa: 14.3% CAGR |
|
Competitive Positioning |
Who competes, and on what basis? |
20 companies profiled; authentication trust as the differentiator |
|
Methodology |
How were the numbers produced? |
Top-down and bottom-up sizing; regression, ARIMA and Monte Carlo forecasting |
Read in order, the sections move from the widest question (how large is the category?) to the narrowest (how reliable is the number?). The sections below take each in turn, pairing NextMSC's published figures with dated external evidence from the past six months.
Section 1: Market Size and Forecast
The opening section fixes three numbers: a base-year value, a forecast-year value and the compound annual growth rate between them. For pre-owned jewelry, NextMSC primary research and analysis sets the base year at 2025 (USD 34.2 billion), estimates 2026 at USD 37.1 billion and sets the forecast year at 2035 (USD 89.5 billion). A reader's first task is to confirm scope. NextMSC defines the category as rings, necklaces and pendants, earrings, bracelets and bangles, brooches, jewelry sets, religious jewelry and body jewelry in gold, platinum, silver, palladium and mixed precious metals, transacted through consignment, inventory-led resale, auction, private sale, marketplace and pawn retail models across online, offline and omnichannel sales channels.
Scope is also what separates a market figure from a company figure. The RealReal's full-year GMV guidance of USD 2.535 billion to USD 2.565 billion covers every luxury category the platform sells, so it cannot be set against a pre-owned jewelry market value without first isolating the jewelry share, which the company's results release does not publish.
Section 2: Segmentation
Segmentation breaks the headline value into parts that can be tracked and compared. NextMSC's report cuts the market eight ways: by jewelry type, primary material, gemstone composition, transaction model, item age, price band, buyer type and sales channel. The jewelry-type view below shows the 2025 contribution of each segment and where growth is concentrated.
Pre-Owned Jewelry Market by Jewelry Type, 2025 and 2035
Rings were the largest jewelry type in 2025 at USD 10.94 billion, approximately 32% of the market, while Body Jewelry, from a USD 1.03 billion base, is the fastest-growing at a 15.4% CAGR. On the other axes, NextMSC reports that gold held approximately 54% of the market by primary material (USD 18.47 billion), diamond jewelry approximately 46% by gemstone composition (USD 15.73 billion), consignment approximately 34% by transaction model (USD 11.63 billion) and offline channels approximately 48% by sales channel (USD 16.42 billion). The fastest-growing segments differ from the largest: the marketplace model is forecast at a 14.7% CAGR, omnichannel sales at 13.9%, the ultra luxury price band at 13.5% and colored gemstone jewelry at 12.8%.
A company-level illustration of why share and growth rate must be read separately comes from The RealReal's August 6, 2026 release, in which direct revenue grew 26% against 15% for consignment revenue, even though consignment is the older and larger model in NextMSC's transaction-model view.
Section 3: Drivers and Restraints
The drivers-and-restraints section converts qualitative arguments into a stated contribution to the CAGR, with a geography and a time window attached. NextMSC's matrix for this market is shown below.
Pre-Owned Jewelry Market: Drivers and Restraints Matrix
|
Factor |
Type |
Impact on CAGR |
Geography |
Timeline |
|
Rising consumer preference for authenticated, sustainable luxury purchases |
Driver |
+3.4% |
Global |
2026-2035 |
|
Category-specialist platform expansion in jewelry, watches and handbags |
Driver |
+2.6% |
North America, Europe |
2026-2032 |
|
High value retention of fine jewelry relative to other luxury categories |
Driver |
+2.1% |
Global |
2026-2035 |
|
Gold price appreciation increasing seller motivation to liquidate holdings |
Driver |
+1.8% |
Asia-Pacific, Middle East & Africa |
2026-2032 |
|
Growing brand-endorsed consignment partnerships |
Driver |
+1.2% |
North America, Europe |
2026-2030 |
|
Expanding collector demand for vintage and antique pieces |
Driver |
+1.1% |
Global |
2026-2035 |
|
Authentication and counterfeit risk for high-value transactions |
Restraint |
-1.5% |
Global |
2026-2032 |
|
Fragmented regulatory requirements across cross-border resale transactions |
Restraint |
-0.9% |
Global |
2026-2032 |
|
Price volatility in underlying precious metal and gemstone markets |
Restraint |
-0.6% |
Global |
2026-2030 |
Two features of the matrix deserve a reader's attention. Each factor carries a geography and a time window, so the gold-price driver (+1.8 percentage points) applies to Asia-Pacific and the Middle East & Africa through 2032 rather than to every region through 2035. And the largest restraint, authentication and counterfeit risk at -1.5 percentage points, sits directly against the largest driver, consumer preference for authenticated purchases at +3.4 percentage points.
External data shows why those windows matter. The World Gold Council's Gold Demand Trends report for the second quarter of 2026, published in July 2026, recorded global gold jewellery consumption of 278.2 tonnes, down 17% year over year and the lowest quarterly volume since the pandemic, as high prices and inflationary pressure constrained affordability. Spending on gold jewellery nevertheless rose 14% to USD 40 billion. The LBMA gold price averaged USD 4,506.29 per ounce in the quarter, 37% above the second quarter of 2025.
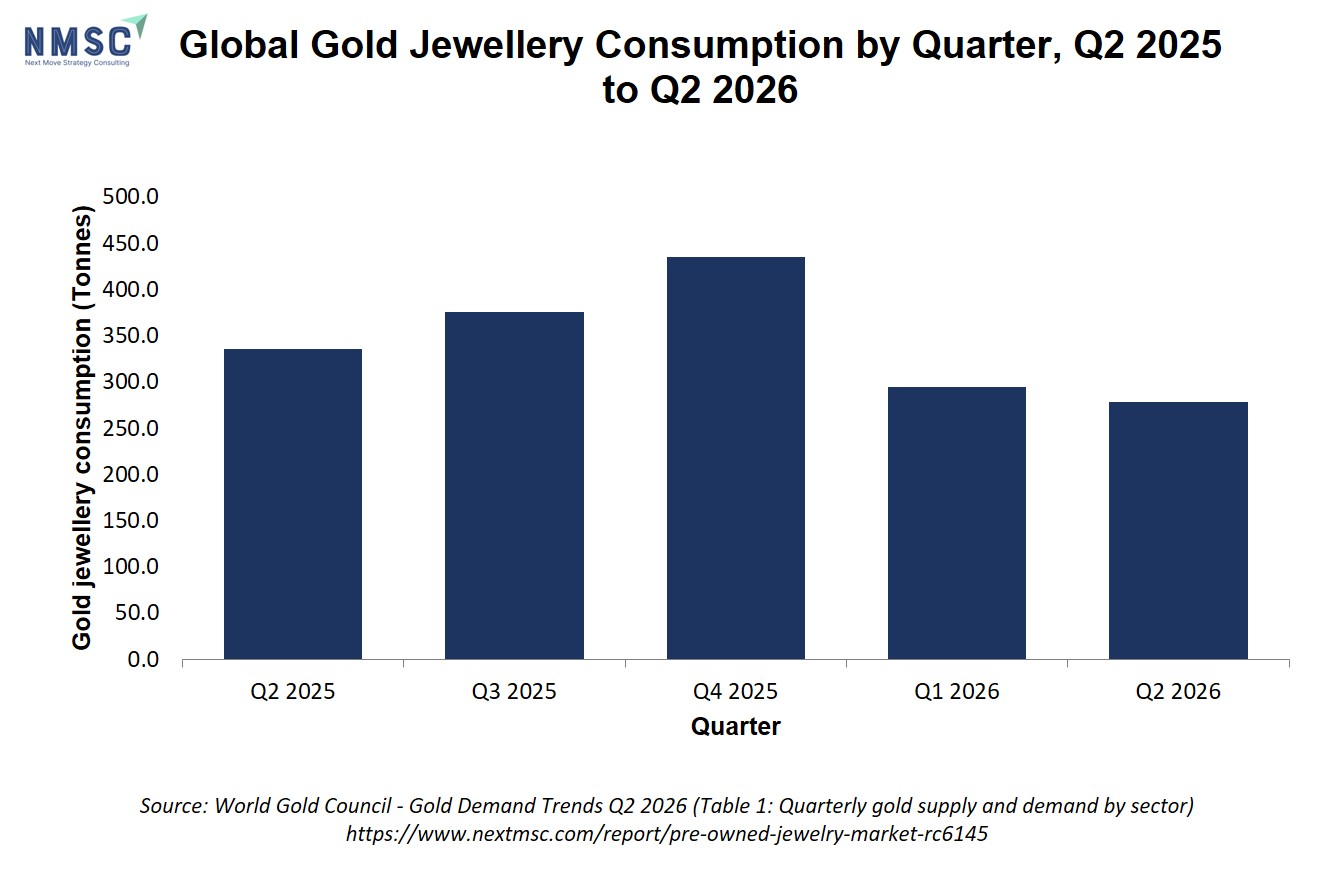
Supply behaved differently from what a simple price argument would predict. The World Gold Council reported that recycled gold fell 6% year over year to 326.1 tonnes in the quarter, as a lower quarter-on-quarter price discouraged the selling of old gold jewellery, and it sees only modest growth potential from recycling. Signet Jewelers' Form 10-Q for the 13 weeks ended August 1, 2026 shows the other side of the same flow: the retailer cited accelerated melt, particularly of trade-in and clearance product, among the reasons for its year-to-date gross margin decline. A driver's direction is rarely in doubt, but its timing is, and the geography and timeline columns of the matrix are where that uncertainty should be read.
Section 4: Regional Outlook
The regional section shows where the headline number is earned. NextMSC's report places Asia-Pacific first with approximately 38% of 2025 revenue (USD 13.00 billion), led by China at approximately USD 5,458 million. The Middle East & Africa is the fastest-growing region at a 14.3% CAGR, and Saudi Arabia is the fastest-growing country at approximately 16.0%.
Pre-Owned Jewelry Market by Region, 2025
|
Region |
2025 Size (USD Billion) |
CAGR (2026-2035) |
Primary Driver |
|
North America |
9.23 |
9.8% |
Category-specialist platform expansion and brand-endorsed consignment partnerships |
|
Europe |
7.18 |
9.1% |
Established auction house infrastructure and vintage jewelry collector demand |
|
Asia-Pacific |
13.00 |
9.6% |
Deep-rooted gold jewelry culture and expanding regional resale infrastructure |
|
Middle East & Africa |
2.74 |
14.3% |
Gulf gold trading hubs and rising precious metal resale activity |
|
Latin America |
2.05 |
13.9% |
Expanding middle-class jewelry ownership and growing formal resale channel adoption |
A regional table is also where methodology shows up in practice. NextMSC ties North America to consignment and marketplace platforms and Europe to auction houses, while Asia-Pacific and the Middle East & Africa are tied to gold jewelry culture and Gulf trading hubs. The same category is therefore being sized from different supply mechanisms in different regions, which is why a single global assumption rarely survives contact with the regional data.
Section 5: Competitive Positioning
The competitive section names the participants and explains how they win. NextMSC profiles 20 companies in this market, including eBay Inc., The RealReal, Inc., Sotheby's, Christie's International PLC, myGemma, Inc., Signet Jewelers Limited and Chow Tai Fook Jewellery Group Limited, and concludes from its research that differentiation increasingly rests on authentication trust and pricing accuracy. A report's company claims are only as reliable as their sources, so each development should trace to a named filing or announcement.
The RealReal's August 6, 2026 results illustrate the point. Beyond record GMV, the company reported a gross margin of 74.4% and an adjusted EBITDA margin of 7.0%, up 290 basis points year over year, and guided third quarter GMV to USD 610 million to USD 620 million.
“an all-time high quarterly GMV of $617 million, up 22% year-over-year”
Rati Levesque, Chief Executive Officer, The RealReal, Inc., The RealReal Announces Second Quarter 2026 Results (press release), August 6, 2026.
Resale value data from myGemma supports the authentication thesis from the buyer side. The platform's Luxury Resale Index 2026, published on August 3, 2026 by luxury resale expert Annie Morgan and based on more than 500,000 authenticated items submitted between January 1 and July 31, 2026, reports that Van Cleef & Arpels Alhambra pieces typically retain 90% or more of retail value and Cartier LOVE and Juste un Clou pieces 80% or more, and that Tiffany & Co. was the most-searched luxury brand of the period. The index also notes that high search volume for a specific model often coincides with more counterfeit activity in that category. Because the figures come from myGemma's own platform, they are best read as one company's authenticated sample rather than a market-wide benchmark.
Signet Jewelers reported on September 9, 2026 that same-store sales rose 2.2% in the quarter ended August 1, 2026, raised its fiscal 2027 guidance and recorded positive comparable sales across its fine jewelry brands. NextMSC's report identifies jewelry retailer entry into trade-in and buyback programs as part of the market's partnership and expansion activity, which is why a new-jewelry retailer's results belong in a pre-owned market analysis.
Section 6: Methodology and How to Test a Report
The methodology section is the one most readers skip and the one that determines whether the other five can be trusted. NextMSC states that its research combines qualitative methods (in-depth interviews, focus groups and observational studies) with quantitative methods (surveys, experiments and statistical modeling), sizes markets with both top-down and bottom-up approaches, and forecasts with techniques including multilinear regression, exponential smoothing, moving average, ARIMA and Monte Carlo simulation, alongside analysis of regulatory, economic and market events.
Five checks help a reader test any report against its methodology section:
-
Base year and forecast year are stated, and forecasts are kept separate from reported actuals.
-
Scope is defined in terms of products, transaction models and sales channels.
-
Each driver and restraint carries a geography and a time window.
-
Segment and regional figures reconcile to the headline market value.
-
External company facts are named, dated and traceable to a filing or announcement.
The external evidence in this article, from The RealReal, the World Gold Council, myGemma and Signet Jewelers, meets the last test and is the kind of dated, named data against which a report's assumptions should be reconciled.
NMSC Strategic Perspective: Authentication Is Both the Engine and the Constraint
NextMSC primary research and analysis identifies authentication as the variable that links the sections of this report. The driver matrix assigns the largest positive contribution (+3.4 percentage points) to consumer preference for authenticated, sustainable luxury and the largest negative contribution (-1.5 percentage points) to authentication and counterfeit risk. Operators that resolve the second convert it into the first. NextMSC's analysis finds that category-specialist platforms are capturing authentication trust and pricing accuracy faster than general secondhand marketplaces, a shift that is reshaping how sellers choose where to list through 2035.
The August 2026 evidence is consistent with that reading. The RealReal's record quarter was reported by a marketplace for authenticated resale luxury goods, and myGemma's index documents both strong value retention for signed pieces and the counterfeit exposure that accompanies high-search models. For platform operators, NextMSC's recommendation is to build proprietary authentication and pricing data, as the report's competitive section describes, because that data turns a listing into a trusted transaction.
NextMSC's analysis also separates two supply stories that are easy to conflate. In Asia-Pacific and the Middle East & Africa, resale supply is tied to gold-price-driven liquidation, a driver the matrix limits to 2026-2032. In North America and Europe it is tied to consignment partnerships and auction infrastructure. The World Gold Council's 6% fall in recycled gold and Signet's trade-in melt disclosure show why investors should model those streams separately instead of applying one global assumption.
For investors, NextMSC's report points to authenticated digital marketplaces, colored gemstone resale and collector-grade vintage platforms as the three growth pathways behind the USD 52.4 billion opportunity between 2026 and 2035.
Bottom Line
A market research report is a chain of claims, and each section tests a different link. Section one sets the scale: NextMSC primary research and analysis sizes the pre-owned jewelry market at USD 34.2 billion in 2025 and USD 89.5 billion by 2035 at a 10.3% CAGR. Segmentation shows Rings as the largest jewelry type and Body Jewelry, marketplaces and omnichannel sales growing fastest. The drivers matrix attaches a contribution, a geography and a time window to each force, which matters because the World Gold Council recorded a 17% fall in gold jewellery volume and a 6% fall in recycled gold in the second quarter of 2026. The regional and competitive sections locate growth in Asia-Pacific scale, Middle East & Africa pace and authentication-led platforms, as The RealReal's record USD 617 million quarter and myGemma's resale-retention data indicate. The methodology section decides whether any of it deserves trust. Readers should check scope, dates, geographies and named sources before relying on a figure.
About Next Move Strategy Consulting
Next Move Strategy Consulting is a premier market research and management consulting firm that has been committed to provide strategically analysed well documented latest research reports to its clients. The research industry is flooded with many firms to choose from, what makes NMSC different from the rest is its top-quality research and the obsession of turning data into knowledge by dissecting every bit of it and providing fact-based research recommendation that is supported by information collected from over 500 million websites, paid databases, industry journals and one on one consultations with industry experts across a diverse range of industry sectors. The high-quality customized research reports with actionable insights and excellent end-to-end customer service help our clients to take critical business decisions that enables them to move beyond time and have competitive edge in the industry.
We have been servicing over 1000 customers globally that includes 90% of the Fortune 500 companies over a decade. Our analysts are constantly tracking various high growth markets and identifying hidden opportunities in each sector or the industry. We provide one of the industry’s best quality syndicate as well as custom research reports across 10 different industry verticals. We are committed to deliver high quality research solutions in accordance to your business needs. Our industry standard delivery solutions that ranges from the pre consultation to after-sales services, provide an excellent client experience and ensure right strategic decision making for businesses.
For more information, please contact:
Next Move Strategy Consulting
5th Floor 867 Boylston St, STE 500,
Boston, MA 02116, U.S.
E-Mail: [email protected]
Direct: +1-217-650-7991
Website: www.nextmsc.com
About the Author
 Sanyukta Deb
— Sanyukta Deb is Digital Marketing Team Lead at Next Move Strategy Consulting, where she has led content strategy and technical SEO for the firm's B2B market research publications for over 2 years. Her editorial process translates NextMSC's primary and secondary research — spanning technology, industrial, and consumer sectors — into commercial narratives, backed by search-intent, keyword, and competitive analysis. She brings 5 years of overall experience in digital marketing and content strategy.
About the Reviewer
 Debashree Dey
— Debashree Dey is Assistant Manager at Next Move Strategy Consulting, where she supports cross-vertical market content and communications across diverse industries for 6 years. Her professional background includes senior content writing, communications, and published manuscript authorship, with experience developing audience-focused business narratives and maintaining clear, consistent messaging. Her role supports research-led content development and editorial quality across NextMSC publications.















Add Comment