Australia Smart Display Market by Technology (LCD, LED, E-Paper Display, OLED and Others), by Product Type (Standalone Smart Displays, Integrated Smart Displays, Interactive Touchscreen Displays, Transparent Smart Displays, and Other Display Types), by Display Size (Below 24 Inch, 24 Inch to 55 Inch, and Above 55 Inch), by Resolution (UHD, FHD, HD, and Other Resolution) and by Application (Smart Home, Automotive (Smart Mirror), and others)– Opportunity Analysis and Industry Forecast, 2023–2030
Industry: Semiconductor & Electronics | Lastest Edition: January 9, 2026 | No of Pages: 251 | No. of Tables: 206 | No. of Figures: 131 | Format: PDF | Report Code : SE1025
Market Definition
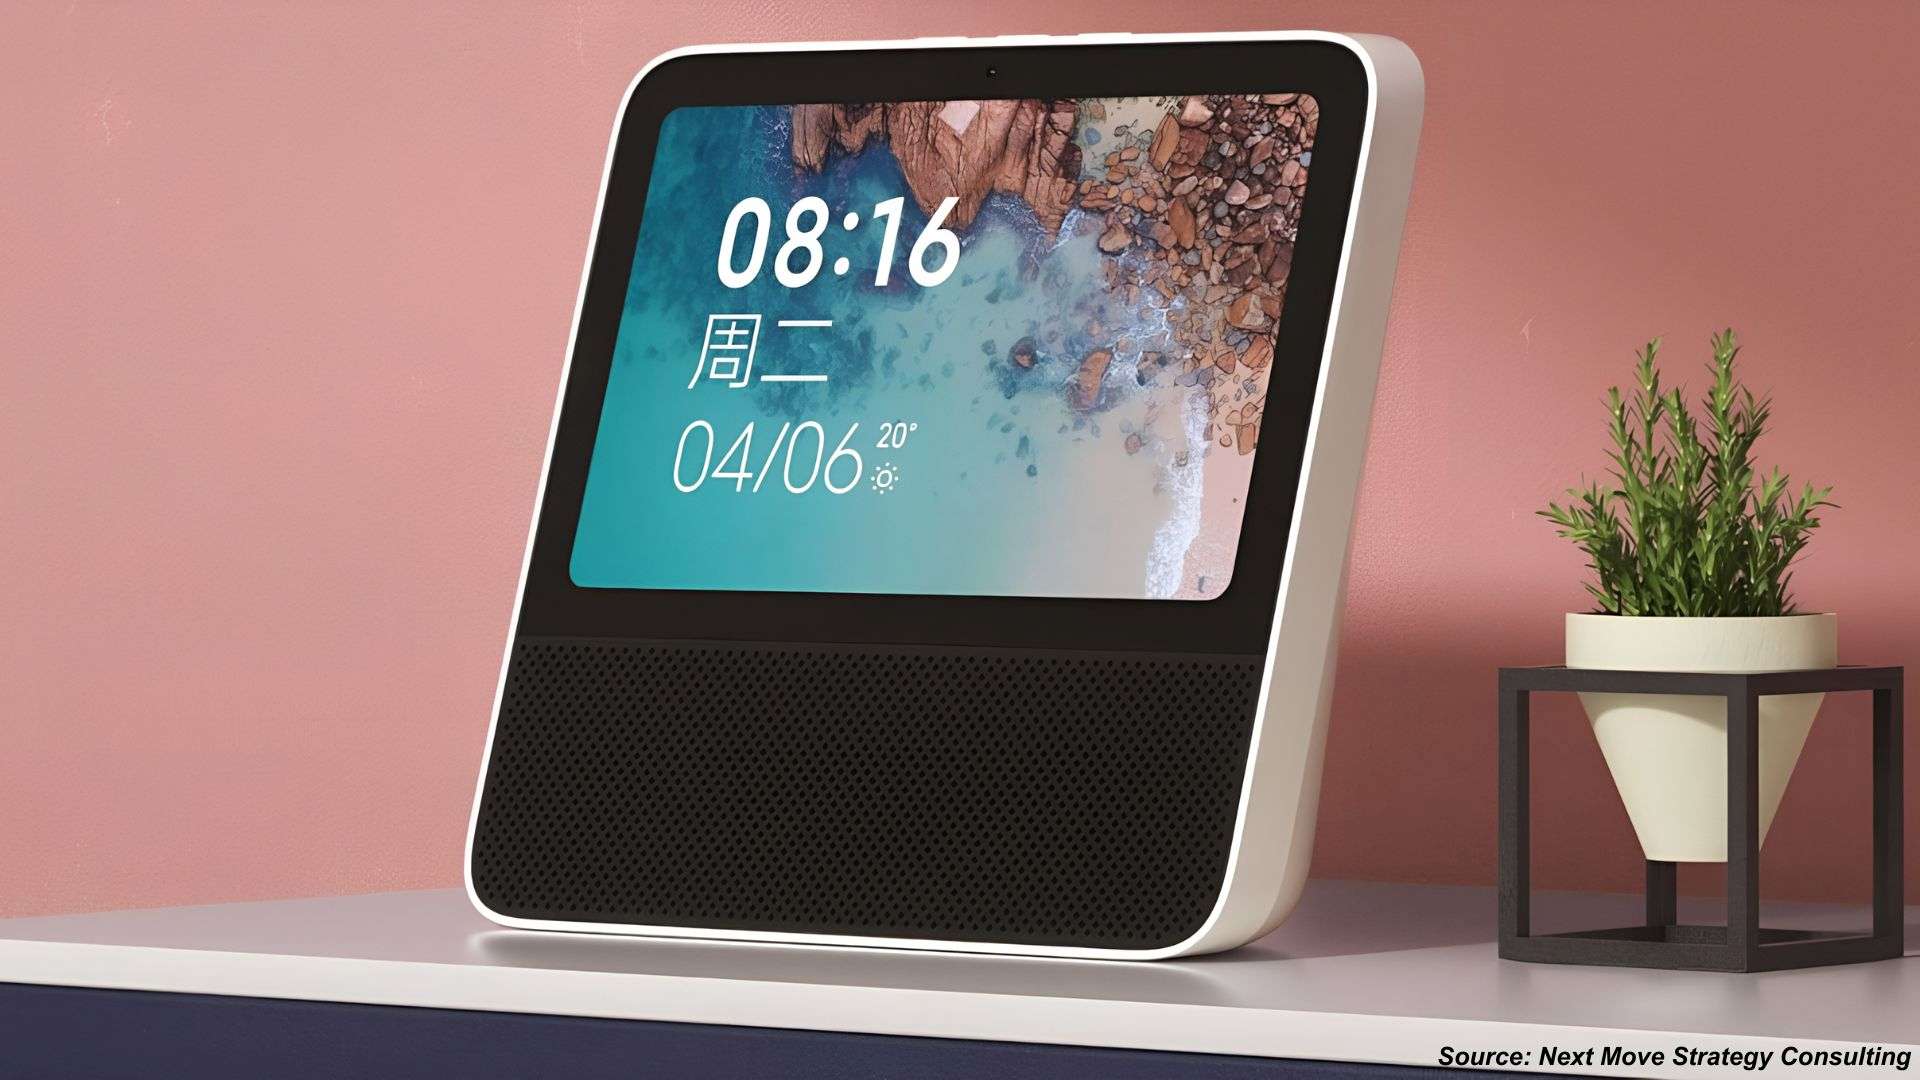
Australia Smart Display Market was valued at USD 360.55 million in 2022, and is predicted to reach USD 1390.4 million by 2030, with a CAGR of 16.8% from 2023 to 2030. A smart display is a sophisticated device featuring a touchscreen or interactive visual interface, coupled with voice recognition and artificial intelligence capabilities.
Functioning as versatile information hubs, these displays can execute diverse tasks, including presenting information and managing smart home devices. They offer visual responses to voice commands, facilitating video calls and serving as interactive tools for scheduling, weather updates, and entertainment purposes.
Smart displays are meticulously crafted to elevate convenience, accessibility, and user engagement across various settings, such as homes, offices, and public spaces. Their applications span residential homes, offices, healthcare facilities, retail, education, and beyond.
Increasing Adoption Of Smart Home Solutions in Australia
The widespread adoption of smart home technologies across Australia is a key driver in the growth of the smart display market. With a strong focus on automation, energy efficiency, and convenience, Australian households are integrating smart displays as control hubs for connected devices including lights, security systems, and climate control. The proliferation of NBN (National Broadband Network) and availability of smart appliances have strengthened this trend, particularly in urban areas. The preference for hands-free, voice-activated systems is also encouraging smart display usage among time-constrained families and tech-savvy individuals.
Growing Integration Of AI and Voice Assistants In Display Devices
The use of AI-driven voice assistants like Google Assistant and Amazon Alexa in smart displays is revolutionizing user interaction in Australia. These technologies enable natural language processing and personalized services that make displays more intuitive and efficient. Smart displays are increasingly used to automate daily routines, provide personalized recommendations, and connect with home systems, especially among younger, tech-adopting demographics. Their growing relevance in areas such as accessibility and aged care also enhances their societal value across the Australian consumer base.
Rising Advancements in the Healthcare and Telemedicine Industry
The rising adoption of smart displays in healthcare and telemedicine drives the smart display market's growth. These devices are proving to be transformative tools in the healthcare industry, as they facilitate remote patient monitoring, telehealth consultations, and efficient communication among medical professionals. Smart displays enable high-quality video conferencing and provide a visual platform for healthcare providers to assess patients, share medical records, and discuss treatment plans in real-time. This adoption is critical in expanding access to healthcare services, especially in remote or underserved areas, and during public health crises like the COVID-19 pandemic. Moreover, integrating AI and medical software into smart displays allows for precise diagnostics and patient data management. As healthcare providers and institutions increasingly recognize the value of smart displays in delivering more effective and accessible healthcare, their use is set to drive the growth of the smart display market in the healthcare and telemedicine sectors. For instance, in March 2023, Samsung Electronics America launched the industry's first 4K QLED Smart Healthcare TV. In partnership with ShareSafe, this innovative product transforms in-room displays into versatile communication hubs personalized for hospital patients and senior care residents, leading to improved collaboration, patient engagement, and workflow efficiency.
Data Privacy and Security Concerns Hinder User Trust
Data privacy and cybersecurity concerns continue to pose significant restraints on smart display adoption in Australia. Consumers are cautious about potential breaches, unauthorized surveillance, and misuse of personal information collected by always-on devices. The Office of the Australian Information Commissioner has flagged growing public concern over how companies manage voice data and facial recognition. This lack of confidence in digital safeguards slows adoption rates, particularly in privacy-sensitive households and sectors like healthcare or education.
Adoption of Next-gen Display Technologies in Public and Commercial Sectors
The Australian market is witnessing growing interest in advanced display formats such as laser-based and microLED smart displays. These technologies offer superior energy efficiency, extended durability, and high-definition visuals—ideal for public signage, educational institutions, and corporate communications. As Australia pushes forward with sustainable infrastructure and smart city initiatives, these displays are well-positioned for integration into public transport hubs, government facilities, and enterprise environments. This shift opens up robust investment potential for both domestic and global display tech providers.
Competitive Landscape
The Australia smart display industry includes several market players such as Amazon, BenQ Corporation, CiscSystems, Inc., Continental, Dell Technologies Inc., DensCorporation, Google LLC, Huawei Technologies Co., Ltd., LenovGroup Ltd., LG Electronics Inc., NEC Corporation (NEC Display Solutions), Panasonic Corporation, Robert Bosch Gmbh, Samsung Electronics Co., Ltd., Sharp Corporation, Signify NV (Philips), SMART Technologies, Sony Corporation, ViewSonic Corporation, Xiaomi Corporation and others.
Key Benefits
-
The Australia smart display market report provides a quantitative analysis of the current market and estimations through 2023-2030 that assists in identifying the prevailing market opportunities to capitalize on.
-
The study comprises a deep dive analysis of the market trend including the current and future trends for depicting the prevalent investment pockets in the market.
-
The information related to key drivers, restraints, and opportunities and their impact on the market is provided in the report.
-
The competitive analysis of the market players along with their market share in the Australia smart display market.
-
The SWOT analysis and Porter’s Five Forces model are elaborated in the study.
-
Value chain analysis in the market study provides a clear picture of the stakeholders’ roles.
Australia Smart Display Market Key Segments
By Technology
-
LCD
-
LED
-
E-Paper Displays
-
OLED
-
Other Display Technologies
By Product Type
-
Standalone Smart Displays
-
Integrated Smart Displays
-
Interactive Touchscreen Displays
-
Transparent Smart Displays
-
Other Display Types
By Display Size
-
Below 24 inch
-
24 inch to 55 inch
-
Above 55 inch
By Resolution
-
UHD (3840 × 2160 or higher)
-
FHD (1920 × 1080)
-
HD (1280 × 720 or 1366 × 768)
-
Other Resolutions (2K, WXGA, Custom)
By Application
-
Smart Home
-
Voice-Controlled / Assistant Smart Display
-
Smart Appliance Display (fridge, oven, HVAC, etc.)
-
Smart Display Mirror – Home
-
-
Automotive (Smart Mirror)
-
OEM Rearview Display Mirror
-
Aftermarket Rearview Display Mirror
-
Side-View Display Mirror
-
-
Digital Signage
-
Retail & Hospitality Signage
-
Transportation Hubs & Public Places Signage
-
Sports & Entertainment Venue Signage
-
Other Signage Applications
-
-
Healthcare
-
Patient Monitoring & Telehealth Displays
-
Diagnostic / Imaging Workflow Displays
-
Digital Whiteboards for Medical Staff
-
-
Automotive (Other In-Vehicle Displays)
-
In-Dashboard Infotainment Displays
-
Digital Instrument Clusters
-
-
Other Consumer/Industrial Applications
Key Players
-
Amazon
-
BenQ Corporation
-
CiscSystems, Inc.
-
Continental
-
Dell Technologies Inc.
-
DensCorporation
-
Google LLC
-
Huawei Technologies Co., Ltd.
-
LenovGroup Ltd.
-
LG Electronics Inc.
-
NEC Corporation (NEC Display Solutions)
-
Panasonic Corporation
-
Robert Bosch Gmbh
-
Samsung Electronics Co., Ltd.
-
Sharp Corporation
-
Signify NV (Philips)
-
SMART Technologies
-
Sony Corporation
-
ViewSonic Corporation
-
Xiaomi Corporation
REPORT SCOPE AND SEGMENTATION:
|
Parameters |
Details |
|
Market Size in 2022 |
USD 360.55 Million |
|
Revenue Forecast in 2030 |
USD 1390.4 Million |
|
Growth Rate |
CAGR of 16.8% from 2023 to 2030 |
|
Analysis Period |
2022–2030 |
|
Base Year Considered |
2022 |
|
Forecast Period |
2023–2030 |
|
Market Size Estimation |
Million (USD) |
|
Growth Factors |
Increasing defense Initiatives. Growing smart technology initiatives. |
|
Companies Profiled |
15 |
|
Market Share |
Available for 10 companies |
|
Customization Scope |
Free customization (equivalent up to 80 working hours of analysts) after purchase. Addition or alteration to country, regional, and segment scope. |
|
Pricing and Purchase Options |
Avail customized purchase options to meet your exact research needs. |
")


About the Author
 Sikha Haritwal is an assistant manager with strong expertise in market research, data analysis, and cross-functional coordination. She plays a key role in leading complex research initiatives, strengthening analytical rigor, and enabling data-driven decision-making across teams. Known for her leadership mindset and structured problem-solving approach, she supports process improvement, enhances operational efficiency, and contributes to building scalable frameworks that drive long-term strategic outcomes and organizational effectiveness.
About the Reviewer
 Supradip Baul is an accomplished business consultant and strategist with over a decade of rich experience in market intelligence, strategy, technology, and business transformation. His work has included rigorous qualitative and quantitative analysis across multiple industries, helping clients shape investment decisions and long-term roadmaps. Earlier in his career, he was associated with Gartner, where he contributed to industry-leading reports and market share analyses. He has worked with leading global companies and holds an MBA with a dual specialization in Marketing and Finance.
At Next Move Strategy Consulting, we understand that insightful market research is the cornerstone of successful business decisions. That's why we employ a robust and multifaceted approach, combining various methodologies to deliver the most accurate and actionable data for our clients.

Research Landscape
We navigate the world of research with two primary approaches:
Qualitative Approach
Our qualitative research methodologies involve immersive techniques such as in-depth interviews, focus groups, and observational studies. By engaging directly with individuals and stakeholders, we uncover valuable insights that quantitative data alone may overlook.

Quantitative Research
In tandem with qualitative methodologies, NMSC leverages the power of Quantitative Research to provide a robust foundation of numerical insights. Through systematic data collection and analysis, we quantify patterns, preferences, and market trends, offering a comprehensive view of the business landscape.
Our quantitative research approach employs diverse tools, including surveys, experiments, and statistical modelling. These methodologies enable us to gather data from a large and representative sample, ensuring the statistical significance of our findings. By employing structured questionnaires and standardized data collection methods, we guarantee the reliability and validity of the information we present to our clients.
Quantitative research is particularly effective in measuring the prevalence of trends, assessing market size, and gauging the impact of various factors on consumer behavior. The numerical precision attained through this approach equips our clients with actionable insights, facilitating data-driven decision-making and strategy formulation.


Our Specialized Toolbox for Industry-Specific Market Research
We deploy a specialized arsenal of techniques tailored to meet your unique requirements. Here's a glimpse into our comprehensive toolbox:

Information Procurement
The stage entails acquiring market data or relevant information through various sources and methodologies.


Market Research Approach
We utilize both top-down and bottom-up approaches in market research analysis to achieve a comprehensive understanding of the market dynamics, leveraging the broad perspective of industry trends and macroeconomic factors alongside detailed insights from specific segments and individual companies.

Porters Five Forces Analysis
We conduct Porter's Five Forces analysis to evaluate the competitive landscape of an industry, providing us with insights into factors that affect profitability and strategic positioning.

SWOT Analysis

Forecasting
We utilize a forecasting model to predict future consumption by considering parameters like population, economics, regulations, market competition, drivers, constraints, technology, and pricing. We also employ statistical techniques such as multilinear regression, exponential smoothing, moving average, ARIMA, and Monte Carlo simulations for accurate predictions. In econometric forecasting, we analyzed short-term and long-term event impacts, attributing values based on regulatory frameworks, economic factors, and market events.


 Speak to Our Analyst