Community Networks Market Size, Share, Trends and Growth Analysis, By Type (Wireless Community Networks, and Wired Community Networks), By Component (Hardware, Software, and Services), By End User (Residential, Educational Institutions, Public Safety & Government, and Commercial & Small Business), and Region — Global Industry Report and Forecast, 2026–2035
Industry: ICT & Media | Publishing Date: August 10, 2026 | Last Updated: August 10, 2026 | No of Pages: N/A | No. of Tables: N/A | No. of Figures: N/A | Format: PDF | Report Code: IC5649
What Is the Community Networks Market Size?
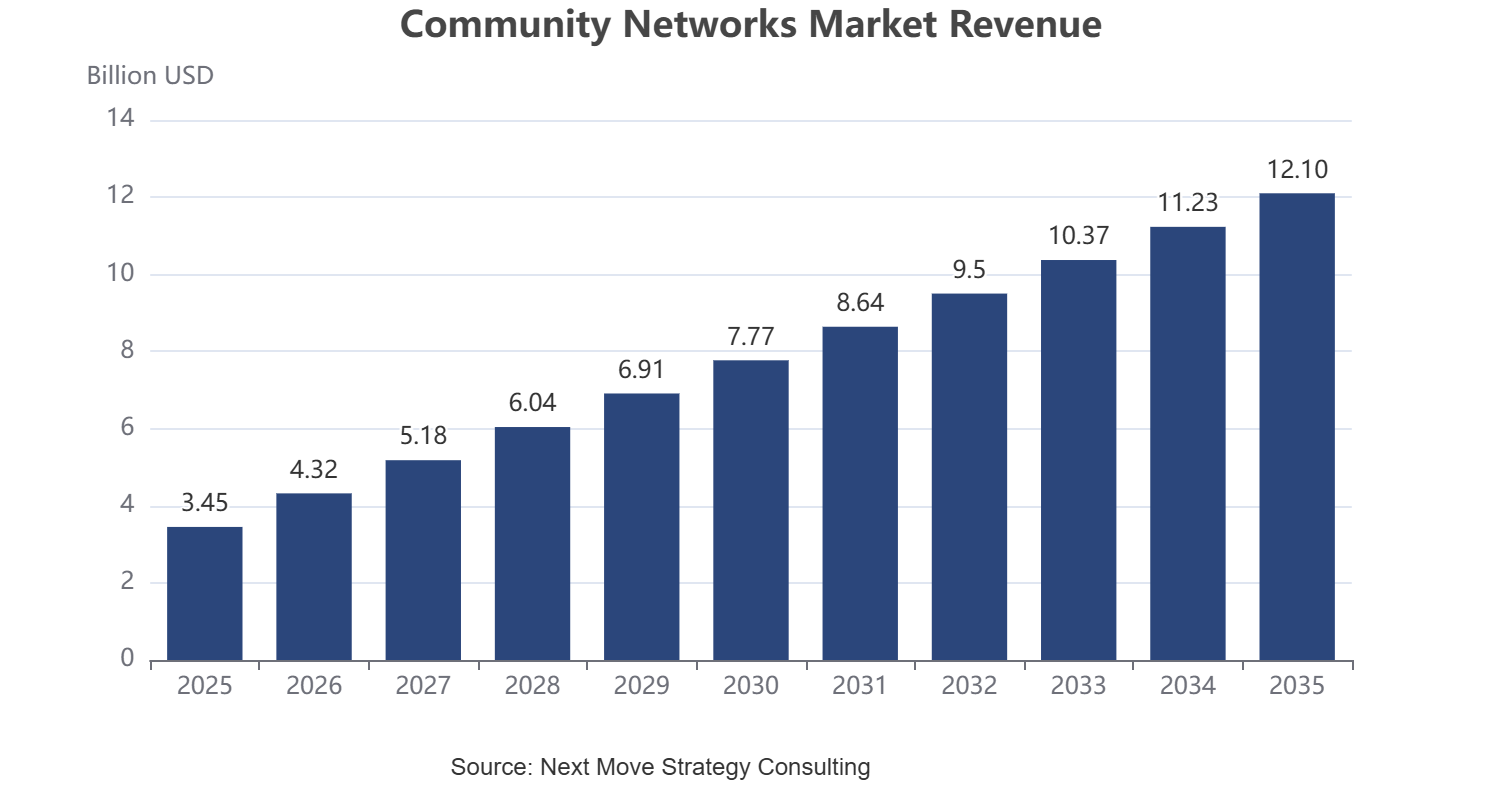
The global community networks market size was valued at USD 3.45 billion in 2025 and is estimated at USD 3.90 billion in 2026, forecast to reach USD 12.10 billion by 2035 at a 13.41% CAGR from 2026 to 2035. North America led with approximately 33% revenue share, while Wireless Community Networks dominated the primary segmentation axis at approximately 58% share in 2025.
We observed that momentum is broad-based across every segmentation axis of the community networks market, with residential deployment and wireless mesh technology driving the dominant structural shifts through 2035.
|
Key Takeaways |
|
By Type: Wireless Community Networks held the largest share of approximately 58% (USD 2.01 Billion) in 2025; Wireless Community Networks is the fastest-growing sub-segment at 14.8% CAGR from 2026–2035. |
|
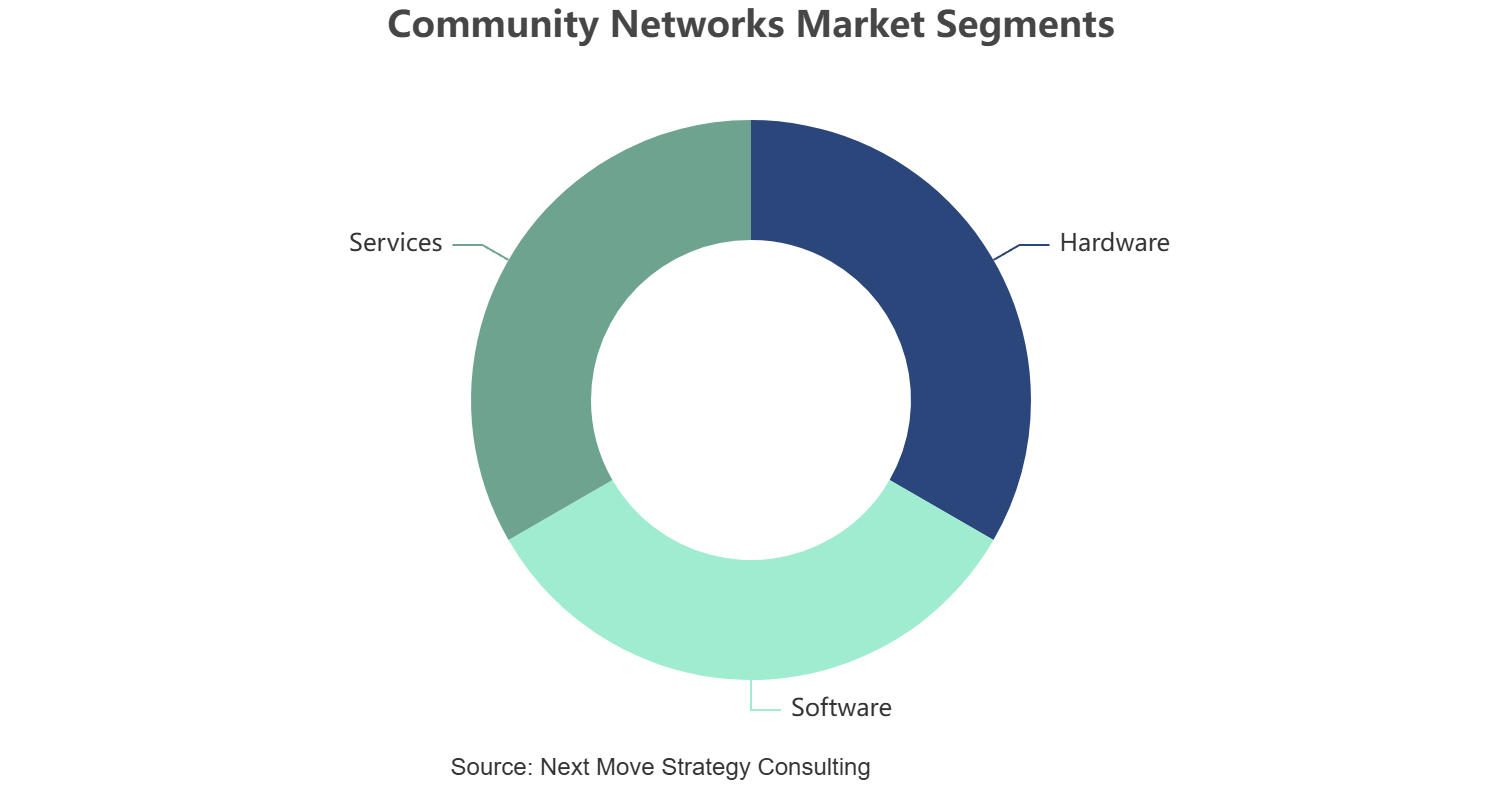
By Component: Hardware held the largest share of approximately 47% (USD 1.63 Billion) in 2025; Software is the fastest-growing sub-segment at 15.4% CAGR from 2026–2035. |
|
By End User: Residential held the largest share of approximately 44% (USD 1.52 Billion) in 2025; Public Safety & Government is the fastest-growing sub-segment at 14.6% CAGR from 2026–2035. |
|
Dominant Region: North America dominated with approximately 33% revenue share (USD 1.15 Billion) in 2025. |
|
Fastest-Growing Region: Asia Pacific is expected to register the highest CAGR of 16.0% during 2026–2035. |
|
Dominant Country: U.S. led with approximately USD 791.6 million in 2025. |
|
Fastest-Growing Country: India is the fastest-growing country at approximately 19.8% CAGR from 2026–2035. |
Market Opportunity: The community networks market is expected to create an absolute dollar opportunity of USD 8.20 billion between 2026 and 2035, presenting significant investment potential across the residential, public safety, and rural broadband connectivity value chain.
According to NMSC analysis, municipal and cooperative network operators are increasingly deploying wireless mesh infrastructure over wired fiber builds in underserved areas, a shift that is accelerating equipment demand from vendors supporting rapid, lower-capital rural broadband expansion.
What Does the Community Networks Market Encompass?
The community networks market encompasses locally owned or operated broadband infrastructure, including municipal fiber networks, cooperative-owned rural broadband systems, and wireless mesh deployments that deliver internet access outside traditional commercial telecom operators. Our assessment indicates that scope spans network hardware, management software, and deployment and support services supplied to residential, educational, public safety, and commercial end users across North America, Europe, Asia Pacific, Middle East & Africa, and Latin America.
We found that the market has evolved from grassroots wireless mesh experiments into a recognized broadband deployment model supported by government rural connectivity funding programs. Technology adoption is progressing through fixed wireless access equipment and open-source mesh networking software, while regulatory environments governing municipal broadband authority and spectrum access continue to shape which community network models gain traction across regions.
|
Parameters |
Details |
|
Market Size in 2025 |
USD 3.45 Billion |
|
Market Size in 2026 |
USD 3.90 Billion |
|
Revenue Forecast in 2035 |
USD 12.10 Billion |
|
Growth Rate |
CAGR of 13.41% from 2026 to 2035 |
|
Analysis Period |
2025–2035 |
|
Base Year Considered |
2025 |
|
Forecast Period |
2026–2035 |
|
Market Size Estimation |
Revenue (USD Billion) |
|
Companies Profiled |
12 |
|
Countries Covered |
33 |
|
Market Share |
Available for Top 10 Companies |
Key Emerging Trends
We found that four structural trends are reshaping how operators deploy and manage community network infrastructure across the industry.
How Is Fixed Wireless Access Accelerating Rural Deployment?
Fixed wireless access equipment is letting community and cooperative operators deploy broadband service in weeks rather than the months or years required for fiber trenching, directly addressing rural connectivity gaps. Cambium Networks and Cal.net's 2024 deployment of a 6 GHz fixed wireless network for underserved California communities illustrates how equipment vendors are enabling rapid rural rollout, a dynamic closely tied to the broader satellite internet category as multiple last-mile technologies compete to close the rural connectivity gap.
How Are Open-Source Mesh Platforms Lowering Deployment Barriers?
Open-source mesh networking software is reducing the technical and financial barriers for grassroots community groups to deploy and manage their own wireless networks without proprietary vendor lock-in. The guifi.net community network in Spain, one of the largest open participatory networks globally, exemplifies how open governance models are scaling community-operated infrastructure beyond small pilot deployments.
How Is Municipal Broadband Funding Reshaping Market Structure?
Government rural broadband funding programs are increasingly channeling capital toward municipal and cooperative network operators rather than only incumbent commercial carriers, expanding the addressable market for community network equipment vendors. This funding shift is elevating demand for standards-compliant hardware capable of meeting government-grade service reliability requirements, a trend we found is accelerating vendor certification programs industry-wide.
How Are Managed Network Services Supporting Smaller Operators?
Smaller municipal and cooperative operators are increasingly outsourcing network monitoring and management to third-party managed service providers rather than building in-house technical teams, mirroring broader adoption patterns in the Network as a Service category. We observed that this shift lets resource-constrained community operators focus capital on physical infrastructure expansion rather than ongoing operational staffing.
PESTEL Analysis of the Community Networks Market
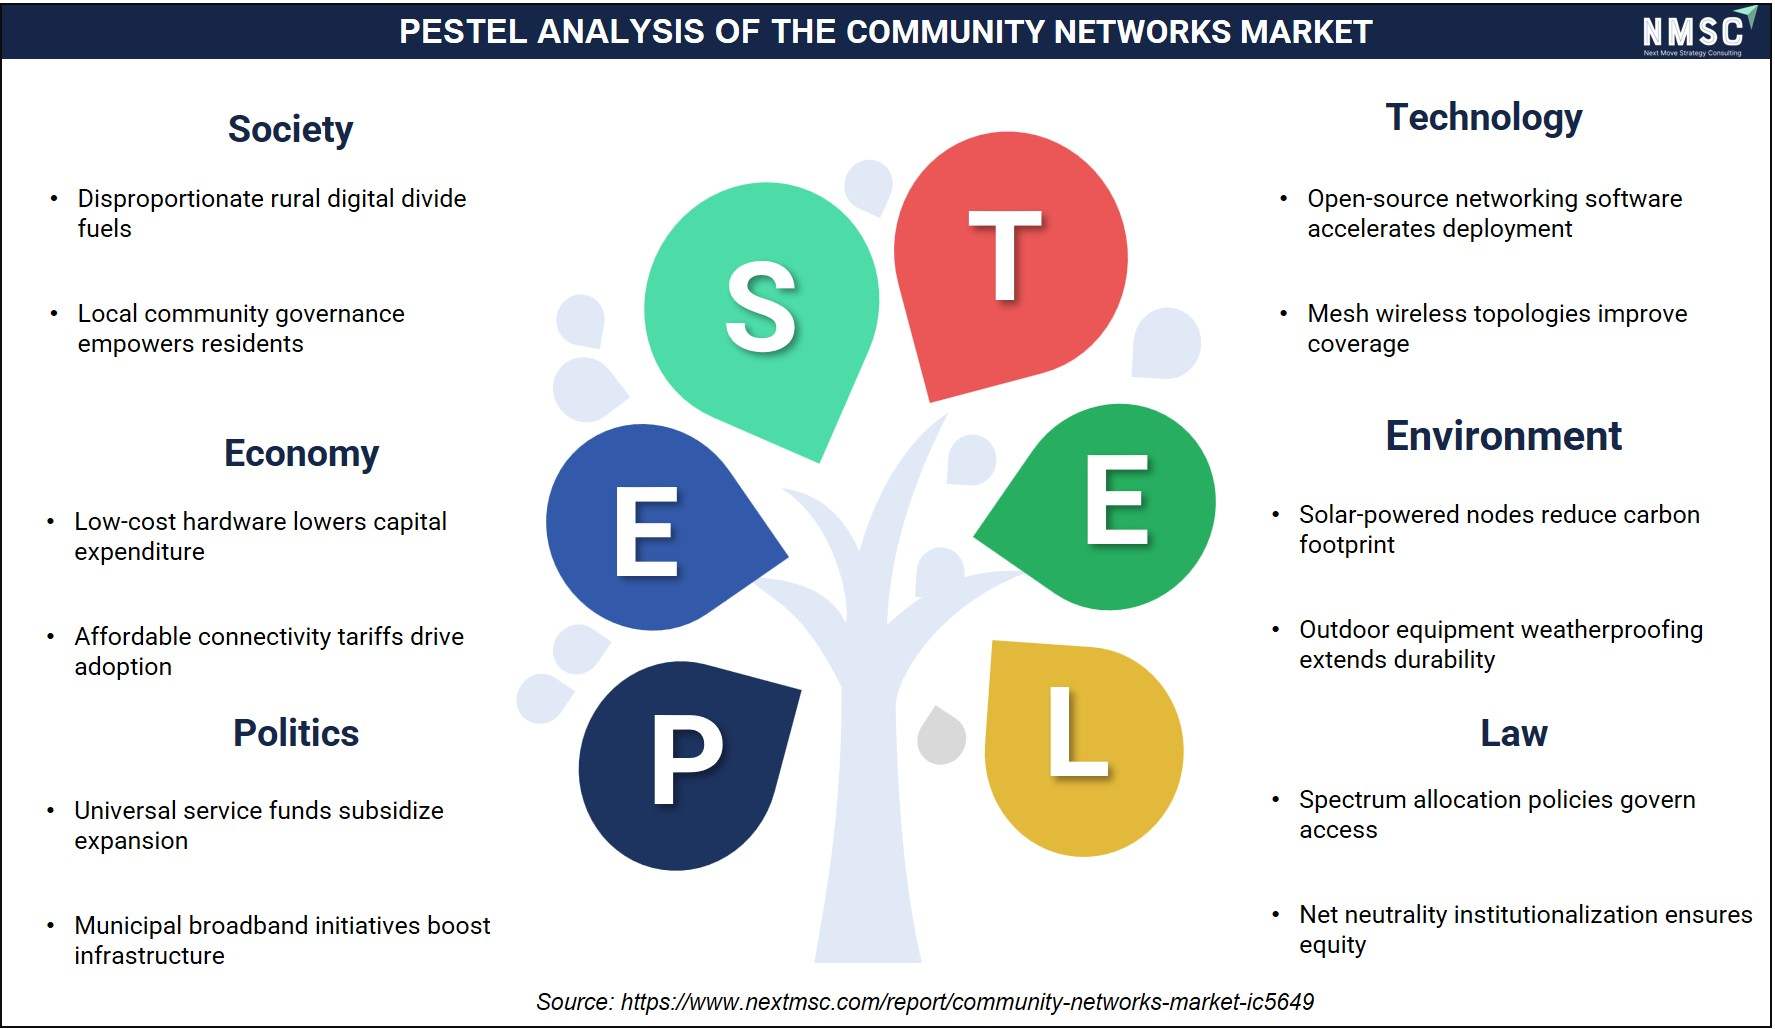
NMSC's analysis indicates that bridging the rural digital divide, municipal initiatives, and universal service funds drive expansion in the Community Networks Market. Furthermore, low-cost hardware and open-source software lower deployment costs, while wireless mesh topologies improve coverage. Concurrently, solar-powered nodes reduce carbon footprints, while spectrum allocation policies, simplified licensing rules, and net neutrality institutionalization govern legal compliance to ensure equitable, sustainable internet access across underserved regions.
Growth Drivers & Restraints
|
Factors |
Type |
(+/-) % Impact on CAGR |
Geographic Relevance |
Impact Timeline |
|
Government rural broadband funding programs |
Driver |
+3.1% |
North America, Europe |
2026–2032 |
|
Rising demand for affordable last-mile connectivity |
Driver |
+2.6% |
Global |
2026–2035 |
|
Growth of fixed wireless access equipment adoption |
Driver |
+2.2% |
Asia Pacific, MEA |
2026–2033 |
|
Expansion of public safety and emergency network requirements |
Driver |
+1.7% |
North America, Europe |
2026–2030 |
|
Municipal broadband authority expansion in developed markets |
Driver |
+1.4% |
North America |
2028–2035 |
|
Growing open-source mesh networking adoption |
Driver |
+1.1% |
Latin America, Europe |
2026–2031 |
|
Regulatory restrictions on municipal broadband authority |
Restraint |
−1.8% |
North America |
2026–2030 |
|
Limited technical capacity among volunteer-run operators |
Restraint |
−1.2% |
MEA, LATAM |
2026–2029 |
|
Competition from incumbent commercial carrier expansion |
Restraint |
−0.9% |
Global |
2026–2035 |
What Is the Primary Growth Driver for the Community Networks Market?
Government rural broadband funding programs remain the largest single driver of community network deployment, directing capital toward underserved areas that commercial carriers have historically bypassed. The U.S. Federal Communications Commission's Broadband Equity, Access, and Deployment program underscores the scale of public capital now available to municipal and cooperative operators, a dynamic our analysis shows is accelerating equipment procurement across rural markets.
How Is Demand for Affordable Last-Mile Connectivity Driving Market Growth?
Rising household demand for affordable broadband access in areas underserved by commercial carriers continues to sustain community network deployment, particularly where cooperative ownership models can offer lower subscription pricing than incumbent operators. This extends market demand beyond one-time government-funded builds into ongoing subscriber growth, widening the addressable market considerably as awareness of community broadband alternatives increases.
What Is Restraining the Community Networks Market?
Regulatory restrictions on municipal broadband authority in several U.S. states continue to limit the ability of local governments to build or operate their own networks, constraining market expansion in otherwise underserved areas. This restriction is documented in state-level telecommunications statutes, and our assessment indicates it remains a significant barrier slowing broader municipal network adoption despite strong underlying demand.
Segmentation Analysis
Segment Sizing: By Type
|
Segment |
2025 (USD) |
2035 (USD) |
CAGR% (2026–2035) |
|
Wireless Community Networks |
USD 2.01 Billion |
USD 7.81 Billion |
14.77% |
|
Wired Community Networks |
USD 1.44 Billion |
USD 4.29 Billion |
11.29% |
|
Total |
USD 3.45 Billion |
USD 12.10 Billion |
13.41% |
Which Type Leads the Community Networks Market?
Type segmentation splits the market between wireless mesh and wired fiber-based community network deployments. Our analysis shows that Wireless Community Networks held the dominant share in 2025 at USD 2.01 billion, reflecting operators' preference for lower-capital wireless deployment over fiber trenching in underserved areas. This same type is projected as the fastest-growing type through 2035 at a 14.77% CAGR.
Segment Sizing: By Component
|
Segment |
2025 (USD) |
2035 (USD) |
CAGR% (2026–2035) |
|
Hardware |
USD 1.63 Billion |
USD 5.05 Billion |
11.94% |
|
Software |
USD 0.72 Billion |
USD 2.98 Billion |
15.43% |
|
Services |
USD 1.10 Billion |
USD 4.07 Billion |
14.03% |
|
Total |
USD 3.45 Billion |
USD 12.10 Billion |
13.41% |
Which Component Generates the Most Revenue?
Component segmentation captures spending across network hardware, management software, and deployment services. We found that Hardware dominated in 2025 at USD 1.63 billion, as network buildouts require substantial upfront equipment investment. Software is the fastest-growing component at a 15.43% CAGR from 2026 to 2035, as operators increasingly adopt centralized network management platforms.
Segment Sizing: By End User
|
Segment |
2025 (USD) |
2035 (USD) |
CAGR% (2026–2035) |
|
Residential |
USD 1.52 Billion |
USD 4.80 Billion |
12.15% |
|
Educational Institutions |
USD 0.69 Billion |
USD 2.61 Billion |
14.35% |
|
Public Safety & Government |
USD 0.72 Billion |
USD 2.80 Billion |
14.63% |
|
Commercial & Small Business |
USD 0.52 Billion |
USD 1.89 Billion |
13.93% |
|
Total |
USD 3.45 Billion |
USD 12.10 Billion |
13.41% |
Which End User Generates the Most Community Network Revenue?
End-user segmentation distinguishes community network subscribers by connection type and purpose. Our assessment indicates Residential generated the largest revenue share in 2025 at USD 1.52 billion, reflecting the primary role of community networks in delivering household internet access. Public Safety & Government is the fastest-growing end-user category at a 14.63% CAGR from 2026 to 2035, as government funding prioritizes critical public infrastructure.
Growth Opportunities
Beyond the core growth drivers, three whitespace opportunities stand out for community network vendors positioning ahead of 2035.
How Can Government Funding Partnerships Expand Vendor Reach?
Equipment vendors that secure formal certification under government rural broadband funding programs can capture preferential procurement status with municipal and cooperative operators, creating a durable channel advantage over uncertified competitors bidding for the same publicly funded contracts.
How Can Managed Service Bundles Create Recurring Revenue?
Vendors that bundle managed network monitoring and support services alongside hardware sales can capture recurring revenue from resource-constrained community operators who lack in-house technical staff, opening a higher-margin service revenue stream beyond one-time equipment sales.
How Can Public Safety Network Certification Expand Market Access?
Vendors that achieve public safety-grade reliability certification for their equipment gain access to emergency services and government network contracts that carry higher margins and longer-term service agreements than standard residential deployments, benefiting producers positioned in the public safety and government end-user segment.
Regional Outlook
|
Region |
2025 (USD) |
2035 (USD) |
CAGR% (2026–2035) |
Key Driver |
|
North America |
USD 1.15 Billion |
USD 3.51 Billion |
11.67% |
Government rural broadband funding programs |
|
Europe |
USD 0.89 Billion |
USD 2.76 Billion |
11.78% |
Open-source community network initiatives |
|
Asia Pacific |
USD 0.89 Billion |
USD 3.85 Billion |
15.97% |
Rural connectivity infrastructure expansion |
|
Middle East & Africa |
USD 0.24 Billion |
USD 0.98 Billion |
15.27% |
Underserved area connectivity programs |
|
Latin America |
USD 0.28 Billion |
USD 1.00 Billion |
13.87% |
Cooperative broadband network growth |
|
Total |
USD 3.45 Billion |
USD 12.10 Billion |
13.41% |
— |
North America Community Networks Market Outlook
North America leads the community networks market on the strength of substantial government rural broadband funding programs and an established base of municipal and cooperative network operators. Regulatory variation across states regarding municipal broadband authority shapes deployment models. Our analysis indicates the region will retain its lead through 2035, supported by continued federal and state connectivity funding commitments.
Europe Community Networks Market Outlook
Europe's market is shaped by long-standing open-source community network initiatives and strong cooperative ownership traditions in rural connectivity. Regulatory influence from national digital inclusion policies supports continued community network expansion. Our assessment indicates that public funding for rural broadband gaps continues to sustain steady regional demand alongside grassroots community network growth.
Asia Pacific Community Networks Market Outlook
Asia Pacific is the fastest-growing region, propelled by large rural populations lacking commercial broadband access and expanding government digital inclusion programs. We observed that fixed wireless access technology is enabling rapid, lower-capital network deployment across the region's underserved rural areas, extending community network reach well beyond traditional urban markets.
Middle East & Africa Community Networks Market Outlook
The Middle East & Africa region is expanding on the back of underserved area connectivity programs addressing substantial rural broadband gaps. Regulatory influence from national digital inclusion strategies shapes growing government support for community-operated networks. We found that international development funding is a meaningful catalyst supporting regional network deployment alongside domestic government programs.
Latin America Community Networks Market Outlook
Latin America's growth is concentrated in cooperative broadband network expansion addressing rural connectivity gaps across Brazil and Argentina. Community-operated models are gaining traction as an alternative to limited commercial carrier rural coverage. Our findings suggest the region will continue posting steady growth as cooperative and municipal network models mature.
U.S. Community Networks Market
Based on our estimates, the U.S. community networks market was valued at approximately USD 791.6 million in 2025 and is projected to reach approximately USD 2296.2 million by 2035, growing at a 11.19% CAGR from 2026 to 2035. Demand structure is dominated by rural cooperative and municipal broadband deployments, with strong adoption levels supported by federal funding programs; competitive intensity remains high among fixed wireless equipment vendors, and strategic outlook favors continued rural network expansion.
Canada Community Networks Market
The market in Canada was valued at approximately USD 232.8 million in 2025 and is projected to reach approximately USD 721.1 million by 2035, growing at a 12.00% CAGR from 2026 to 2035. Remote and northern community connectivity needs drive demand structure, reflecting steady adoption levels supported by federal rural broadband programs; regulatory environment supports continued cooperative network development, and strategic outlook centers on expanding remote area coverage.
UK Community Networks Market
As per our estimate, the UK community networks market was valued at approximately USD 180.7 million in 2025 and is projected to reach approximately USD 498.7 million by 2035, growing at a 10.56% CAGR from 2026 to 2035. Demand structure centers on rural community broadband initiatives filling gaps left by commercial carrier coverage, with regulatory influence from national digital inclusion policy shaping funding availability; strategic outlook favors continued cooperative network model expansion.
Germany Community Networks Market
According to our analysis, the Germany community networks market was valued at approximately USD 153.6 million in 2025 and is projected to reach approximately USD 452.6 million by 2035, growing at a 11.37% CAGR from 2026 to 2035. Rural and semi-rural connectivity gaps drive a meaningful share of demand structure, supported by federal broadband expansion funding; adoption levels are steady, and strategic outlook favors continued public-private partnership network models.
France Community Networks Market
Based on our estimates, the France community networks market was valued at approximately USD 117.5 million in 2025 and is projected to reach approximately USD 332.8 million by 2035, growing at a 10.89% CAGR from 2026 to 2035. Rural connectivity programs and community network initiatives both contribute to demand structure, supported by national digital inclusion funding; strategic outlook favors continued government-backed rural broadband expansion.
China Community Networks Market
The market in China was valued at approximately USD 184.2 million in 2025 and is projected to reach approximately USD 752.9 million by 2035, growing at a 15.02% CAGR from 2026 to 2035. Large rural population connectivity gaps drive demand structure, with technology penetration accelerating through government-backed rural digital inclusion programs; strategic outlook favors continued public sector-led network infrastructure investment.
India Community Networks Market
As per our estimate, the India community networks market was valued at approximately USD 167.5 million in 2025 and is projected to reach approximately USD 985.8 million by 2035, growing at a 19.78% CAGR from 2026 to 2035. Demand structure is shaped by an exceptionally large underserved rural population and national digital connectivity programs extending broadband access; adoption levels are rising quickly, and strategic outlook favors fixed wireless deployment models suited to rapid rural scaling.
Japan Community Networks Market
According to our analysis, the Japan community networks market was valued at approximately USD 108.9 million in 2025 and is projected to reach approximately USD 368.6 million by 2035, growing at a 12.64% CAGR from 2026 to 2035. Remote island and mountainous area connectivity needs drive steady demand structure, with regulatory influence shaped by national digital divide reduction policy; strategic outlook favors incremental community network deployment in underserved geographies.
South Korea Community Networks Market
Based on our estimates, the South Korea community networks market was valued at approximately USD 83.7 million in 2025 and is projected to reach approximately USD 342.2 million by 2035, growing at a 15.02% CAGR from 2026 to 2035. High baseline digital infrastructure investment supports relatively strong adoption levels for remaining underserved rural pockets; strategic outlook favors partnerships between domestic technology vendors and community network operators.
Australia Community Networks Market
The market in Australia was valued at approximately USD 67.0 million in 2025 and is projected to reach approximately USD 241.6 million by 2035, growing at a 13.44% CAGR from 2026 to 2035. Vast rural and remote geography drives demand structure, supported by strong government rural connectivity funding programs; strategic outlook favors continued fixed wireless deployment across sparsely populated regions.
UAE Community Networks Market
As per our estimate, the UAE community networks market was valued at approximately USD 51.5 million in 2025 and is projected to reach approximately USD 239.6 million by 2035, growing at a 16.76% CAGR from 2026 to 2035. Underserved area connectivity programs drive demand structure, with technology penetration high among government-backed digital inclusion initiatives; strategic outlook favors continued public sector-led network development.
Saudi Arabia Community Networks Market
According to our analysis, the Saudi Arabia community networks market was valued at approximately USD 51.5 million in 2025 and is projected to reach approximately USD 233.8 million by 2035, growing at a 16.45% CAGR from 2026 to 2035. National digital inclusion and rural connectivity programs under broader development initiatives drive strong demand structure; strategic outlook favors continued large-scale rural network funding and deployment.
South Africa Community Networks Market
Based on our estimates, the South Africa community networks market was valued at approximately USD 16.4 million in 2025 and is projected to reach approximately USD 58.1 million by 2035, growing at a 13.28% CAGR from 2026 to 2035. Community-operated networks are expanding to address substantial rural connectivity gaps, supporting steady demand structure; strategic outlook favors partnerships with international equipment vendors offering low-cost fixed wireless solutions.
Brazil Community Networks Market
The market in Brazil was valued at approximately USD 114.3 million in 2025 and is projected to reach approximately USD 427.8 million by 2035, growing at a 14.13% CAGR from 2026 to 2035. Cooperative broadband network expansion drives the majority of regional demand structure, with adoption levels ahead of most Latin American peers; strategic outlook favors continued cooperative network model growth tied to rural connectivity gaps.
Argentina Community Networks Market
As per our estimate, the Argentina community networks market was valued at approximately USD 49.0 million in 2025 and is projected to reach approximately USD 172.1 million by 2035, growing at a 13.33% CAGR from 2026 to 2035. Rural connectivity gaps and community network initiatives lead regional growth, supported by the country's expanding digital inclusion programs; strategic outlook favors continued partnerships with established international network equipment vendors.
Ecosystem Analysis of the Community Networks Market
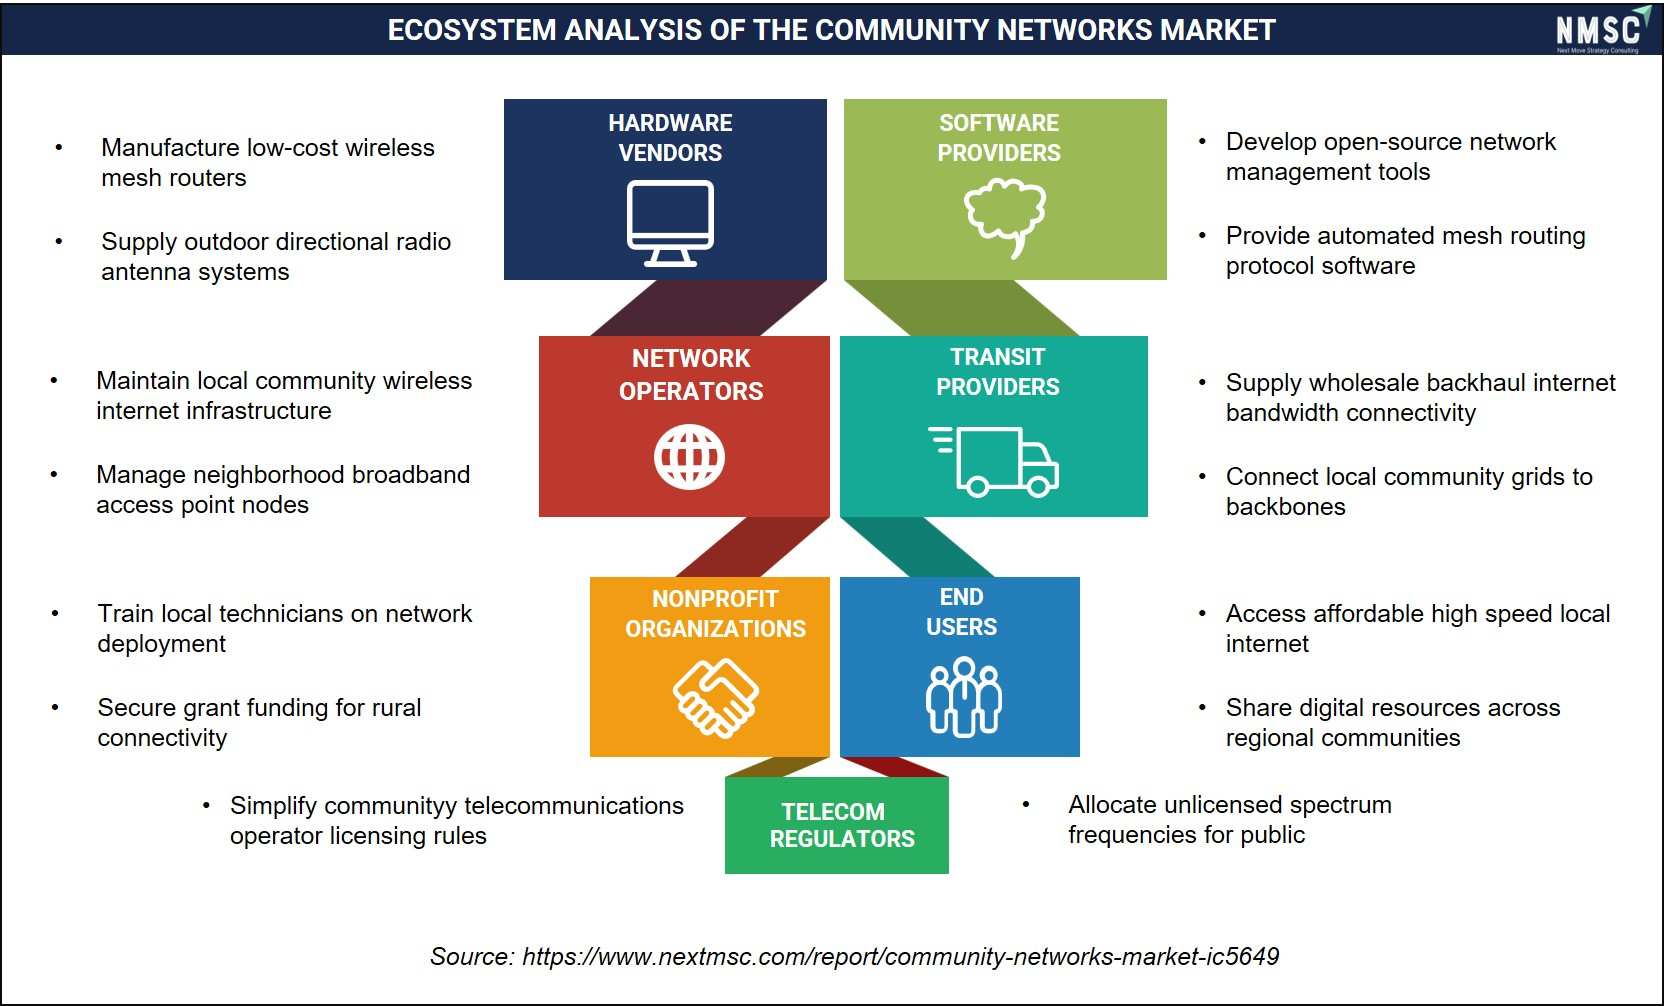
Based on research conducted by NMSC, we found that the Community Networks Market operates within an ecosystem connecting hardware vendors, open-source software providers, network operators, and transit providers. Nonprofits secure grants and train local technicians to empower residents, allowing end users to access affordable high-speed internet. Ultimately, telecom regulators allocate unlicensed spectrum frequencies and simplify operator licensing rules, ensuring reliable, compliant, and community-governed broadband connectivity across regional populations.
Competitive Landscape
We found that competitive dynamics in the community networks market center on deployment speed and government funding certification rather than price alone.
|
Category |
Details |
|
Market Structure |
Fragmented, spanning global network equipment vendors, regional fixed wireless specialists, and municipal or cooperative network operators. |
|
Innovation Focus |
Fixed wireless access performance, open-source mesh networking software, and government funding program certification. |
|
M&A Activity |
Consolidation among fixed wireless equipment vendors expanding spectrum and product line coverage. |
How Do Companies Compete in the Community Networks Market?
Competition centers on deployment speed, equipment reliability, and government funding program certification, since municipal and cooperative operators favor vendors whose equipment qualifies for public broadband funding. Our analysis shows that vendors differentiate through spectrum coverage breadth, field-proven reliability, and support for community-operated deployment models rather than through price competition alone.
Which Competitive Archetypes Dominate the Market?
Three archetypes define the landscape: global network equipment vendors such as Cisco and Ubiquiti serving broad enterprise and community markets, specialized fixed wireless vendors such as Cambium Networks and Tarana Wireless focused on rural deployment, and community-operated network entities such as EPB and UTOPIA Fiber that both deploy and manage infrastructure directly. We found that specialized fixed wireless vendors hold the strongest position in rapid rural deployment scenarios.
What Innovation and Differentiation Strategies Are Companies Pursuing?
Vendors are investing in higher-capacity fixed wireless spectrum utilization and simplified network management software that lets smaller community operators manage infrastructure without large technical teams. We observed that companies with strong government funding program certification use that positioning to capture preferential procurement status in publicly funded rural broadband contracts.
How Active Is M&A in the Competitive Landscape?
Consolidation has been most visible among fixed wireless equipment vendors expanding spectrum band coverage and product breadth, exemplified by Airspan Networks' integration of Mimosa Networks' product line. Our assessment indicates this pattern is likely to continue as vendors seek broader spectrum and use-case coverage to serve diversifying community network deployment scenarios.
Key Market Players
The following companies represent the verified set of active community networks market participants profiled in this report, ranked by scale of operations and documented market activity.
-
Cisco Systems, Inc.
-
Ubiquiti Inc.
-
Cambium Networks Corporation
-
Airspan Networks Inc.
-
Tarana Wireless, Inc.
-
NETGEAR, Inc.
-
Ceragon Networks Ltd.
-
EPB (Electric Power Board of Chattanooga)
-
UTOPIA Fiber
-
Tucows Inc. (Ting Internet)
-
Starry, Inc.
-
Fundació guifi.net
Latest Developments
We found that leading vendors and operators are expanding rural deployment programs, with the following developments reflecting the most recent verifiable activity in the market.
|
Date |
Event |
|
July 2026 |
Cambium Networks announced the official global release of its new high-density Wi-Fi 7 access point, the X7-56X, engineered specifically for enterprise and high-capacity community networking environments requiring seamless broadband throughput and ultra-low latency across multi-gigabit wireless architectures. |
|
January 2026 |
Cambium Networks unveiled an innovative software-defined networking capability within its Network Service Platform that integrates public IP addressing across LEO satellite and LTE/5G cellular connections, streamlining remote network management and hybrid edge connectivity for decentralized community infrastructure. |
|
October 2025 |
Cisco, together with the City of Los Angeles and nonprofit partners, launched the Crenshaw Community Connectivity Pilot, deploying cloud-managed outdoor Wi-Fi access points and Ultra-Reliable Wireless Backhaul technology to provide free community internet access while creating a platform for future smart-city services. |
|
June 2025 |
UTOPIA Fiber, in partnership with Bountiful City, Utah, completed its citywide open access fiber-optic network deployment nearly one year ahead of schedule, expanding high-speed gigabit and multi-gigabit internet infrastructure to pass over 16,500 homes and local business addresses across the region. |
Investment Opportunities
Where Are Capital Inflows Concentrated?
Capital inflows favor vendors with government funding program certification and proven rural deployment track records over unproven entrants, since certified equipment status supports more predictable, publicly funded revenue streams. Our assessment indicates that investors increasingly value spectrum coverage breadth and field deployment scale as durable competitive advantages.
What Infrastructure Investment Trends Are Emerging?
Network operators are investing in expanded fixed wireless base station and mesh node infrastructure to reach additional underserved subscribers within existing service territories. This infrastructure investment lowers per-subscriber deployment cost at scale, making expanded coverage increasingly attractive for cooperative and municipal operators pursuing sustainable long-term operating economics.
How Do ESG Considerations Factor Into Investment Decisions?
Community network deployment for underserved and rural populations aligns directly with environmental, social, and governance priorities around digital inclusion and equitable infrastructure access. We observed that development-finance institutions and public pension funds increasingly cite broadband access as a social-inclusion priority when evaluating infrastructure investment opportunities in this sector.
Key Benefits for Stakeholders
How Does This Report Benefit Industry Leaders?
Industry leaders overseeing network deployment and product portfolio decisions gain a segmentation view across type, component, and end user that clarifies where demand growth is concentrated. The regional outlook helps leaders benchmark market maturity against peer regions before committing to new deployment program investment.
How Does This Report Benefit Investors and Financial Analysts?
Investors evaluating exposure to broadband infrastructure markets gain a validated market-size trajectory from 2025 through 2035, alongside a competitive landscape identifying which company archetypes are consolidating share through funding certification and spectrum expansion. The Investment Opportunities section further clarifies where capital inflows are concentrated.
How Does This Report Benefit Network Vendors and Operators?
Network vendors and operators gain segmentation data identifying which components and end-user categories are growing fastest, informing product and deployment prioritization. The Key Emerging Trends and Growth Drivers sections identify the specific regulatory and funding dynamics currently shaping purchasing decisions across target customer segments.
Key Market Segments
By Type
-
Wireless Community Networks
-
Wired Community Networks
By Component
-
Hardware
-
Software
-
Services
By End User
-
Residential
-
Educational Institutions
-
Public Safety & Government
-
Commercial & Small Business
By Region
-
North America: U.S., Canada, Mexico
-
Europe: UK, Germany, France, Italy, Spain, Sweden, Denmark, Finland, Netherlands, Rest of Europe
-
Asia-Pacific: China, India, Japan, South Korea, Taiwan, Indonesia, Vietnam, Australia, Philippines, Malaysia, Rest of APAC
-
Middle East & Africa: Saudi Arabia, UAE, Egypt, Israel, Turkey, Nigeria, South Africa, Rest of MEA
-
Latin America: Brazil, Argentina, Chile, Colombia, Rest of LATAM
Conclusion & Recommendations
What Is the Long-Term Outlook for the Community Networks Market?
The community networks market is set to expand from USD 3.90 billion in 2026 to USD 12.10 billion by 2035, registering a 13.41% CAGR as government funding and technology advances make community-operated broadband an increasingly viable alternative to commercial carrier coverage. Long-term growth rests on continued government rural broadband funding, expanding fixed wireless deployment capability, and rising demand for affordable last-mile connectivity in underserved markets.
What Strategic Positioning Should Community Networks Vendors Pursue?
Vendors should prioritize government funding program certification and field-proven rural deployment reliability over purely cost-competitive positioning, since certified status supports more predictable, publicly funded revenue streams. Positioning around simplified network management for resource-constrained operators is particularly critical for vendors targeting cooperative and municipal customers.
How Attractive Is the Community Networks Market for New Investment?
Investment attractiveness is highest among vendors with government funding certification and broad spectrum coverage, since these characteristics correlate with durable, publicly backed revenue streams. Operators with proven community deployment models, such as established municipal utilities, represent a particularly attractive segment for infrastructure investment.
What Market Shifts and Key Risks Should Stakeholders Monitor?
The most significant structural shift is the growing role of government-funded rural broadband programs in directing capital toward community and cooperative operators rather than only commercial carriers. Key risks include regulatory restrictions on municipal broadband authority in several markets, limited technical capacity among volunteer-run operators, and continued expansion of incumbent commercial carrier rural coverage.
What Are the Key Growth Pathways for the Community Networks Market?
The clearest growth pathway runs through government funding program certification, where qualified equipment vendors capture preferential access to publicly funded rural broadband contracts. Secondary growth pathways include expanding fixed wireless deployment across Asia Pacific and the Middle East, and continued managed service bundling supporting resource-constrained cooperative operators.
About the Author
 Saista Faiyaz
— Saista Faiyaz is Research Associate at Next Move Strategy Consulting, where she has covered consumer markets and healthcare technologies for 3 years. Her work includes primary interview review, secondary-source validation, market sizing, and structured analysis of company and industry data. She supports research by comparing evidence across sources, organizing findings into market narratives, and documenting assumptions used in analysis. Her scope includes cross-market benchmarking, and reports.
Saista Faiyaz
— Saista Faiyaz is Research Associate at Next Move Strategy Consulting, where she has covered consumer markets and healthcare technologies for 3 years. Her work includes primary interview review, secondary-source validation, market sizing, and structured analysis of company and industry data. She supports research by comparing evidence across sources, organizing findings into market narratives, and documenting assumptions used in analysis. Her scope includes cross-market benchmarking, and reports.
About the Reviewer
 Supradip Baul
— Supradip Baul is an accomplished business consultant and strategist with over a decade of rich experience in market intelligence, strategy, technology, and business transformation. His work has included rigorous qualitative and quantitative analysis across multiple industries, helping clients shape investment decisions and long-term roadmaps. Earlier in his career, he was associated with Gartner, where he contributed to industry-leading reports and market share analyses. He has worked with leading global companies and holds an MBA with a dual specialization in Marketing and Finance.
Supradip Baul
— Supradip Baul is an accomplished business consultant and strategist with over a decade of rich experience in market intelligence, strategy, technology, and business transformation. His work has included rigorous qualitative and quantitative analysis across multiple industries, helping clients shape investment decisions and long-term roadmaps. Earlier in his career, he was associated with Gartner, where he contributed to industry-leading reports and market share analyses. He has worked with leading global companies and holds an MBA with a dual specialization in Marketing and Finance.
At Next Move Strategy Consulting, we understand that insightful market research is the cornerstone of successful business decisions. That's why we employ a robust and multifaceted approach, combining various methodologies to deliver the most accurate and actionable data for our clients.

Research Landscape
We navigate the world of research with two primary approaches:
Qualitative Approach
Our qualitative research methodologies involve immersive techniques such as in-depth interviews, focus groups, and observational studies. By engaging directly with individuals and stakeholders, we uncover valuable insights that quantitative data alone may overlook.

Quantitative Research
In tandem with qualitative methodologies, NMSC leverages the power of Quantitative Research to provide a robust foundation of numerical insights. Through systematic data collection and analysis, we quantify patterns, preferences, and market trends, offering a comprehensive view of the business landscape.
Our quantitative research approach employs diverse tools, including surveys, experiments, and statistical modelling. These methodologies enable us to gather data from a large and representative sample, ensuring the statistical significance of our findings. By employing structured questionnaires and standardized data collection methods, we guarantee the reliability and validity of the information we present to our clients.
Quantitative research is particularly effective in measuring the prevalence of trends, assessing market size, and gauging the impact of various factors on consumer behavior. The numerical precision attained through this approach equips our clients with actionable insights, facilitating data-driven decision-making and strategy formulation.


Our Specialized Toolbox for Industry-Specific Market Research
We deploy a specialized arsenal of techniques tailored to meet your unique requirements. Here's a glimpse into our comprehensive toolbox:

Information Procurement
The stage entails acquiring market data or relevant information through various sources and methodologies.


Market Research Approach
We utilize both top-down and bottom-up approaches in market research analysis to achieve a comprehensive understanding of the market dynamics, leveraging the broad perspective of industry trends and macroeconomic factors alongside detailed insights from specific segments and individual companies.

Porters Five Forces Analysis
We conduct Porter's Five Forces analysis to evaluate the competitive landscape of an industry, providing us with insights into factors that affect profitability and strategic positioning.

SWOT Analysis

Forecasting
We utilize a forecasting model to predict future consumption by considering parameters like population, economics, regulations, market competition, drivers, constraints, technology, and pricing. We also employ statistical techniques such as multilinear regression, exponential smoothing, moving average, ARIMA, and Monte Carlo simulations for accurate predictions. In econometric forecasting, we analyzed short-term and long-term event impacts, attributing values based on regulatory frameworks, economic factors, and market events.





 Speak to Our Analyst