Optimal Amplifier Market Size, Share, Trends and Growth Analysis, By Offering (Standalone Amplifiers, Amplifier Modules and Cards, Amplifier Components, and Services), By Technology (Erbium, Raman, Semiconductor, and Others), By Network Function, By Operating Band, By Sales Channel, By Application, By End User (Network Operators, Network Equipment Manufacturers, Data Center Operators, and Others), and Region -- Global Industry Report and Forecast, 2026—2035
Industry: ICT & Media | Publishing Date: July 31, 2026 | Last Updated: September 4, 2026 | No of Pages: N/A | No. of Tables: N/A | No. of Figures: N/A | Format: PDF | Report Code: IC5502
What Is the Optimal Amplifier Market Size?
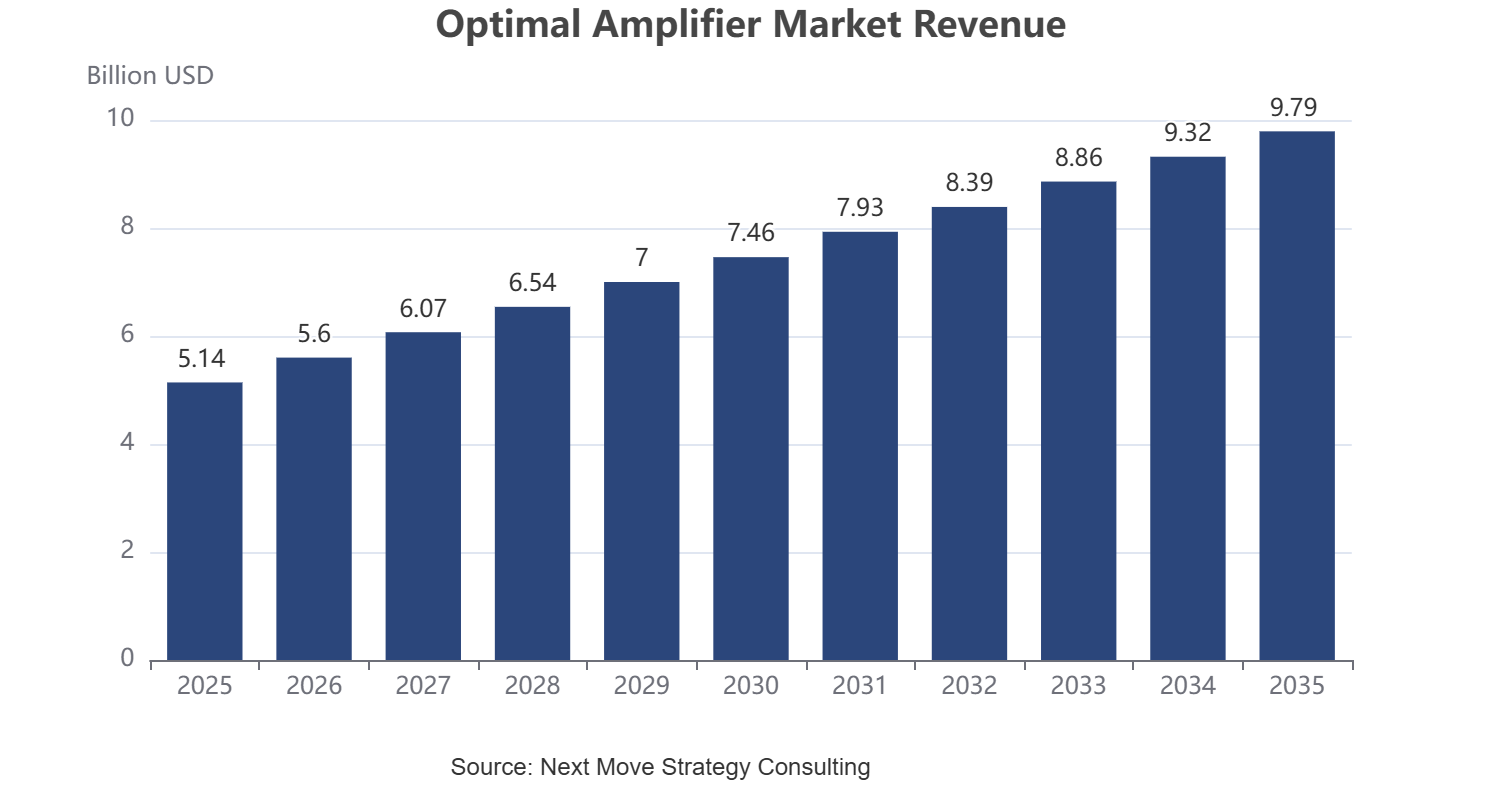
The global Optimal Amplifier Market size was valued at USD 5.14 Billion in 2025 and is estimated at USD 5.48 Billion in 2026, forecast to reach USD 9.79 Billion by 2035, expanding at a 6.65% CAGR between 2026 and 2035. North America leads with approximately a 32% share, while Amplifier Modules and Cards dominate all other offering types with approximately a 34% share.
We observed that growth is broadest in data-center-facing and multi-band segments, with semiconductor optical amplifiers and C- and L-band systems recording the strongest structural gains through 2035.
|
Key Takeaways |
|
By Offering: Amplifier Modules and Cards held the largest share of approximately 34% (USD 1.75 billion) in 2025; Services is the fastest-growing sub-segment at 9.9% CAGR from 2026-2035. |
|
By Technology: Erbium Doped Fiber Amplifier held the largest share of approximately 52% (USD 2.67 billion) in 2025; Semiconductor Optical Amplifier is the fastest-growing sub-segment at 12.1% CAGR from 2026-2035. |
|
By Network Function: In-Line Amplifier held the largest share of approximately 36% (USD 1.85 billion) in 2025; Gain Block Amplifier is the fastest-growing sub-segment at 11.4% CAGR from 2026-2035. |
|
By Operating Band: C Band held the largest share of approximately 48% (USD 2.47 billion) in 2025; Multi Band is the fastest-growing sub-segment at 11.1% CAGR from 2026-2035. |
|
By Sales Channel: Direct Sales held the largest share of approximately 42% (USD 2.16 billion) in 2025; System Integrator Sales is the fastest-growing sub-segment at 10.3% CAGR from 2026-2035. |
|
By Application: Long Haul Telecommunications held the largest share of approximately 30% (USD 1.54 billion) in 2025; Data Center Interconnect is the fastest-growing sub-segment at 13.7% CAGR from 2026-2035. |
|
By End User: Network Operators held the largest share of approximately 38% (USD 1.95 billion) in 2025; Data Center Operators is the fastest-growing sub-segment at 13.0% CAGR from 2026-2035. |
|
Dominant Region: North America dominated with approximately 32% revenue share (USD 1.65 billion) in 2025. |
|
Fastest-Growing Region: Asia-Pacific is expected to register the highest CAGR of 9.9% during 2026-2035. |
|
Dominant Country: U.S. led with approximately USD 1.22 billion in 2025. |
|
Fastest-Growing Country: India is the fastest-growing country at approximately 13.5% CAGR from 2026-2035. |
Market Opportunity: The Optimal Amplifier Market is expected to create an absolute dollar opportunity of USD 4.31 billion between 2026 and 2035, presenting significant investment potential across data-center-facing and multi-band amplification platforms.
According to NMSC analysis, hyperscale data center operators are emerging as a distinct amplifier demand pool separate from traditional telecom carriers, a shift that favors vendors capable of supplying compact, high-density amplifier modules alongside traditional long-haul and submarine gain systems through 2035.
What Does the Optimal Amplifier Market Encompass?
The Optimal Amplifier Market encompasses the standalone systems, modules, components, and services used to boost optical signal strength across fiber-optic communication networks. Our assessment indicates that the scope spans rack-mount and OEM standalone amplifiers, pluggable and embedded amplifier modules, core components including pump lasers and gain fiber, and the design, integration, and maintenance services that support network operators, equipment manufacturers, and data center operators worldwide.
Standards bodies including the Optical Internetworking Forum and the International Telecommunication Union shape interoperability specifications for amplifier modules deployed across metro, long-haul, and submarine networks. We observed that technology adoption is shifting toward C and L band and multi-band systems that expand fiber capacity without new cable installation. NMSC's analysis indicates that rising data center interconnect traffic is redefining amplifier specification requirements across the Optimal Amplifier Market.
|
Parameters |
Details |
|
Market Size in 2025 |
USD 5.14 Billion |
|
Market Size in 2026 |
USD 5.48 Billion |
|
Revenue Forecast in 2035 |
USD 9.79 Billion |
|
Growth Rate |
CAGR of 6.65% from 2026 to 2035 |
|
Analysis Period |
2025–2035 |
|
Base Year Considered |
2025 |
|
Forecast Period |
2026–2035 |
|
Market Size Estimation |
USD Billion |
|
Companies Profiled |
20 |
|
Countries Covered |
38 |
|
Market Share |
Available for Top 10 Companies |
Key Emerging Trends
Based on research conducted by NMSC, we found that four structural trends are reshaping technology adoption, sourcing strategy, and stakeholder engagement across the industry.
How Is AI-Driven Data Center Traffic Reshaping the Optimal Amplifier Market Demand?
Hyperscale AI data center buildouts are creating a distinct demand pool for compact, high-density amplification separate from traditional telecom deployment. We observed that Lumentum's OFC 2026 showcase of ultra-high-power laser sources and DWDM technologies for AI and cloud infrastructure illustrates how amplifier and pump-laser vendors are retooling product roadmaps around data center interconnect requirements rather than solely carrier long-haul specifications.
Why Are Network Operators Adopting C and L Band and Multi-Band Systems?
Network operators are increasingly deploying C and L band and multi-band amplification to expand fiber capacity without laying new cable. Our findings suggest that this trend is accelerating fastest across submarine cable system upgrades and dense metro networks, where multi-band amplifiers deliver capacity gains that materially reduce the cost per bit compared with new fiber deployment.
How Is Semiconductor Optical Amplifier Adoption Accelerating Component Innovation?
Semiconductor optical amplifiers are gaining share as photonic integration matures and vendors pursue smaller, lower-power gain elements suited to pluggable modules. We found that this shift is elevating demand for compact gain chips and control electronics, with component suppliers investing in wafer-scale manufacturing to reduce per-unit costs as pluggable module vendors specify semiconductor gain stages for next-generation transceivers.
What Role Does Photonic Integration Play in Amplifier Module Design?
Photonic integration is compressing amplifier module footprints, enabling higher channel density within fixed rack space. We observed that photonic integrated circuit adoption is elevating demand for integrated pump combiners and wavelength filters, as module vendors pursue tighter integration between gain stages and coherent transceiver electronics to meet hyperscale data center density requirements.
Growth Drivers and Restraints
Growth Catalyst and Risk Assessment Matrix
|
Factors |
Type |
(+/-) % Impact on CAGR |
Geographic Relevance |
Impact Timeline |
|
Rising AI-driven data center interconnect traffic |
Driver |
+2.2% |
Global |
2026–2035 |
|
Expanding submarine cable deployment |
Driver |
+1.6% |
Asia-Pacific, MEA |
2026–2035 |
|
C and L band and multi-band capacity upgrades |
Driver |
+1.7% |
Global |
2026–2035 |
|
Growth in photonic integration and pluggable modules |
Driver |
+1.4% |
North America, Asia-Pacific |
2026–2035 |
|
5G transport network densification |
Driver |
+1.1% |
Global |
2026–2032 |
|
Rising metro network fiber capacity investment |
Driver |
+1.0% |
Europe, Asia-Pacific |
2026–2035 |
|
High cost of coherent and multi-band systems |
Restraint |
-0.9% |
Global |
2026–2035 |
|
Pricing pressure from vertically integrated component suppliers |
Restraint |
-0.7% |
Asia-Pacific |
2026–2035 |
|
Supply chain constraints on specialty pump lasers |
Restraint |
-0.6% |
Global |
2026–2030 |
What Is the Primary Growth Driver of the Optimal Amplifier Market?
Rising AI-driven data center interconnect traffic is the primary driver of the market. The Federal Communications Commission continues to document rapid growth in broadband and data infrastructure buildout supporting hyperscale computing demand. We observed that this traffic growth, reinforced by continued 800G and 1.6T optical transceiver deployment, sustains baseline demand for both amplifier modules and standalone systems supplied to data center operators and network equipment manufacturers.
How Is Photonic Integration Driving Optimal Amplifier Market Growth?
Photonic integration is accelerating market growth by enabling compact, lower-power amplifier modules suited to dense data center and metro deployments. The Optical Internetworking Forum's interoperability specifications for pluggable coherent modules are pushing vendors toward standardized, integrated gain-stage designs. Our assessment indicates that this technology shift is accelerating adoption timelines for amplifier modules and cards across North America and Asia-Pacific hyperscale infrastructure buildouts.
What Is Restraining Optimal Amplifier Market Expansion?
The high cost of coherent and multi-band amplification systems restrains adoption among cost-sensitive regional and emerging-market carriers. The International Telecommunication Union continues to document uneven broadband infrastructure investment capacity across developing economies. We found that smaller network operators face particular exposure, as limited capital budgets constrain multi-band upgrade timelines relative to larger carriers with established capital expenditure programs.
Segmentation Analysis
Segment Sizing: By Offering
|
Segment |
2025 (USD) |
2035 (USD) |
CAGR% (2026-2035) |
|
Amplifier Modules and Cards |
USD 1.75 Billion |
USD 3.76 Billion |
8.9% |
|
Amplifier Components |
USD 1.44 Billion |
USD 2.47 Billion |
6.2% |
|
Standalone Amplifiers |
USD 1.23 Billion |
USD 1.89 Billion |
4.9% |
|
Services |
USD 0.72 Billion |
USD 1.68 Billion |
9.9% |
|
Total |
USD 5.14 Billion |
USD 9.79 Billion |
6.65% |
Which Offering Segment Dominates the Optimal Amplifier Market?
Amplifier Modules and Cards led the market with USD 1.75 billion in 2025, supported by rising pluggable and embedded module demand across data center and metro network deployments. We observed that Services is the fastest-growing offering, expanding at a 9.9% CAGR from 2026 to 2035, as network operators increasingly outsource design, integration, and maintenance work for increasingly complex multi-band amplification systems.
Segment Sizing: By Technology
|
Segment |
2025 (USD) |
2035 (USD) |
CAGR% (2026-2035) |
|
Erbium Doped Fiber Amplifier |
USD 2.67 Billion |
USD 4.54 Billion |
6.1% |
|
Raman Fiber Amplifier |
USD 0.93 Billion |
USD 1.78 Billion |
7.6% |
|
Semiconductor Optical Amplifier |
USD 0.62 Billion |
USD 1.72 Billion |
12.1% |
|
Ytterbium Doped Fiber Amplifier |
USD 0.41 Billion |
USD 0.76 Billion |
7.1% |
|
Thulium Doped Fiber Amplifier |
USD 0.21 Billion |
USD 0.41 Billion |
8.1% |
|
Bismuth Doped Fiber Amplifier |
USD 0.13 Billion |
USD 0.27 Billion |
8.6% |
|
Praseodymium Doped Fiber Amplifier |
USD 0.10 Billion |
USD 0.18 Billion |
6.6% |
|
Other Rare Earth Fiber Amplifiers |
USD 0.08 Billion |
USD 0.13 Billion |
5.5% |
|
Total |
USD 5.14 Billion |
USD 9.79 Billion |
6.65% |
Which Technology Segment Leads the Market Demand?
Erbium Doped Fiber Amplifier technology remained the dominant category, valued at USD 2.67 billion in 2025 on its established role as the standard gain medium across long-haul and metro networks. Our findings suggest that Semiconductor Optical Amplifier is the fastest-growing technology, registering a 12.1% CAGR from 2026 to 2035, as photonic integration and compact pluggable module designs favor semiconductor gain elements over traditional fiber-based amplification.
Segment Sizing: By Application
|
Segment |
2025 (USD) |
2035 (USD) |
CAGR% (2026-2035) |
|
Long Haul Telecommunications |
USD 1.54 Billion |
USD 2.43 Billion |
5.2% |
|
Metro Telecommunications |
USD 0.93 Billion |
USD 1.56 Billion |
6.0% |
|
Data Center Interconnect |
USD 0.82 Billion |
USD 2.61 Billion |
13.7% |
|
Submarine Communications |
USD 0.51 Billion |
USD 0.92 Billion |
6.7% |
|
Access Networks |
USD 0.41 Billion |
USD 0.68 Billion |
5.7% |
|
Cable Television Networks |
USD 0.31 Billion |
USD 0.41 Billion |
3.2% |
|
Industrial and Fiber Sensing |
USD 0.26 Billion |
USD 0.52 Billion |
8.2% |
|
Aerospace and Defense |
USD 0.21 Billion |
USD 0.38 Billion |
7.2% |
|
Scientific and Research |
USD 0.15 Billion |
USD 0.27 Billion |
6.2% |
|
Total |
USD 5.14 Billion |
USD 9.79 Billion |
6.65% |
Which Application Segment Is Most Widely Served in the Market?
Long Haul Telecommunications remained the dominant application, reaching USD 1.54 billion in 2025 due to sustained backbone network capacity expansion across major carriers. Based on research conducted by NMSC, we found that Data Center Interconnect represents the fastest-growing application at a 13.7% CAGR from 2026 to 2035, reflecting surging hyperscale AI infrastructure buildout and rising short-reach amplified link deployment between data center campuses.
Supply Chain Analysis of the Optical Amplifier Industry
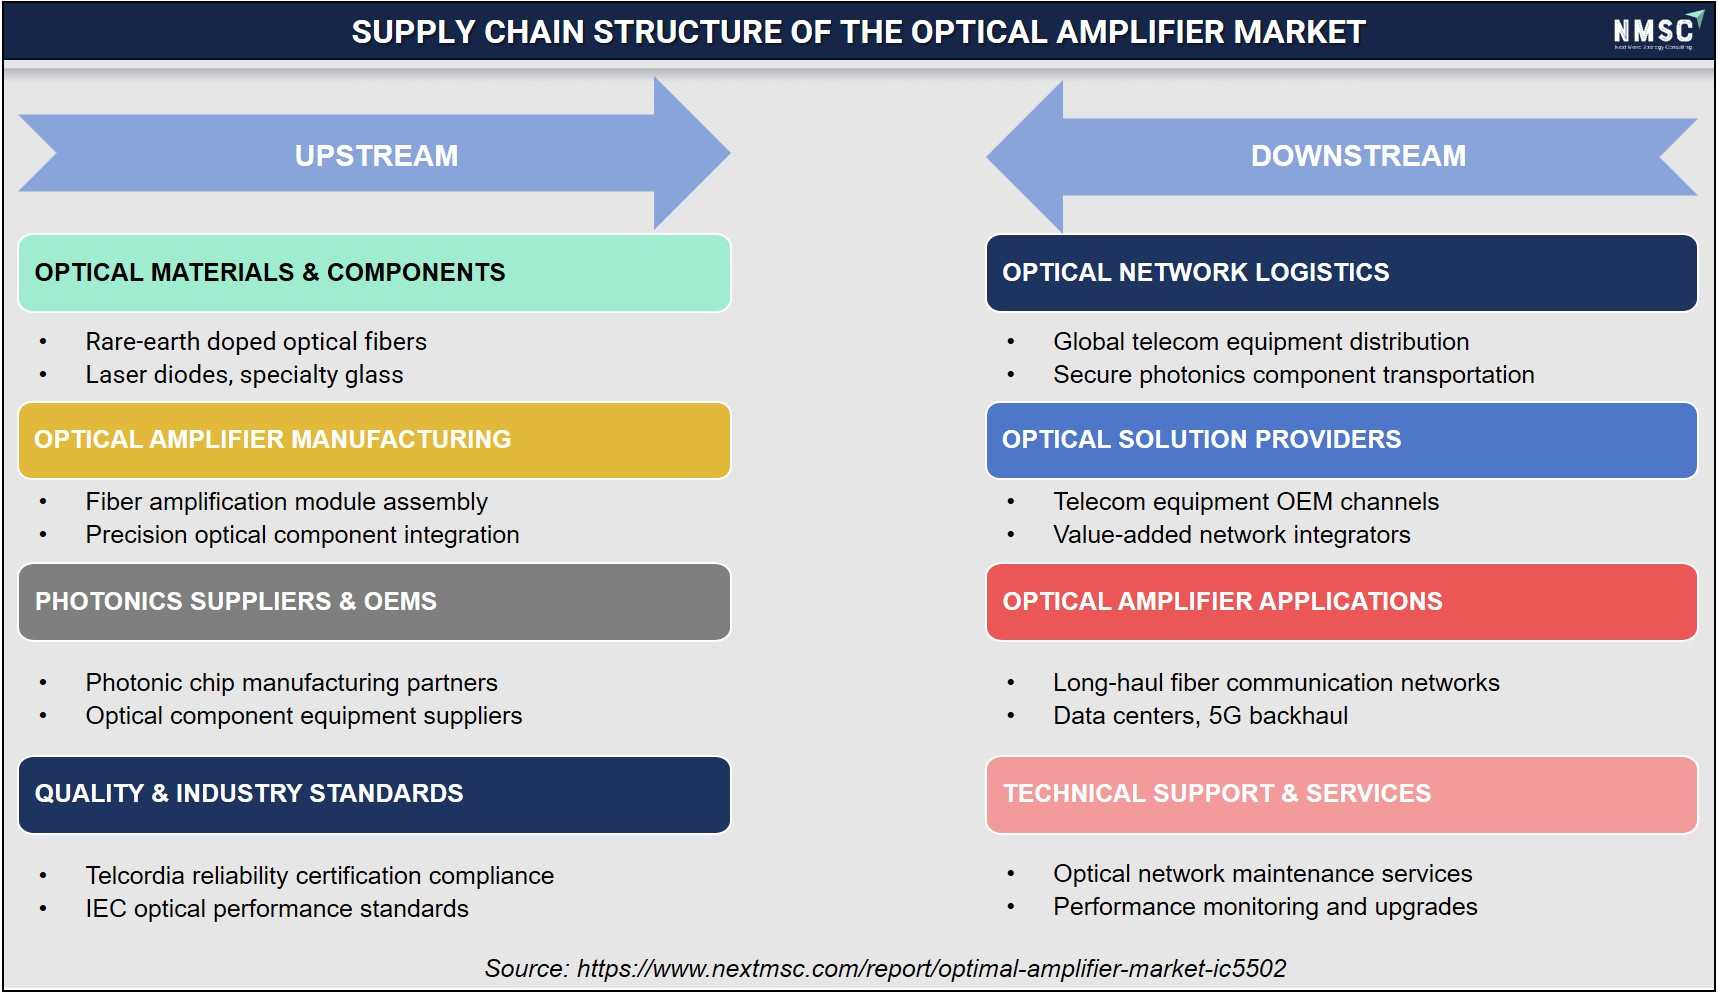
The above infographic presents the supply chain structure of the Optimal Amplifier Market, segmented into upstream and downstream activities. Upstream begins with rare-earth doped fibers, laser diodes, and specialty glass, which move into fiber amplification module assembly and precision optical integration. Photonic chip manufacturers and component suppliers support production, while compliance with Telcordia and IEC standards ensures reliability and performance. Moving downstream, global telecom logistics and OEM channels enable distribution to long-haul networks, data centers, and 5G backhaul applications. Looking ahead, we observed that network maintenance, performance monitoring, and upgrades ensure long-term system reliability and customer support across the market.
Growth Opportunities
Our analysis shows that three forward-looking opportunities stand out for stakeholders positioning within the Optimal Amplifier Market over the 2026-2035 forecast period.
How Can Compact Amplifier Modules Unlock Value for Data Center Operators?
Compact, high-density amplifier modules present a whitespace opportunity for vendors serving hyperscale data center operators pursuing rapid interconnect capacity expansion. Suppliers that commercialize low-power, high-channel-density modules stand to capture recurring procurement volume as data center operators standardize amplification specifications across new AI-oriented campus buildouts.
Where Do Multi-Band Upgrades Create New Demand Among Metro Carriers?
Metro telecommunications carriers represent an underpenetrated opportunity for multi-band amplifier upgrades that expand capacity on existing fiber without new cable investment. Providers that develop cost-competitive C-and L-band retrofit solutions can secure long-term upgrade contracts with metro carriers seeking to defer capital-intensive new fiber deployment.
How Can Semiconductor Optical Amplifiers Benefit Pluggable Module Vendors?
Pluggable module vendors integrating semiconductor optical amplifiers into next-generation transceivers create an opportunity for component suppliers offering compact gain chips and control electronics. Early movers that streamline coherent optical transceiver integration with semiconductor gain stages can differentiate with module vendors pursuing smaller form factors for hyperscale deployment.
Regional Outlook
Geographic Performance Snapshot
|
Region |
2025 (USD) |
2035 (USD) |
CAGR% (2026-2035) |
Key Driver |
|
North America |
USD 1.65 Billion |
USD 2.76 Billion |
5.9% |
Hyperscale AI data center buildouts and long-haul network upgrades |
|
Asia-Pacific |
USD 1.54 Billion |
USD 3.62 Billion |
9.9% |
Expanding submarine cable and metro fiber deployment in China and India |
|
Europe |
USD 1.13 Billion |
USD 1.85 Billion |
5.6% |
C and L band capacity upgrades across pan-European backbone networks |
|
Middle East & Africa |
USD 0.46 Billion |
USD 0.92 Billion |
7.9% |
Submarine cable landing station and terrestrial backbone expansion |
|
Latin America |
USD 0.36 Billion |
USD 0.64 Billion |
6.6% |
Growing metro and long-haul fiber investment across regional carriers |
|
Total |
USD 5.14 Billion |
USD 9.79 Billion |
6.65% |
-- |
North America
North America leads the market with an established base of hyperscale data center operators and long-haul carriers upgrading to higher-capacity amplification systems. We observed that rapid AI infrastructure buildout sustains demand for compact, high-density amplifier modules, while established carriers continue multi-band retrofits across existing long-haul routes. Technology adoption remains advanced, with photonic integration driving demand across the region's dense data center interconnect corridors.
Europe
Europe's Optimal Amplifier Market reflects a mature, upgrade-driven landscape shaped by pan-European backbone network capacity expansion. Our findings suggest that carriers across Germany, France, and the UK are accelerating adoption of C and L band systems to defer new fiber investment. Technology adoption favors multi-band retrofit solutions, supported by regional component suppliers investing in compact gain-stage manufacturing.
Asia-Pacific
Asia-Pacific is the fastest-growing Optimal Amplifier Market region, propelled by expanding submarine cable deployment and dense metro fiber buildout across China and India. We found that regulatory frameworks remain less harmonized than in Europe, giving component suppliers flexibility to scale manufacturing rapidly. Technology adoption is accelerating as regional module vendors expand semiconductor optical amplifier production to serve global data center customers.
Middle East & Africa
The market in the Middle East & Africa is expanding as Gulf Cooperation Council economies invest in submarine cable landing infrastructure and terrestrial backbone capacity. Our analysis shows that Saudi Arabia and the UAE are attracting amplifier investment tied to regional connectivity hub ambitions. Regulatory influence remains developing, while technology adoption is gradually shifting toward higher-capacity C and L band systems as regional carriers modernize backbone networks.
Latin America
Latin America's market is supported by growing metro and long-haul fiber investment across Brazil and Argentina. We observed that regulatory frameworks are less stringent than in North America or Europe, though multinational carriers operating locally are introducing standardized amplification specifications. Technology adoption remains centered on established erbium-based systems, with competitive intensity increasing as regional integrators partner with global component vendors.
U.S.
Based on our estimates, the U.S. market was valued at approximately USD 1.22 billion in 2025 and is projected to reach USD 1.92 billion by 2035, growing at a 5.2% CAGR. Demand is anchored by extensive hyperscale data center buildout and established long-haul carrier networks. Technology penetration favors compact amplifier modules and semiconductor optical amplifiers, and competitive intensity remains high among established component and systems vendors serving national carrier accounts.
Canada
The market in Canada reached roughly USD 0.23 billion in 2025 and is forecast to hit USD 0.36 billion by 2035 at a 5.0% CAGR. Demand structure mirrors U.S. long-haul and metro network consumption patterns, with growing data center interconnect investment in central provinces. Technology penetration is rising as carriers request multi-band retrofit solutions, with competitive intensity moderate given reliance on cross-border component supply from U.S.-based vendors.
UK
As per our estimate, the UK market stood at about USD 0.22 billion in 2025, advancing toward USD 0.33 billion by 2035 at a 5.0% CAGR. Demand is driven by established carriers upgrading metro and submarine landing infrastructure. Regulatory influence from telecommunications infrastructure policy is moderate, technology penetration favors C and L band adoption, and competitive intensity remains steady among domestic and European suppliers.
Germany
According to our analysis, Germany's market was valued at near USD 0.28 billion in 2025 and is set to reach USD 0.45 billion by 2035, expanding at a 5.4% CAGR. Demand structure benefits from Germany's role as a central European network interconnection hub. Regulatory influence from European telecommunications standards shapes procurement specifications, while technology penetration favors multi-band amplification among leading providers.
France
Based on our estimates, France's market reached approximately USD 0.17 billion in 2025, projected to climb to USD 0.26 billion by 2035 at a 4.8% CAGR. Demand is supported by France's established submarine cable landing infrastructure and metro network base. Regulatory influence from national telecommunications requirements is notable, and competitive intensity remains moderate given the concentration of regional integrators serving domestic carriers.
China
The market in China stood at roughly USD 0.49 billion in 2025 and is forecast to reach USD 1.21 billion by 2035, registering a 10.5% CAGR. Demand is fueled by expanding domestic data center buildout and a dense base of regional component manufacturers. Regulatory influence is increasing gradually, technology penetration is accelerating through export-oriented manufacturing capacity, and competitive intensity remains elevated among numerous China-based suppliers.
India
As per our estimate, India's market was valued at about USD 0.23 billion in 2025, projected to reach USD 0.72 billion by 2035 at a 13.5% CAGR, the fastest among covered countries. Demand structure reflects rising data center investment and expanding domestic fiber backbone capacity. Regulatory influence remains developing, while technology penetration is rising quickly as global vendors localize component sourcing to serve India's growing digital infrastructure base.
Japan
According to our analysis, Japan's market reached close to USD 0.25 billion in 2025 and is expected to hit USD 0.47 billion by 2035, growing at a 7.5% CAGR. Demand is supported by Japan's established submarine cable manufacturing heritage and dense metro network base. Regulatory influence is well established, technology penetration is advanced, and competitive intensity remains high among long-standing domestic and multinational component suppliers.
South Korea
Based on our estimates, South Korea's market stood at approximately USD 0.15 billion in 2025, forecast to reach USD 0.34 billion by 2035 at a 9.0% CAGR. Demand structure benefits from the country's dense 5G transport network and data center expansion momentum. Technology penetration is high, with domestic vendors supplying semiconductor optical amplifier components, and competitive intensity remains pronounced amid rapid platform innovation cycles.
Australia
The Optimal Amplifier Market in Australia reached about USD 0.08 billion in 2025 and is projected to reach USD 0.14 billion by 2035, expanding at a 7.0% CAGR. Demand is supported by growing submarine cable landing investment and metro network capacity upgrades. Regulatory influence stems from national telecommunications infrastructure guidance, while technology penetration favors C and L band systems amid moderate competitive intensity.
UAE
As per our estimate, the UAE market was valued at near USD 0.13 billion in 2025, projected to reach USD 0.26 billion by 2035 at an 8.0% CAGR. Demand structure is shaped by the UAE's role as a regional connectivity and submarine cable landing hub. Regulatory influence remains moderate, technology penetration is improving through multi-band amplifier deployment, and competitive intensity is rising as vendors expand regional service portfolios.
Saudi Arabia
According to our analysis, Saudi Arabia's market reached roughly USD 0.12 billion in 2025 and is expected to hit USD 0.25 billion by 2035, growing at an 8.5% CAGR. Demand is driven by Vision 2030-linked digital infrastructure investment and expanding domestic backbone capacity. Regulatory influence is developing under national telecommunications guidelines, and technology penetration is advancing as domestic and multinational vendors scale supply.
South Africa
Based on our estimates, South Africa's market stood at about USD 0.06 billion in 2025, forecast to reach USD 0.09 billion by 2035 at a 6.0% CAGR. Demand structure reflects a developing backbone and submarine cable infrastructure serving regional Southern African markets. Regulatory influence remains moderate, technology penetration is gradually improving, and competitive intensity is limited given reliance on component supply from international vendors.
Brazil
The market in Brazil reached approximately USD 0.15 billion in 2025 and is projected to reach USD 0.27 billion by 2035, registering a 6.5% CAGR. Demand is underpinned by Brazil's large domestic long-haul network and expanding metro fiber investment. Regulatory influence stems from national telecommunications requirements, technology penetration favors erbium-based systems, and competitive intensity remains moderate among regional integrators.
Argentina
As per our estimate, Argentina's market was valued at near USD 0.06 billion in 2025, projected to reach USD 0.09 billion by 2035 at a 5.5% CAGR. Demand structure is supported by steady metro and long-haul network investment despite macroeconomic volatility. Regulatory influence remains limited, technology penetration is modest, and competitive intensity is centered on a small number of regional integrators serving domestic carriers.
Competitive Landscape
We observed that the Optimal Amplifier Market features a moderately consolidated competitive landscape, with global photonics component vendors competing alongside specialized amplifier and laser manufacturers on gain performance, integration density, and delivery scale.
|
Key Takeaways |
Details |
|
Market Structure |
Moderately consolidated; the top companies profiled in this report collectively account for a majority of global optimal amplifier revenue, while numerous regional component specialists serve niche gain fiber, pump laser, and industrial amplification demand. |
|
Innovation Focus |
Photonic integration, semiconductor optical amplifier miniaturization, and multi-band gain-stage development dominate current innovation pipelines across leading vendors. |
|
M&A Activity |
Selective consolidation through capability acquisitions, exemplified by Lumentum's acquisition of Cloud Light Technology to strengthen cloud photonics and optical component manufacturing scale. |
How Do Companies Compete in the Optimal Amplifier Market?
Companies compete primarily on gain performance, integration density, and manufacturing scale across the industry. Global photonics vendors such as Lumentum Holdings Inc. and Coherent Corp. leverage broad component portfolios to serve hyperscale data center and telecom customers, while specialized laser manufacturers such as IPG Photonics Corporation and Thorlabs, Inc. compete on pump source performance and precision manufacturing for demanding scientific and industrial amplification applications.
Which Competitive Archetypes Dominate the Market?
Two archetypes dominate the market: diversified global photonics vendors offering integrated component and module portfolios, and specialized manufacturers focused on high-performance gain fiber, pump lasers, or niche amplifier technologies. Lumentum Holdings Inc. and Coherent Corp. exemplify the diversified archetype through combined component and systems offerings, while Amonics Limited and MPB Communications Inc. exemplify the specialist archetype serving scientific and industrial amplification niches.
How Are Companies Differentiating Through Innovation in the Market?
Innovation and differentiation strategy increasingly center on photonic integration and compact, high-power gain-stage design. Lumentum's ultra-high-power laser sources and 16-channel DWDM technology demonstrated at OFC 2026 extend pump laser performance for next-generation amplification architectures. Our analysis shows that vendors unable to demonstrate compact, power-efficient designs risk exclusion from hyperscale data center procurement, where rack density requirements increasingly favor integrated module suppliers.
What M&A and Expansion Activity Is Shaping the Optimal Amplifier Market?
Mergers, acquisitions, and capacity expansion continue to consolidate amplification capabilities within the industry. Lumentum's acquisition of Cloud Light Technology in January 2025 broadened its cloud photonics manufacturing capacity, while component suppliers continue to expand production capacity across Asia-Pacific to serve growing data center and submarine cable demand. These moves illustrate how diversified groups pursue geographic expansion and manufacturing scale across carrier, data center, and defense customer segments.
Key Market Players
Our assessment indicates that the following 20 companies are actively shaping product innovation, manufacturing expansion, and technology strategy within the global Optimal Amplifier Market.
-
Lumentum Holdings Inc.
-
Coherent Corp.
-
Sumitomo Electric Industries, Ltd.
-
Accelink Technologies Co., Ltd.
-
Amonics Limited
-
Hamamatsu Photonics K.K.
-
Thorlabs, Inc.
-
IPG Photonics Corporation
-
Ekinops S.A.
-
PacketLight Networks Ltd.
-
Wuxi Taclink Optoelectronics Technology Co., Ltd.
-
Innolume GmbH
-
Inphenix, Inc.
-
Fujikura Ltd.
-
Exail Technologies
-
Fujitsu Optical Components Limited
-
Menlo Systems GmbH
-
O-Net Technologies (Group) Limited
Latest Developments
We found that recent product and expansion announcements within the Optimal Amplifier Market are concentrated on high-power laser sources and photonic integration, reflecting the industry's broader shift toward data-center-facing amplification architectures.
|
Date |
Event |
|
March 2026 |
Lumentum demonstrated ultra-high-power 1310 nm laser sources and 16-channel DWDM laser technology at OFC 2026 in Los Angeles, targeting pump and gain-stage components for next-generation AI and cloud data center optical infrastructure. |
Porter's Five Forces Analysis of the Optical Amplifier Industry
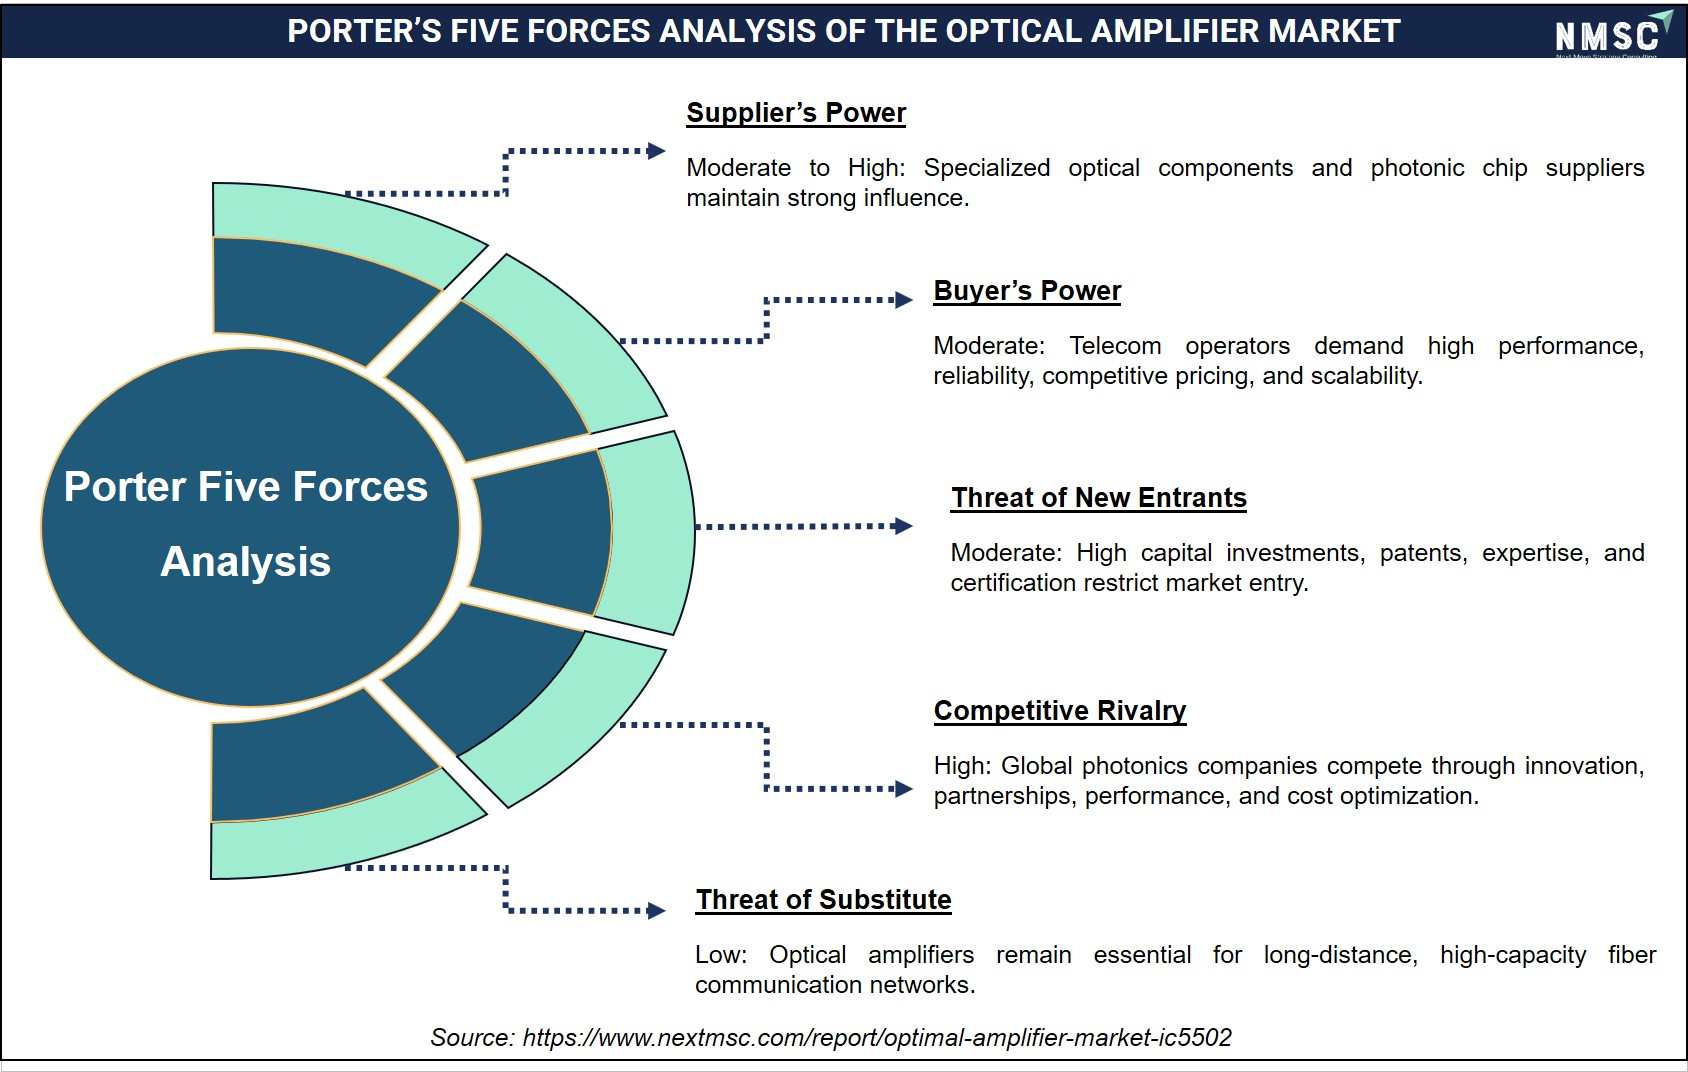
The above infographic presents a Porter's Five Forces analysis of the Optimal Amplifier Market, where supplier power remains moderate to high due to reliance on specialized optical components and photonic chip suppliers. At the same time, buyer power is significant as telecommunications and data center operators demand high performance and cost efficiency. The threat of new entrants is moderate, constrained by high capital investments, patents, and certification requirements, though competitive rivalry is intense among global photonics companies competing through innovation and performance optimization. Looking ahead, we observed that the threat of substitutes remains low, as optical amplifiers are essential for long-distance, high-capacity fiber communications networks.
Investment Opportunities
What Capital Inflows Are Targeting the Market?
Capital inflows into the Optimal Amplifier Market are increasingly directed toward photonic integration and high-power laser source development. Strategic acquirers continue to fund capability consolidation, as seen in Lumentum's acquisition of Cloud Light Technology. We observed that investors favor vendors demonstrating manufacturing scale and integration density, viewing hyperscale data center design wins as a proxy for long-term revenue growth.
How Is Infrastructure Investment Supporting Optimal Amplifier Market Delivery?
Infrastructure investment is expanding manufacturing capacity across Asia-Pacific, particularly in China and Japan, to serve rising global data center and submarine cable demand. Our findings suggest that component suppliers are investing in wavelength-selective switch and amplifier integration capabilities to improve supply consistency across module, gain fiber, and pump laser production lines supporting growing data center customer volumes.
What ESG Considerations Are Shaping Optimal Amplifier Investment Decisions?
Environmental, social, and governance considerations increasingly factor into investment decisions, with energy efficiency of amplification systems and responsible sourcing of rare earth gain fiber materials as key criteria. We found that investors increasingly favor providers with documented energy-efficiency roadmaps, treating power-per-channel improvements as a governance indicator alongside supply chain transparency for specialty optical materials.
Key Benefits for Stakeholders
How Does This Report Benefit Enterprise and Industry Leaders?
Enterprise and industry leaders gain access to validated segmentation, competitive benchmarking, and regional demand forecasts that support sourcing and technology-investment decisions across the optimal amplifier industry. Our analysis shows that detailed offering, technology, and application breakdowns help procurement and network planning teams align vendor selection with capacity and integration requirements.
How Does This Report Benefit Investors and Financial Analysts?
Investors and financial analysts benefit from consistent, single-point market size and CAGR estimates that support valuation and capital-allocation decisions across the optimal amplifier supply chain. We observed that the report's regional and segment-level growth differentials help identify which component vendors and module suppliers are best positioned to capture above-market growth in data-center-facing categories through 2035.
How Does This Report Benefit Technology Vendors and Product Teams?
Technology vendors and product teams gain insight into emerging requirements, including photonic integration, multi-band amplification, and compact module design, that are reshaping the industry. Our findings suggest that this analysis helps R&D teams prioritize development roadmaps around semiconductor optical amplifier miniaturization and high-power laser source capabilities increasingly required in hyperscale data center procurement.
Key Market Segments
By Offering
-
Standalone Amplifiers
-
Rack Mount Amplifiers
-
Benchtop Amplifiers
-
Compact Amplifiers
-
OEM Amplifiers
-
-
Amplifier Modules and Cards
-
Pluggable Modules
-
Embedded Modules
-
Line Card Amplifiers
-
Remote Optical Amplifier Units
-
-
Amplifier Components
-
Pump Lasers
-
Gain Fiber
-
Semiconductor Gain Chips
-
Optical Isolators
-
Wavelength Filters
-
Pump Combiners
-
Control Electronics
-
-
Services
-
Design and Engineering
-
System Integration
-
Installation and Commissioning
-
Maintenance and Repair
-
Technical Support
-
By Technology
-
Erbium Doped Fiber Amplifier
-
Raman Fiber Amplifier
-
Semiconductor Optical Amplifier
-
Ytterbium Doped Fiber Amplifier
-
Thulium Doped Fiber Amplifier
-
Bismuth Doped Fiber Amplifier
-
Praseodymium Doped Fiber Amplifier
-
Other Rare Earth Fiber Amplifiers
By Network Function
-
Booster Amplifier
-
In-Line Amplifier
-
Pre-Amplifier
-
Gain Block Amplifier
-
Remote Optical Amplifier
By Operating Band
-
O Band
-
C Band
-
L Band
-
C And L Band
-
S Band
-
Multi Band
By Sales Channel
-
Direct Sales
-
Distributor Sales
-
System Integrator Sales
-
Project and Tender Sales
By Application
-
Long Haul Telecommunications
-
Metro Telecommunications
-
Data Center Interconnect
-
Access Networks
-
Cable Television Networks
-
Submarine Communications
-
Industrial and Fiber Sensing
-
Aerospace and Defense
-
Scientific and Research
By End User
-
Network Operators
-
Network Equipment Manufacturers
-
Data Center Operators
-
Government and Defense Organizations
-
Industrial Enterprises
-
Research Institutions
By Region
-
North America: U.S., Canada, Mexico
-
Europe: UK, Germany, France, Italy, Spain, Sweden, Denmark, Finland, Netherlands, Rest of Europe
-
Asia-Pacific: China, India, Japan, South Korea, Taiwan, Indonesia, Vietnam,Australia, Philippines, Malaysia, Rest of APAC
-
Middle East & Africa: Saudi Arabia, UAE, Egypt, Israel, Turkey, Nigeria, South Africa, Rest of MEA
-
Latin America: Brazil, Argentina, Chile, Colombia, Rest of LATAM
Conclusion and Recommendations
What Is the Long-Term Outlook for the Optimal Amplifier Market?
The long-term outlook for the market remains positive, with global revenue projected to grow from USD 5.14 Billion in 2025 to USD 9.79 Billion by 2035 at a 6.65% CAGR. We observed that hyperscale data center buildout, submarine cable expansion, and multi-band capacity upgrades will continue underpinning growth across carrier, data center, and defense customer segments through the forecast period.
What Strategic Positioning Should Optimal Amplifier Vendors Pursue?
Vendors should prioritize photonic integration and compact, high-power gain-stage development while pursuing hyperscale data center design wins to secure long-term revenue growth. Our assessment indicates that providers investing early in semiconductor optical amplifier miniaturization and multi-band systems will be best positioned to capture premium pricing within the Optimal Amplifier Market.
How Attractive Is the Market for New Investment?
The optimal amplifier industry presents an attractive investment case, supported by a USD 4.31 billion absolute dollar opportunity between 2026 and 2035 and above-average growth in Asia-Pacific and data center interconnect categories. We found that investment attractiveness is highest for providers combining manufacturing scale with integration density, positioning them to serve both traditional telecom and emerging hyperscale customer segments simultaneously.
What Market Shifts and Key Risks Should Stakeholders Monitor?
Stakeholders should monitor pricing pressure from vertically integrated component suppliers, specialty pump laser supply constraints, and the high cost of coherent multi-band systems as key risks to the Optimal Amplifier Market. Our analysis shows that vendors unable to adapt to compact module specifications risk losing data center accounts to competitors with integrated, power-efficient designs, particularly within Asia-Pacific's increasingly price-competitive manufacturing environment.
What Are the Key Growth Pathways for the Optimal Amplifier Market?
Key growth pathways include expanding semiconductor optical amplifier portfolios, scaling multi-band and C and L band systems, and deepening penetration into data center operator and defense customer segments. NMSC's analysis indicates that vendors pursuing these pathways while maintaining manufacturing cost competitiveness in standalone and component categories will be best positioned to capture the market's projected growth through 2035.
About the Author

About the Reviewer

At Next Move Strategy Consulting, we understand that insightful market research is the cornerstone of successful business decisions. That's why we employ a robust and multifaceted approach, combining various methodologies to deliver the most accurate and actionable data for our clients.

Research Landscape
We navigate the world of research with two primary approaches:
Qualitative Approach
Our qualitative research methodologies involve immersive techniques such as in-depth interviews, focus groups, and observational studies. By engaging directly with individuals and stakeholders, we uncover valuable insights that quantitative data alone may overlook.

Quantitative Research
In tandem with qualitative methodologies, NMSC leverages the power of Quantitative Research to provide a robust foundation of numerical insights. Through systematic data collection and analysis, we quantify patterns, preferences, and market trends, offering a comprehensive view of the business landscape.
Our quantitative research approach employs diverse tools, including surveys, experiments, and statistical modelling. These methodologies enable us to gather data from a large and representative sample, ensuring the statistical significance of our findings. By employing structured questionnaires and standardized data collection methods, we guarantee the reliability and validity of the information we present to our clients.
Quantitative research is particularly effective in measuring the prevalence of trends, assessing market size, and gauging the impact of various factors on consumer behavior. The numerical precision attained through this approach equips our clients with actionable insights, facilitating data-driven decision-making and strategy formulation.


Our Specialized Toolbox for Industry-Specific Market Research
We deploy a specialized arsenal of techniques tailored to meet your unique requirements. Here's a glimpse into our comprehensive toolbox:

Information Procurement
The stage entails acquiring market data or relevant information through various sources and methodologies.


Market Research Approach
We utilize both top-down and bottom-up approaches in market research analysis to achieve a comprehensive understanding of the market dynamics, leveraging the broad perspective of industry trends and macroeconomic factors alongside detailed insights from specific segments and individual companies.

Porters Five Forces Analysis
We conduct Porter's Five Forces analysis to evaluate the competitive landscape of an industry, providing us with insights into factors that affect profitability and strategic positioning.

SWOT Analysis

Forecasting
We utilize a forecasting model to predict future consumption by considering parameters like population, economics, regulations, market competition, drivers, constraints, technology, and pricing. We also employ statistical techniques such as multilinear regression, exponential smoothing, moving average, ARIMA, and Monte Carlo simulations for accurate predictions. In econometric forecasting, we analyzed short-term and long-term event impacts, attributing values based on regulatory frameworks, economic factors, and market events.





 Speak to Our Analyst