Edge AI Market Global Industry Analysis and Forecast (2026–2035)

Edge AI Market size was USD 28.64 Billion in 2025, projected to reach USD 261.37 Billion by 2035, growing at a CAGR of 23.94% from 2026 to 2035. Key drivers include local inference demand, physical AI and robotics deployment, and falling NPU costs, with Asia-Pacific leading the market.

Download Free Sample PDF
Base Year (2025)
$28.64 Billion
Forecast (2035)
$261.37 Billion
CAGR (2026-2035)
23.9%
Top Region
Asia-Pacific

What Is the Edge AI Market Size?

The global Edge AI Market reached USD 28.64 Billion in 2025 and is estimated at USD 37.88 Billion in 2026. It is forecast to reach USD 261.37 Billion by 2035, growing at a CAGR of 23.94% from 2026 to 2035. Asia-Pacific leads with about a 54.7% share in 2026, and Hardware dominates the offering mix with about 53.6%.

Based on our market evaluation, we identified that every segment across all six axes expands at a CAGR exceeding 21.00% throughout the 2026–2035 forecast period.

Edge AI Market Global Industry Analysis and Forecast (2026–2035) Revenue Forecast

Values in USD Billion

2025 $28.64 Billion
2025
2026 $37.88 Billion
2026
2027 $46.95 Billion
2027
2028 $58.19 Billion
2028
2029 $72.12 Billion
2029
2030 $89.38 Billion
2030
2031 $110.78 Billion
2031
2032 $137.30 Billion
2032
2033 $170.17 Billion
2033
2034 $210.91 Billion
2034
2035 $261.37 Billion
2035

Key Takeaways

By Offering: Hardware held the largest share, expanding from USD 15.52 Billion in 2025 to USD 127.48 Billion by 2035; Software is the fastest-growing at 25.82% CAGR from 2026–2035.

By Data Modality: Visual held the largest share, expanding from USD 8.74 Billion in 2025 to USD 75.04 Billion by 2035; Multimodal is the fastest-growing at 26.10% CAGR from 2026–2035.

By Deployment: On Device held the largest share, expanding from USD 8.18 Billion in 2025 to USD 78.58 Billion by 2035; Hybrid is the fastest-growing at 25.27% CAGR from 2026–2035.

By Buyer Type: Enterprise & Commercial held the largest share, expanding from USD 9.15 Billion in 2025 to USD 90.54 Billion by 2035, and is also the fastest-growing at 24.94% CAGR from 2026–2035.

By End Device: Smartphones held the largest share, expanding from USD 6.84 Billion in 2025 to USD 62.64 Billion by 2035; Automotive Systems is the fastest-growing at 24.45% CAGR from 2026–2035.

By Industry Vertical: Manufacturing held the largest share, expanding from USD 6.32 Billion in 2025 to USD 57.43 Billion by 2035; Healthcare & Life Sciences is the fastest-growing at 24.56% CAGR from 2026–2035.

Dominant Region: Asia-Pacific, at USD 15.66 Billion in 2025 and about 54.7% share of 2026 revenue.

Fastest-Growing Region: North America, at 25.31% CAGR from 2026–2035, expanding from USD 7.00 Billion in 2025 (USD 9.36 Billion in 2026) to USD 71.32 Billion by 2035.

Dominant Country: China, at about USD 9.04 Billion in 2025, roughly 31.6% of global revenue.

Fastest-Growing Country: Mexico, at 26.69% CAGR from 2026–2035, rising from USD 1.14 Billion in 2026 to USD 9.60 Billion by 2035.

The Edge AI Market offers an absolute opportunity of USD 223.49 Billion between 2026 and 2035, rewarding early capital in silicon and software.

According to NMSC analysis, Software grows at 25.82% against 22.64% for Hardware, shifting value toward runtimes and operations tooling.

What does the Edge AI Market Encompass?

The scope covers hardware, software and services that run machine learning inference on or near the device that creates the data. Hardware includes processors, modules, boards and edge systems. Software spans development tools, inference runtimes and fleet operations. Services cover consulting, integration and managed operations. The scope excludes data centre training clusters and cloud-only AI services, so every dollar counted here sits at the device, gateway or edge server tier.

The field has moved from fixed-function vision chips to programmable neural engines that run transformers and small language models locally. Vendors now bundle silicon, compilers and model libraries, which shortens design cycles for device makers. Adoption has also widened beyond cameras and phones into robots, vehicles and industrial controllers, as edge computing budgets increasingly include dedicated inference silicon.

Market Drivers & Dynamics

Interactive Dataset
Rising demand for local inference and low latency driver +3.2% Global, led by Asia-Pacific 2026–2031
Physical AI and robotics deployment driver +2.8% North America, Asia-Pacific 2026–2035
Compact generative models running on devices driver +2.6% Global 2026–2033
Falling NPU cost and SoC integration driver +2.4% Global 2026–2030
Power, thermal and memory limits at the edge restraint −1.8% Global 2026–2030
Fragmented toolchains and hardware diversity restraint −1.5% Global 2026–2031
Security exposure of distributed device fleets restraint −1.2% Europe, North America 2026–2032
Export controls and component supply constraints restraint −1.0% Asia-Pacific, North America 2026–2029
Source: Next Move Strategy Consulting

Growth Drivers

What Is the Primary Growth Driver in the Edge AI Industry?

Latency and energy cost make local inference the primary driver of the Edge AI Market. The IEA estimates that data centre electricity demand will rise from about 415 TWh in 2024 to around 945 TWh by 2030, which pushes operators to place routine inference near the data source. Privacy rules and unreliable connectivity add further pull. Camera makers, manufacturers and automotive suppliers therefore specify NPUs in new designs, supporting the 23.94% CAGR in this report.

How Is Robotics and Physical AI Demand Driving Market Growth?

The IFR reports 542,000 industrial robots installed in 2024, with Asia taking 74% of new deployments. Each machine needs local perception and control, so robot growth converts directly into demand for edge modules, vision processors, and runtime software. In our model, Robots and Drones together grow from USD 7.23 Billion in 2025 to USD 68.47 Billion by 2035, which confirms autonomy as a lead growth engine.

Growth Inhibitors

What Is Restraining the Edge AI Market?

Power, memory, and toolchain fragmentation restrain adoption. Synaptics notes that its new SR200 microcontrollers pair up to 8 MB of SRAM with custom DRAM that scales to hundreds of megabytes, which shows how memory capacity caps model size at the edge. Each vendor also ships its own compiler and runtime, so developers rebuild and retest models for every chip. These costs slow pilots and delay volume programs, especially for smaller device makers.

What Are the Growth Opportunities?

Can Hybrid Deployment Capture the Shift from Pilots to Fleets?

Hybrid deployment is the fastest-growing deployment mode in the Edge AI Market at 25.27%, rising from USD 6.10 Billion in 2025 to USD 62.03 Billion by 2035. Enterprises with thousands of devices need one control plane that splits work between device, gateway, and cloud. Providers of fleet orchestration and model registry tools, together with system integrators, capture the margin as customers consolidate vendors.

Does Multimodal Sensing Create a Premium Software Layer?

Multimodal workloads grow at 26.10%, the fastest-growing data modality in the Edge AI Market, expanding from USD 10.65 Billion in 2026 to USD 85.82 Billion by 2035. Devices that fuse camera, microphone, and text inputs need larger models and tighter memory management. Compiler, optimiser, and model library vendors earn a premium because they decide whether such models fit on a given chip, which favours Software suppliers.

Is Healthcare the Next Large Vertical for Local Inference?

Healthcare & Life Sciences grows at 24.56%, from USD 3.06 Billion in 2026 to USD 22.11 Billion by 2035. Imaging systems, monitors, and wearables process patient data locally to protect privacy and shorten response times. Medical device makers that embed certified inference engines gain a defensible position, while module suppliers benefit from long product lifecycles and repeat design wins.

Segmentation Analysis

2025 (USD Billion)
2035 (USD Billion)
Hardware 2025: $15.52 Billion | 2035: $127.48 Billion
Hardware
Software 2025: $9.68 Billion | 2035: $102.81 Billion
Software
Services 2025: $3.45 Billion | 2035: $31.08 Billion
Services
Hardware $15.52 Billion $127.48 Billion 22.64
Software $9.68 Billion $102.81 Billion 25.82
Services $3.45 Billion $31.08 Billion 23.77

Which Offering Segment Leads the Edge AI Market?

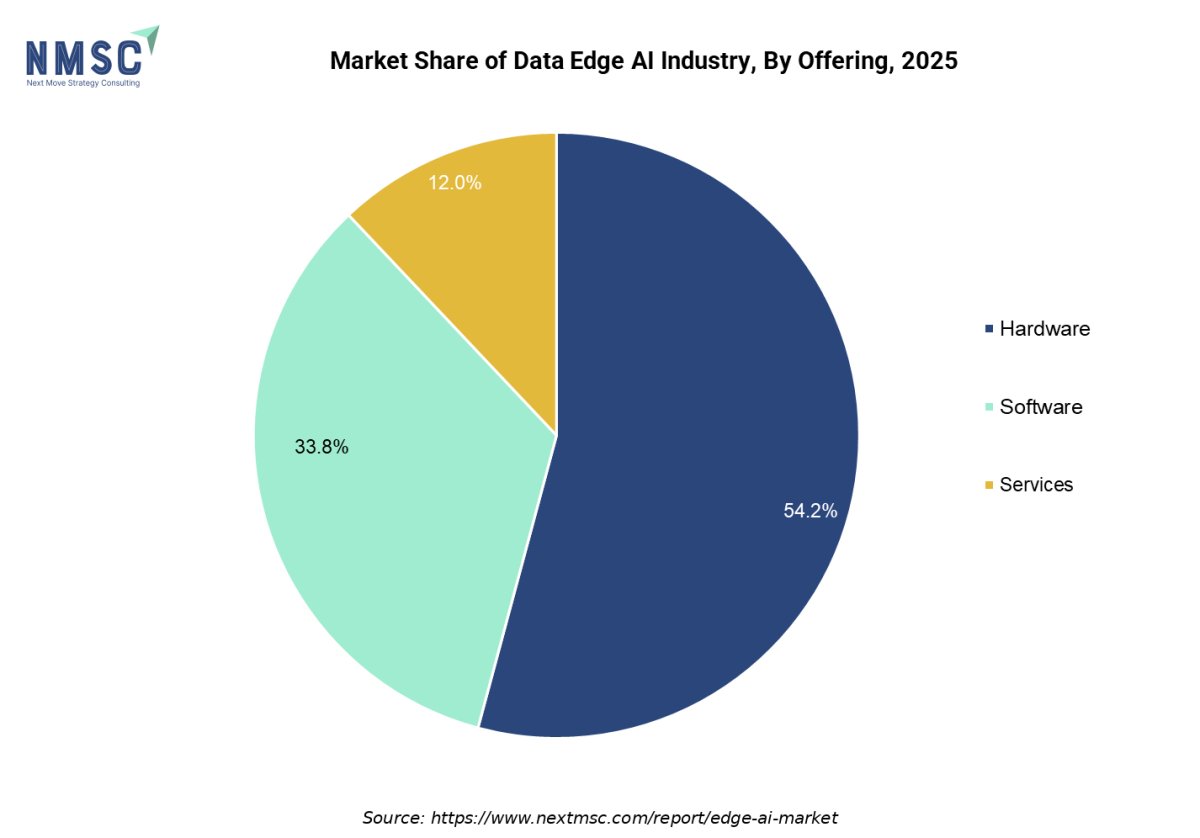
Hardware leads the offering mix with USD 15.52 Billion in 2025, rising to USD 127.48 Billion by 2035, because every deployment starts with processors, modules, and edge systems. Software grows faster at 25.82% as runtimes, compilers, and fleet tools become the differentiator once silicon is commoditised. Services expand at 23.77% as integrators help enterprises move from pilots to production. NVIDIA, Qualcomm and AMD now bundle software with silicon to capture this shift.

2025 (USD Billion)
2035 (USD Billion)
Visual
Audio
Text
Multimodal
Other modali
Segment Item 2025 (USD Billion) 2035 (USD Billion) CAGR
Visual $10.0 USD Billion $40.0 USD Billion 25.0%
Audio $17.1 USD Billion $51.1 USD Billion 11.0%
Text $24.2 USD Billion $62.2 USD Billion 25.0%
Multimodal $31.3 USD Billion $73.3 USD Billion 11.0%
Other modality $38.4 USD Billion $84.4 USD Billion 16.0%

Segment-wise data is locked

Unlock complete segment-wise numbers for By Data Modality.

Unlock Full Data
2025 (USD Billion)
2035 (USD Billion)
On device
Gateway
Edge server
Hybrid
Segment Item 2025 (USD Billion) 2035 (USD Billion) CAGR
On device $10.0 USD Billion $40.0 USD Billion 27.0%
Gateway $17.1 USD Billion $51.1 USD Billion 9.0%
Edge server $24.2 USD Billion $62.2 USD Billion 19.0%
Hybrid $31.3 USD Billion $73.3 USD Billion 17.0%

Segment-wise data is locked

Unlock complete segment-wise numbers for By Deployment.

Unlock Full Data
2025 (USD Billion)
2035 (USD Billion)
Device & equ
System integ
Enterprise &
Government a
Other instit
Segment Item 2025 (USD Billion) 2035 (USD Billion) CAGR
Device & equipment manufacturers $10.0 USD Billion $40.0 USD Billion 14.0%
System integrators & tier suppliers $17.1 USD Billion $51.1 USD Billion 24.0%
Enterprise & commercial $24.2 USD Billion $62.2 USD Billion 22.0%
Government agencies $31.3 USD Billion $73.3 USD Billion 12.0%
Other institutional buyers $38.4 USD Billion $84.4 USD Billion 27.0%

Segment-wise data is locked

Unlock complete segment-wise numbers for By Buyer Type.

Unlock Full Data
2025 (USD Billion)
2035 (USD Billion)
Smartphones
Surveillance
Wearable dev
Smart home a
Automotive s
Segment Item 2025 (USD Billion) 2035 (USD Billion) CAGR
Smartphones $10.0 USD Billion $40.0 USD Billion 24.0%
Surveillance camera $17.1 USD Billion $51.1 USD Billion 22.0%
Wearable devices $24.2 USD Billion $62.2 USD Billion 20.0%
Smart home and consumer devices $31.3 USD Billion $73.3 USD Billion 22.0%
Automotive systems $38.4 USD Billion $84.4 USD Billion 13.0%

Segment-wise data is locked

Unlock complete segment-wise numbers for By End Device.

Unlock Full Data
2025 (USD Billion)
2035 (USD Billion)
Manufacturin
Energy & uti
Automotive a
Consumer ele
Healthcare &
Segment Item 2025 (USD Billion) 2035 (USD Billion) CAGR
Manufacturing $10.0 USD Billion $40.0 USD Billion 23.0%
Energy & utilities $17.1 USD Billion $51.1 USD Billion 9.0%
Automotive and transportation $24.2 USD Billion $62.2 USD Billion 19.0%
Consumer electronics & smart home $31.3 USD Billion $73.3 USD Billion 13.0%
Healthcare & life sciences $38.4 USD Billion $84.4 USD Billion 10.0%

Segment-wise data is locked

Unlock complete segment-wise numbers for By Industry Vertical.

Unlock Full Data

Growth Opportunities

Our findings suggest that three whitespace areas can generate outsized returns through 2035.

Can Hybrid Deployment Capture the Shift from Pilots to Fleets?

Hybrid deployment is the fastest-growing deployment mode in the Edge AI Market at 25.27%, rising from USD 6.10 Billion in 2025 to USD 62.03 Billion by 2035. Enterprises with thousands of devices need one control plane that splits work between device, gateway, and cloud. Providers of fleet orchestration and model registry tools, together with system integrators, capture the margin as customers consolidate vendors.

Does Multimodal Sensing Create a Premium Software Layer?

Multimodal workloads grow at 26.10%, the fastest-growing data modality in the Edge AI Market, expanding from USD 10.65 Billion in 2026 to USD 85.82 Billion by 2035. Devices that fuse camera, microphone, and text inputs need larger models and tighter memory management. Compiler, optimiser, and model library vendors earn a premium because they decide whether such models fit on a given chip, which favours Software suppliers.

Is Healthcare the Next Large Vertical for Local Inference?

Healthcare & Life Sciences grows at 24.56%, from USD 3.06 Billion in 2026 to USD 22.11 Billion by 2035. Imaging systems, monitors, and wearables process patient data locally to protect privacy and shorten response times. Medical device makers that embed certified inference engines gain a defensible position, while module suppliers benefit from long product lifecycles and repeat design wins.

Regional Outlook

2025 (USD Billion)
2035 (USD Billion)
North Americ
Europe
Asia-Pacific
Middle East
Latin Americ
Region 2025 (USD Billion) 2035 (USD Billion) CAGR (%)
North America $10.0 USD Billion $40.0 USD Billion 9.0%
Europe $17.1 USD Billion $51.1 USD Billion 27.0%
Asia-Pacific $24.2 USD Billion $62.2 USD Billion 25.0%
Middle East & Africa $31.3 USD Billion $73.3 USD Billion 23.0%
Latin America $38.4 USD Billion $84.4 USD Billion 12.0%

Regional data is locked

Unlock complete regional numbers for this market.

Unlock Full Data

Regulatory Framework Impacting the Edge AI Industry

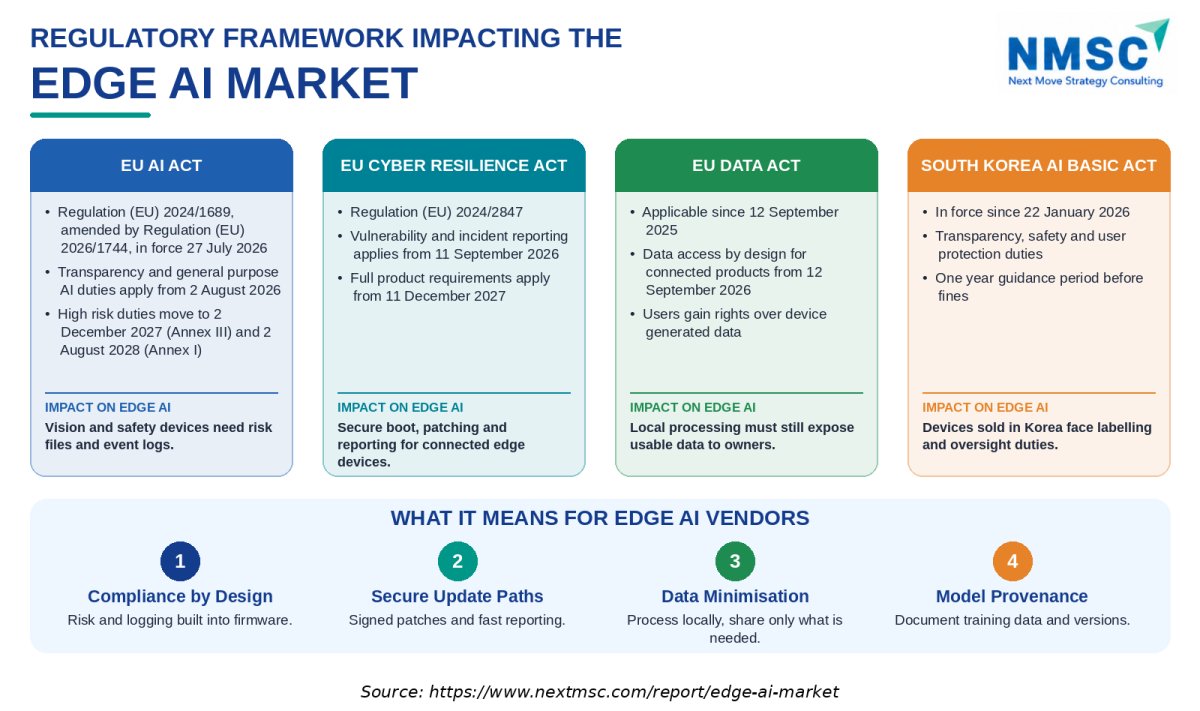
The above infographic summarises four rule sets that shape product design for the Edge AI Market. The EU AI Act now phases in high-risk duties on 2 December 2027 and 2 August 2028, after Regulation (EU) 2026/1744 entered into force on 27 July 2026. Cyber Resilience Act reporting began on 11 September 2026. The Data Act has applied since 12 September 2025, and South Korea enforced its AI Basic Act from 22 January 2026. Vendors that build logging, secure updates, and data access into firmware will carry lower compliance costs.

Competitive Landscape

NMSC's analysis indicates that competition is layered, with silicon leaders, embedded incumbents and software platforms each defending a different part of the stack.

Dimension Description
Market Structure Layered and partly consolidated, with a few silicon leaders and many specialist module and software vendors.
Innovation Focus NPU performance per watt, on-chip memory, open compilers, and local generative models.
M&A Activity High, led by chipmakers that buy accelerator companies and developer communities.

How Do Companies Compete in the Edge AI Market?

Vendors compete on performance per watt, memory capacity, software support, and price per TOPS. Full stack leaders such as NVIDIA and Qualcomm bundle silicon, tools, and reference designs, while embedded incumbents win on lifecycle support and automotive-grade parts. Geographic expansion follows device volumes in Asia-Pacific and North America. Pricing is tiered, with premium modules for robots and volume-priced microcontrollers for sensors, so share shifts when a vendor wins a platform.

Which Competitive Archetypes Dominate the Edge AI Industry?

Five archetypes stand out. Full stack platform leaders, including NVIDIA and Qualcomm, differentiate through software depth. Embedded incumbents such as NXP, STMicroelectronics, Renesas, Texas Instruments, and Infineon differentiate through lifecycle and safety credentials. Licensors such as Arm and Google differentiate through open ecosystems. Client silicon groups, including Intel, AMD, MediaTek and Samsung, extend PC and phone designs. Sensor specialists such as Sony, TDK and Synaptics embed intelligence at the point of capture.

What Innovation and Differentiation Strategies Are Companies Using?

Innovation focuses on larger on-chip memory, lower-power NPUs, and open compilers that reduce porting effort. Google Research released its Coral NPU design for license-free use, and Synaptics adopted it in the Astra SR200 line. Qualcomm and AMD raise TOPS per watt in embedded parts. Early neuromorphic designs target always-on sensing. Differentiation increasingly rests on tooling that lets developers deploy one model across several chips.

What M&A and Partnership Activity Is Shaping the Market?

Large chipmakers are buying accelerator and developer assets. Microchip closed its Hailo purchase in September 2026, NXP closed Kinara in October 2025, and Qualcomm announced Arduino that month. Partnerships extend reach, such as Synaptics working with Google Research on Coralboard and NVIDIA pairing Jetson Thor with Unitree and Sharpa hardware. Our view is that further tuck-in deals for compilers and vision software are likely as buyers seek complete platforms.

Key Market Players

We found that the supplier base spans 20 companies across processors, modules, software, and platforms.

Qualcomm Incorporated Intel Corporation Advanced Micro Devices, Inc. Samsung Electronics Co., Ltd. Huawei Technologies Co., Ltd. MediaTek Inc. STMicroelectronics N.V. NXP Semiconductors N.V. Texas Instruments Incorporated Renesas Electronics Corporation Infineon Technologies AG Analog Devices, Inc. Microchip Technology Incorporated Arm Limited Google LLC Microsoft Corporation Sony Semiconductor Solutions Corporation TDK Corporation Synaptics Incorporated

Latest Developments

We observed that launches and acquisitions since late 2025 centre on NPUs, developer ecosystems and robotics platforms.

Date Event
October 2026 Synaptics launched the Astra SR200 edge AI microcontroller family with Google Research Coral NPU technology and opened general availability of the Coralboard SL developer kit.
September 2026 Microchip Technology completed its acquisition of Hailo, adding edge AI accelerators and vision processors to its embedded portfolio.
June 2026 NVIDIA announced the Isaac GR00T Reference Humanoid Robot, an open design built on Jetson Thor with Unitree and Sharpa hardware.
January 2026 AMD introduced Ryzen AI Embedded P100 and X100 processors with up to 50 AI TOPS for automotive, industrial and robotics systems.
January 2026 Qualcomm launched Dragonwing Q-8750 and Q-7790 processors for drones, smart cameras and AI televisions, rated at up to 77 and 24 TOPS.

Expert Insights

Said Ouissal

Said Ouissal

Founder and CEO | ZEDEDA

"Edge AI has officially crossed the threshold from experimentation to essential infrastructure."

Analyst Interpretation

Our analysis shows that the transition of Edge AI from experimental applications to essential enterprise infrastructure highlights its growing commercial acceptance across industries. Businesses are increasingly deploying AI capabilities closer to data-generation points to support real-time decision-making, operational efficiency, and autonomous processes. This transition is expected to increase demand for edge computing hardware, AI accelerators, edge servers, and AI orchestration software.

Investment Opportunities

Where Are Capital Inflows Concentrating in the Edge AI Market?

Strategic buyers are the main source of capital. Microchip, NXP, and Qualcomm each acquired accelerator or developer assets during 2025 and 2026, which signals that incumbents prefer buying scarce AI teams over building them. Software and Services, valued at USD 17.57 Billion in 2026, attract investors seeking recurring revenue, while Hardware remains the larger pool at USD 20.31 Billion. Capital also flows toward modules for robots and vehicles.

How Is Infrastructure Investment Shaping Market Capacity?

Infrastructure spending is shifting from central clusters to distributed nodes. The IEA projects data centre demand near 945 TWh by 2030, which raises the value of gateways and edge servers that absorb routine inference. Investment also targets device management, secure update channels and model registries so that fleets stay patched under new cyber rules. Edge Server deployments, at USD 9.77 Billion in 2026, benefit directly from this build-out.

What ESG Considerations Are Influencing Market Investment?

Energy efficiency is the central ESG lens. Local inference reduces data movement, and chips with configurable power ranges, such as the 40-to-130-watt envelope of Jetson AGX Thor, let designers match compute to task. Privacy by design supports social goals, because sensitive images and voice data can remain on the device. Investors also review product longevity and repairability, since long lifecycle parts reduce electronic waste.

Key Benefits for Stakeholders

How Does This Report Benefit Industry Leaders and Device Manufacturers?

Leaders gain a segment-level view of where demand sits, from Smartphones at USD 9.05 Billion in 2026 to Drones at USD 4.88 Billion. The forecasts help them choose between on-device, gateway, and hybrid architectures. Regional and country analysis supports sourcing and launch timing, and the regulatory overview helps teams plan logging and update features before obligations apply in 2027 and 2028.

How Does This Report Benefit Investors and Financial Analysts?

Investors receive reconciled Edge AI Market figures for 2025, 2026, and 2035, with CAGRs calculated on one basis. The report shows that Software and Multimodal workloads grow faster than the market at 25.82% and 26.10%. Regional detail highlights North America at 25.31% and Asia-Pacific as the largest base. The competitive and deal review identifies acquirers, targets, and consolidation themes worth monitoring.

How Does This Report Benefit Technology Vendors and Product Teams?

Vendors can benchmark their position against 20 profiled companies and see which archetypes gain share. Product teams learn where memory, power, and toolchain gaps hold back adoption. The analysis of IoT device management and fleet tools points to features that enterprise buyers now request, while the vertical view shows which applications justify premium pricing.

Key Market Segments Evaluated

By Offering

  • Hardware 
    • Processing hardware
      • CPU & microprocessor
      • Graphics processing unit (GPU)
      • Neural processing unit (NPU)
      • Vision processing unit (VPU)
      • Digital signal processor (DSP)
      • Field programmable gate array (FPGA)
      • Application specific integrated circuit (ASIC)
      • SoC with integrated AI
      • Other processor
    • Module & board
      • System on module (SoM)
      • Accelerator module
      • Single board computer (SBC)
      • Carrier board
      • Other module
    • Edge computing systems
      • Development kit
      • Edge AI appliance
      • Edge server
      • Edge gateway
      • Other system
  • Software 
    • Development software
      • SDK & framework
      • Compiler & optimizer
      • Model zoo
      • AutoML platform
      • Other development tools
    • Inference & runtime software
      • Inference engine
      • Edge AI platform
      • Container runtime
      • Other runtime softwares
    • Operations & MLOps
      • Device management
      • Fleet orchestration
      • Model registry
      • Observability & monitoring
      • Other operations tools
  • Services 
    • Consulting & advisory
    • System integration & deployment
    • Managed service

By Data Modality

  • Visual
  • Audio
  • Text
  • Multimodal
  • Other modality

By Deployment

  • On device
  • Gateway
  • Edge server
  • Hybrid

By Buyer Type

  • Device & equipment manufacturers
  • System integrators & tier suppliers
  • Enterprise & commercial
  • Government agencies
  • Other institutional buyers

By End Device

  • Smartphones
  • Surveillance camera
  • Wearable devices
  • Smart home and consumer devices
  • Automotive systems
  • Robots
  • Drones
  • Other edge devices

By Industry Vertical

  • Manufacturing
  • Energy & utilities
  • Automotive and transportation
  • Consumer electronics & smart home
  • Healthcare & life sciences
  • Retail & e-commerce
  • Telecommunications
  • Government & public sector
  • Agriculture
  • Other verticals

By Region

  • North America 
    • U.S.
    • Canada
    • Mexico.
  • Europe 
    • UK
    • Germany
    • France
    • Italy
    • Spain
    • Sweden
    • Denmark
    • Finland
    • Netherlands
    • Rest of Europe.
  • Asia-Pacific 
    • China
    • India
    • Japan
    • South Korea
    • Taiwan
    • Indonesia
    • Vietnam
    • Australia
    • Philippines
    • Malaysia
    • Rest of APAC.
  • Middle East & Africa 
    • Saudi Arabia
    • UAE
    • Egypt
    • Israel
    • Turkey
    • Nigeria
    • South Africa
    • Rest of MEA.
  • Latin America 
    • Brazil
    • Argentina
    • Chile
    • Colombia
    • Rest of LATAM.

Conclusion & Recommendations

The Edge AI Market expands from USD 37.88 Billion in 2026 to USD 261.37 Billion by 2035, a CAGR of 23.94%. Growth stays broad because no axis in our model grows below 21% a year. Asia-Pacific remains the largest base, while North America gains share at the fastest pace. We expect hardware to stay larger, but software and services to narrow the gap as fleets scale.

What Strategic Positioning Recommendations Does NMSC Offer?

In the Edge AI Market, chipmakers should pair every NPU with open compilers, model libraries, and reference designs. Device makers should adopt hybrid architectures that let them move workloads as models change. Integrators should build fleet operations and security services around the new EU reporting duties. Newer entrants should target multimodal and healthcare niches, where specialised software can earn premium pricing against larger platform vendors.

What Is the Investment Attractiveness of the Edge AI Market?

Attractiveness is high because demand is structural and broad. The absolute opportunity between 2026 and 2035 equals USD 223.49 Billion. Software, at 25.82%, offers the strongest growth, while Hardware offers scale. Acquirers have already paid for accelerators and developer communities, so valuations in the private market are rising. Investors should favour firms with recurring software revenue and design wins in robots, vehicles, and healthcare devices.

What Are the Market Shifts and Key Risks for the Edge AI Market?

Three shifts matter: local generative models, physical AI platforms and vendor consolidation. Key risks include power and memory limits, fragmented toolchains, device security exposure, and export controls on advanced chips. Combined, the restraints in our matrix weigh about 5.5 percentage points on annual growth. Middle East & Africa, at 16.62%, also shows how infrastructure gaps and import dependence can slow regional adoption.

What Are the Primary Growth Pathways Through 2035?

Four pathways stand out. Hybrid deployment, growing at 25.27%, turns pilots into fleets. Multimodal workloads, at 26.10%, create a premium software layer. Automotive Systems, at 24.45%, bring inference into every new vehicle. Healthcare & Life Sciences, at 24.56%, opens a regulated but high-value vertical. Vendors that align product roadmaps with these four pathways will capture a disproportionate share of new revenue.

Delivered Customizations

We have successfully delivered the following deep-dive customizations:

Client Request Customization Delivered Value Adds
Historical Edge AI Market Growth Analysis
  • Historical edge AI revenue analysis by offering (hardware, software, services) and end device, with shipment trends where publicly available.
  • Identifies the fastest-growing offerings and device categories to prioritize product and investment focus.
Company-Level Edge AI Revenue Split
  • Company-level revenue split attributable to edge AI chips, software, and services, using disclosed segment data.
  • Benchmarks how leading vendors monetize edge AI, supporting competitive positioning and partnership decisions.
Edge AI Opportunity Sizing by Vertical
  • TAM, SAM, and served-available market sizing by industry vertical and deployment model.
  • Shows which vertical and deployment segments offer the largest addressable and obtainable revenue pools.
Data Modality and Device Workload Adoption Mapping
  • Mapping of edge AI adoption by data modality (vision, audio, sensor, text) across end devices such as cameras, robots, vehicles, and wearables.
  • Pinpoints which modality and device pairings are ready for scaled deployment, guiding R&D and product roadmaps.
Deployment Architecture Cost-Performance Benchmarking
  • Comparison of on-device, gateway, and near-edge deployment options by latency, power, and total cost of ownership.
  • Guides deployment architecture choices and pricing strategy for each buyer and use case.
Buyer-Type Adoption Pathway by Industry Vertical
  • Assessment of adoption pathways for OEMs, enterprises, and public-sector buyers across key industry verticals.
  • Shows which buyer types to target first in each vertical and how to tailor go-to-market and channel strategy.

FAQs

Sources & References

1.

NVIDIA Corporation, Press release: NVIDIA Isaac GR00T Reference Humanoid Robot (June 2026)

investor.nvidia.com
2.

Microchip Technology Inc., Press release: Definitive agreement to acquire Hailo (July 2026)

ir.microchip.com
3.

Microchip Technology Inc., Press release: Completion of Hailo acquisition (September 2026)

ir.microchip.com
4.

Advanced Micro Devices, Inc., Press release: Ryzen AI Embedded processor portfolio (January 2026)

amd.com
5.

Qualcomm Incorporated, Dragonwing Q-7790 product page and IoT portfolio (January 2026)

qualcomm.com
6.

Qualcomm Incorporated, Internet of Things portfolio including Arduino announcement (October 2025)

qualcomm.com/internet-of-things
7.

NXP Semiconductors N.V., Press release: Completion of Aviva Links and Kinara acquisitions (October 2025)

nxp.com
8.

Synaptics Incorporated, Press releases: Astra SR200 and Coralboard (October 2026)

synaptics.com
9.

International Energy Agency, Energy and AI (April 2025)

iea.org
10.

International Federation of Robotics, World Robotics 2025 press release (September 2025)

ifr.org
11.

European Commission, Cyber Resilience Act reporting obligations (2026)

digital-strategy.ec.europa.eu
12.

National Cyber Security Centre Ireland, EU Cyber Resilience Act guidance (July 2026)

ncsc.gov.ie/cra
13.

Cloud Security Alliance, Research note on Regulation (EU) 2026/1744 Digital Omnibus on AI (2026)

labs.cloudsecurityalliance.org
14.

U.S. International Trade Administration, South Korea AI Basic Act (2026)

trade.gov
15.

NextMSC, Edge AI Market model: market size, segment and regional figures (2026)

nextmsc.com

About the Author

Mayurima Roy

Mayurima Roy

Mayurima Roy is Research Analyst at Next Move Strategy Consulting, where she has spent 4 years working across the firm's full industry coverage rather than a single fixed vertical. Her work centers on structured research, ongoing trend tracking, competitive assessment, and insight-led content development, translating complex market data into clear, decision-ready narratives that support informed client decision-making across diverse global industries, market sectors, and world regions every day.

About the Reviewer

Supradip Baul

Supradip Baul

Supradip Baul is an accomplished business consultant and strategist with over a decade of rich experience in market intelligence, strategy, technology, and business transformation. His work has included rigorous qualitative and quantitative analysis across multiple industries, helping clients shape investment decisions and long-term roadmaps. Earlier in his career, he was associated with Gartner, where he contributed to industry-leading reports and market share analyses. He has worked with leading global companies and holds an MBA with a dual specialization in Marketing and Finance.

Download Free Sample

Mohit Agarwal

MOHIT AGARWAL

Chief Manager

DryChem India Pvt. Ltd.

Next Move Strategy Consulting is an amazing team of consultants. We required a market study report for our investors on top priority and the team went above and beyond our expectations to deliver the same with ample supporting data within a short time span enabling us to secure the investments and keep our project timeline maintained. Their professionalism, attention to detail, and timely delivery of actionable recommendations have left a lasting impression on our organization.

Gustaf Hummel Burstrom

GUSTAF HUMMEL BURSTROM

Founder

Revline Tools AB

Joseph and the team at Next Move Strategy Consulting have been excellent to work with, in supplying us with relevant market data and forecasts for our specific category. We had some special requirements and they were able to do a custom package to suit our needs. We would definitely recommend them to any other company needing market data and forecasts

Ross J Mckenzie

ROSS J MCKENZIE

Business Insight Manager

Staysure Group

“Next MSC have been incredibly helpful in providing detailed & robust information on our market, alongside quantifying growth by different segments. The process to procure was simple and easy, with sample reports and regular contact to ensure we had what we needed. Succinct detail on their sources & methodologies is also greatly received, allowing transparency in this respect helps build trust in the detail you pay for. Joseph in particular was fantastic, and helped ensure efficient provision of the insight pack – thank you NMSC!”.

Pratyush Kumar Das

PRATYUSH KUMAR DAS

Assistant Manager

Polycab India Limited

We would like to express our appreciation for the data and insights provided by nextmsc. We are very pleased with the quality and depth of the information, which has proven to be highly valuable and beneficial for our business decision-making.

Robert Sean Trevino

ROBERT SEAN TREVINO

Sr. Director, Head of Strategic Insights & Analytics

Foundation Medicine

I realized that it was a reliable source of information. These days, there are many people who are looking for authentic data, and this is one of the only sources that can offer them with what they need;

Custom Market Research Services

We will customize the research for you if the listed report does not fully match your requirements.

Get 30% Free Customization

Select License

This website uses cookies to ensure you get the best experience on our website. Learn more

✖