Environmental Liability Insurance Market Global Industry Analysis and Forecast (2026-2035)

Environmental Liability Insurance Market size was USD 5.9 billion in 2026, projected to reach USD 10.2 billion by 2035, growing at a CAGR of 6.4% from 2026 to 2035. Key drivers include stricter environmental cleanup regulations, rising brownfield redevelopment activity, and growing PFAS-related litigation and contamination claims, with North America leading the market.

Download Free Sample PDF
Base Year (2025)
$5.50 Billion
Forecast (2035)
$10.20 Billion
CAGR (2026-2035)
6.4%
Top Region
North America

What Is the Environmental Liability Insurance Market Size?

The global environmental liability insurance market size was valued at USD 5.5 billion in 2025 and is estimated at USD 5.9 billion in 2026, forecast to reach USD 10.2 billion by 2035, expanding at a 6.4% CAGR between 2026 and 2035. North America leads with approximately 46% share, while Site Pollution Liability dominates all other coverage types with approximately 38% share.

We observed that the growth is broad-based across every segmentation axis, with contractors pollution liability adoption and small and medium enterprise uptake driving the dominant structural shifts through 2035.

Environmental Liability Insurance Market Global Industry Analysis and Forecast (2026-2035) Revenue Forecast

Values in USD Billion

2025 $5.50 Billion
2025
2026 $5.85 Billion
2026
2027 $6.23 Billion
2027
2028 $6.63 Billion
2028
2029 $7.05 Billion
2029
2030 $7.50 Billion
2030
2031 $7.98 Billion
2031
2032 $8.49 Billion
2032
2033 $9.03 Billion
2033
2034 $9.61 Billion
2034
2035 $10.20 Billion
2035

Key Takeaways

By Coverage Type: Site Pollution Liability held the largest share of approximately 38% (USD 2.09 billion) in 2025; Environmental Professional Liability is the fastest-growing sub-segment at 11.2% CAGR from 2026-2035.

By End User Industry: Manufacturing held the largest share of approximately 24% (USD 1.32 billion) in 2025; Mining is the fastest-growing sub-segment at 8.1% CAGR from 2026-2035.

By Enterprise Size: Large Enterprises held the largest share of approximately 63% (USD 3.47 billion) in 2025; Small and Medium Enterprises is the fastest-growing sub-segment at 7.8% CAGR from 2026-2035.

Dominant Region: North America dominated with approximately 46% revenue share (USD 2.53 billion) in 2025.

Fastest-Growing Region: Asia-Pacific is expected to register the highest CAGR of 10.1% during 2026-2035.

Dominant Country: U.S. led with approximately USD 1.97 billion in 2025.

Fastest-Growing Country: India is the fastest-growing country at approximately 15.2% CAGR from 2026-2035.

Market Opportunity: The environmental liability insurance market is expected to create an absolute dollar opportunity of USD 4.3 billion between 2026 and 2035, presenting significant investment potential across the specialty pollution liability and contractors coverage value chain.

According to Next Move Strategy Consulting analysis, carriers are increasingly bundling contractors pollution liability with professional liability into combined package policies to simplify placement for brokers, a shift that favors specialty underwriters with broad-form policy capability over single-line pollution insurers as buyers seek consolidated risk transfer through 2035.

What Does the Environmental Liability Insurance Market Encompass?

The market encompasses specialty insurance products that protect businesses against third-party bodily injury, property damage, and cleanup costs arising from pollution conditions and environmental incidents. Our assessment indicates that the scope spans site pollution liability, contractors pollution liability, products pollution liability, storage tank liability, and environmental professional liability policies distributed to manufacturing, oil and gas, construction, waste management, and real estate buyers of varying enterprise size. The category has evolved from a niche coverage for high-hazard industrial sites into a mainstream risk-transfer tool for contractors and property owners, closely intersecting with the broader property & casualty insurance TPA claims administration ecosystem worldwide.
Regulatory frameworks such as the U.S. Environmental Protection Agency's cleanup liability standards and the European Union's Environmental Liability Directive shape underwriting requirements, while state-level brownfield redevelopment incentives increasingly influence policy demand. We observed that technology adoption is shifting toward AI-assisted underwriting tools that compress quote turnaround for standard contractor risks. Next Move Strategy Consulting's analysis indicates that this structural shift, combined with rising remediation cost inflation, is redefining sourcing criteria across the market.

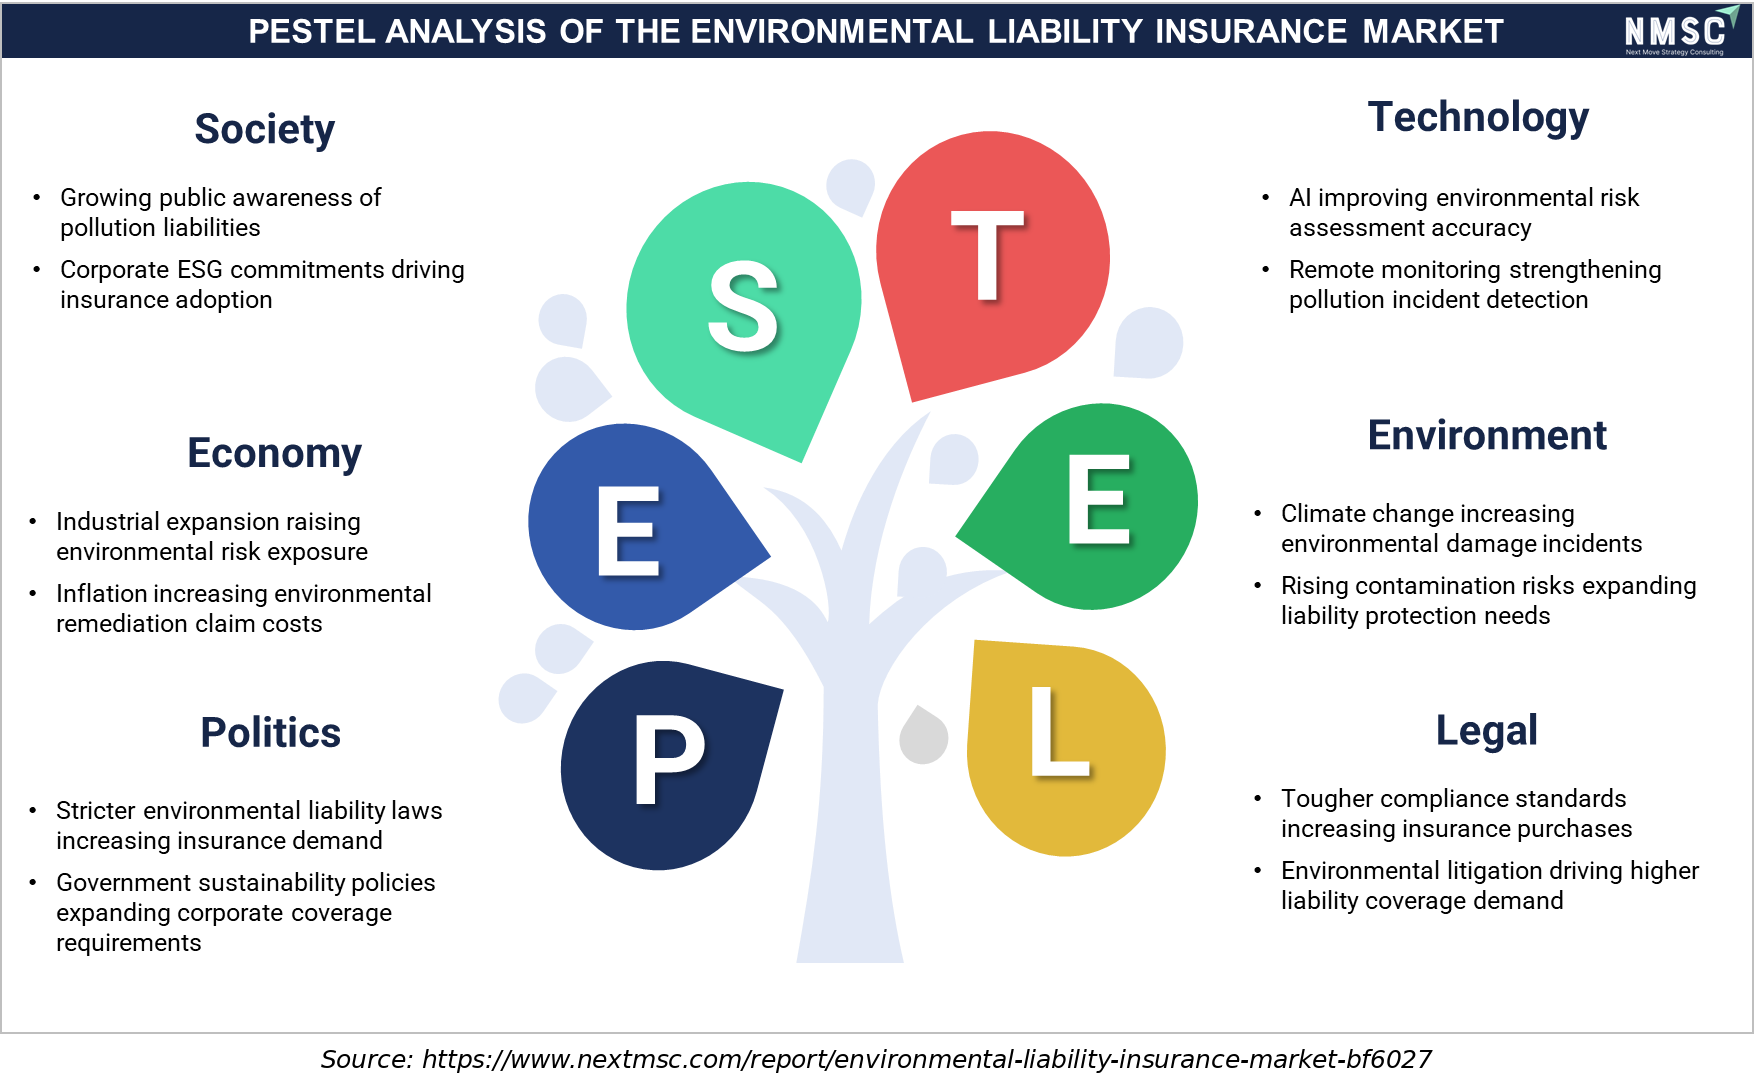
PESTEL ANALYSIS OF THE ENVIRONMENTAL LIABILITY INSURANCE MARKET

PESTEL ANALYSIS OF THE ENVIRONMENTAL LIABILITY INSURANCE MARKET
The PESTEL analysis highlights the key external factors influencing the environmental liability insurance market. Political and legal regulations drive mandatory environmental compliance, while economic growth and industrial expansion increase insurance demand. Rising environmental concerns and public awareness encourage broader risk protection, and technological advancements improve environmental risk assessment, monitoring, and claims management. Together, these factors shape underwriting strategies, product innovation, market growth, and insurers' ability to address evolving pollution and climate-related liabilities.

Market Drivers & Dynamics

Interactive Dataset
Stricter EPA and national environmental cleanup regulations driver +1.8% Global 2026-2035
Rising brownfield redevelopment activity driver +1.4% North America, Europe 2026-2035
Growing PFAS-related litigation and contamination claims driver +1.2% North America 2026-2032
Increased infrastructure and construction spending driver +1.1% Asia-Pacific, MEA 2026-2035
Expanding ESG disclosure requirements for corporates driver +0.9% Europe, North America 2026-2035
AI-assisted underwriting reducing placement friction driver +0.6% Global 2026-2032
Soft market pricing pressure in contractors pollution liability restraint -0.9% North America 2026-2030
Limited underwriting capacity for legacy contamination sites restraint -0.7% Global 2026-2035
Broker and buyer awareness gaps in emerging markets restraint -0.5% Asia-Pacific, LATAM 2026-2032
Source: Next Move Strategy Consulting

Growth Drivers

What Is the Primary Growth Driver of the Environmental Liability Insurance Market?

Stricter environmental cleanup regulations are the primary driver of the market. The U.S. Environmental Protection Agency continues to enforce cleanup liability standards under federal contamination statutes, sustaining commercial demand for pollution liability coverage among industrial and contractor buyers. We observed that this regulatory pressure, reinforced by rising brownfield redevelopment incentives, continues to anchor baseline consumption of site pollution and contractors pollution liability policies across developed and emerging economies alike.

How Is Brownfield Redevelopment Driving Market Growth?

Rising brownfield redevelopment activity is accelerating market growth toward site pollution liability and environmental professional liability coverage. The U.S. Environmental Protection Agency continues to track expanding brownfield grant funding supporting contaminated-site redevelopment nationwide. Our assessment indicates that this redevelopment activity, combined with lender requirements for pollution coverage on financed projects, is compressing adoption timelines for site-specific pollution liability policies among property developers.

Growth Inhibitors

What Is Restraining Environmental Liability Insurance Market Expansion?

Soft market pricing pressure in contractors pollution liability restrains premium growth across the specialty insurance supply chain. Industry underwriting data continues to show an influx of carriers entering the contractors pollution liability space, compressing rate adequacy. We found that smaller regional carriers face particular exposure, as limited scale reduces their ability to absorb pricing pressure compared with larger, diversified specialty insurers with broader capital bases.

What Are the Growth Opportunities?

How Can PFAS-Specific Coverage Unlock Value for Carriers?

PFAS-specific pollution coverage presents a whitespace opportunity for carriers willing to underwrite legacy contamination exposure with disciplined risk selection. Insurers that commercialize validated PFAS buy-back endorsements stand to capture recurring premium from municipal and industrial buyers facing mounting contamination liability, particularly as remediation cost inflation accelerates through the forecast period.

Where Does Climate-Linked Remediation Financing Create New Demand?

Climate-linked remediation and decarbonization financing represents an underpenetrated opportunity for insurers structuring coverage alongside emerging carbon-management infrastructure, including projects tied to carbon capture, utilization, and storage (CCUS) development. Carriers that develop tailored environmental liability products for these projects can secure long-term contracts with industrial developers pursuing emissions-reduction infrastructure.

How Can Digital Underwriting Benefit Small and Medium Enterprise Buyers?

Small and medium enterprise buyers underserved by traditional pollution liability underwriting create an opportunity for carriers offering streamlined digital quoting platforms. Early movers that secure broker distribution partnerships can differentiate with contractors and small property owners pursuing fast, affordable coverage, benefiting from underserved small-business demand for site-specific and contractor pollution liability policies.

Segmentation Analysis

2025 (USD Billion)
2035 (USD Billion)
Site Pollution Liability 2025: $2.09 Billion | 2035: $3.47 Billion
Site Polluti
Contractors Pollution Liability 2025: $1.43 Billion | 2035: $2.86 Billion
Contractors
Products Pollution Liability 2025: $0.77 Billion | 2035: $1.33 Billion
Products Pol
Storage Tank Liability 2025: $0.55 Billion | 2035: $0.82 Billion
Storage Tank
Environmental Professional Liability 2025: $0.44 Billion | 2035: $1.22 Billion
Environmenta
Combined Package Policies 2025: $0.22 Billion | 2035: $0.51 Billion
Combined Pac
Site Pollution Liability $2.09 Billion $3.47 Billion 5.0%
Contractors Pollution Liability $1.43 Billion $2.86 Billion 7.2%
Products Pollution Liability $0.77 Billion $1.33 Billion 5.4%
Storage Tank Liability $0.55 Billion $0.82 Billion 3.7%
Environmental Professional Liability $0.44 Billion $1.22 Billion 11.2%
Combined Package Policies $0.22 Billion $0.51 Billion 8.9%

Which Coverage Type Segment Dominates the Environmental Liability Insurance Market?

Site Pollution Liability, covering fixed-premises contamination exposure, led the market with USD 2.09 billion in 2025, supported by lender requirements and regulatory cleanup obligations tied to industrial and commercial property. We observed that Environmental Professional Liability is the fastest-growing coverage type, expanding at an 11.2% CAGR from 2026 to 2035, as environmental consultants and engineers face rising errors-and-omissions exposure tied to remediation project complexity.

2025 (USD Billion)
2035 (USD Billion)
Manufacturin
Oil and Gas
Construction
Waste Manage
Real Estate
Segment Item 2025 (USD Billion) 2035 (USD Billion) CAGR
Manufacturing $10.0 USD Billion $40.0 USD Billion 20.0%
Oil and Gas $17.1 USD Billion $51.1 USD Billion 26.0%
Construction and Contractors $24.2 USD Billion $62.2 USD Billion 24.0%
Waste Management $31.3 USD Billion $73.3 USD Billion 26.0%
Real Estate and Brownfield Development $38.4 USD Billion $84.4 USD Billion 9.0%

Segment-wise data is locked

Unlock complete segment-wise numbers for By End User Industry.

Unlock Full Data

Which End User Industry Generates the Most Environmental Liability Insurance Revenue?

Manufacturing remained the leading end user industry, valued at USD 1.32 billion in 2025 as industrial facilities maintain sustained pollution liability coverage tied to regulatory compliance obligations. Based on research conducted by Next Move Strategy Consulting, we found that Mining is the fastest-growing end user industry at an 8.1% CAGR from 2026 to 2035, reflecting expanding coverage uptake as extraction operations face intensifying environmental liability scrutiny.

2025 (USD Billion)
2035 (USD Billion)
Large Enterp
Small and Me
Segment Item 2025 (USD Billion) 2035 (USD Billion) CAGR
Large Enterprises $10.0 USD Billion $40.0 USD Billion 27.0%
Small and Medium Enterprises $17.1 USD Billion $51.1 USD Billion 9.0%

Segment-wise data is locked

Unlock complete segment-wise numbers for By Enterprise Size.

Unlock Full Data

Which Enterprise Size Segment Leads Environmental Liability Insurance Adoption?

Large Enterprises remained the leading enterprise size segment, valued at USD 3.47 billion in 2025 on sustained pollution liability procurement tied to complex multi-site industrial operations. Our findings suggest that Small and Medium Enterprises is the fastest-growing segment, registering a 7.8% CAGR from 2026 to 2035, as contractors and smaller property owners increasingly purchase coverage to meet lender and municipal permitting requirements.

Growth Opportunities

Our analysis shows that three forward-looking opportunities stand out for stakeholders positioning within the market over the 2026-2035 forecast period.

How Can PFAS-Specific Coverage Unlock Value for Carriers?

PFAS-specific pollution coverage presents a whitespace opportunity for carriers willing to underwrite legacy contamination exposure with disciplined risk selection. Insurers that commercialize validated PFAS buy-back endorsements stand to capture recurring premium from municipal and industrial buyers facing mounting contamination liability, particularly as remediation cost inflation accelerates through the forecast period.

Where Does Climate-Linked Remediation Financing Create New Demand?

Climate-linked remediation and decarbonization financing represents an underpenetrated opportunity for insurers structuring coverage alongside emerging carbon-management infrastructure, including projects tied to carbon capture, utilization, and storage (CCUS) development. Carriers that develop tailored environmental liability products for these projects can secure long-term contracts with industrial developers pursuing emissions-reduction infrastructure.

How Can Digital Underwriting Benefit Small and Medium Enterprise Buyers?

Small and medium enterprise buyers underserved by traditional pollution liability underwriting create an opportunity for carriers offering streamlined digital quoting platforms. Early movers that secure broker distribution partnerships can differentiate with contractors and small property owners pursuing fast, affordable coverage, benefiting from underserved small-business demand for site-specific and contractor pollution liability policies.

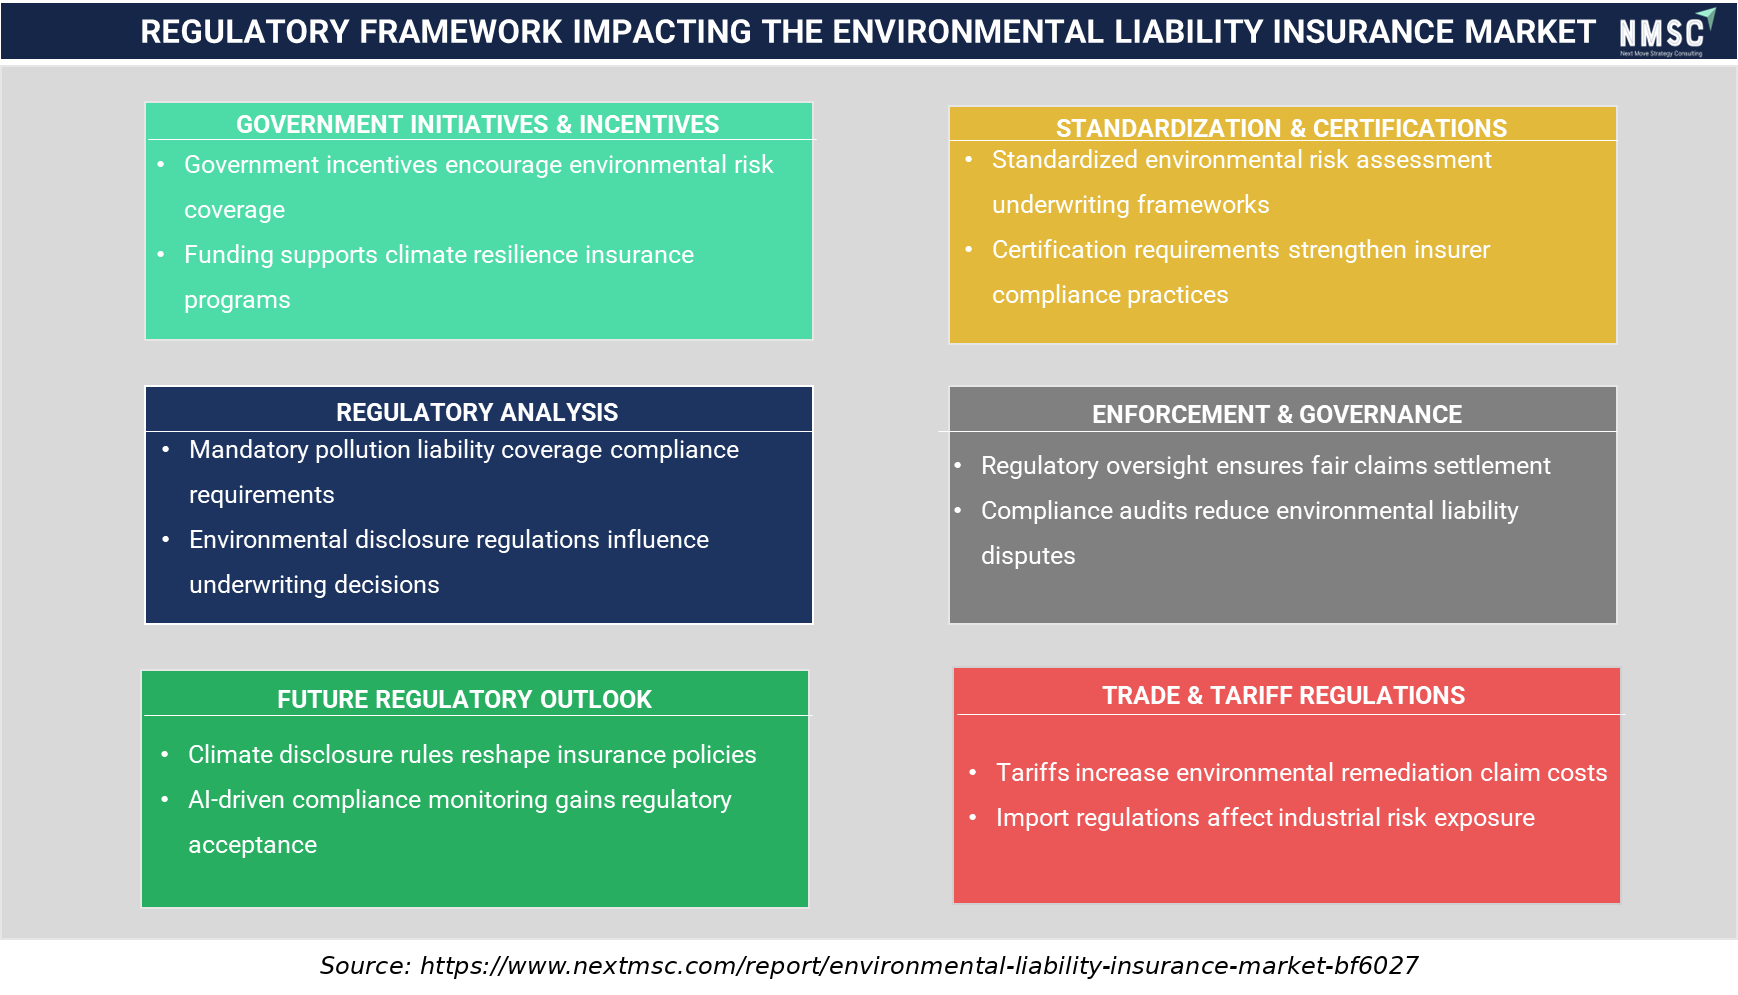
REGULATORY FRAMEWORK IMPACTING THE ENVIRONMENTAL LIABILITY INSURANCE MARKET

The regulatory framework plays a critical role in shaping the market by strengthening compliance requirements, environmental risk assessment standards, and governance practices. Government incentives and climate resilience initiatives encourage wider insurance adoption, while standardized certifications improve underwriting consistency. Increasing environmental disclosure rules, AI-enabled compliance monitoring, and stricter enforcement enhance risk transparency and claims management. Meanwhile, trade regulations and tariffs influence remediation costs, affecting insurers' pricing strategies and overall market dynamics.

Regional Outlook

2025 (USD Billion)
2035 (USD Billion)
North Americ
Europe
Asia-Pacific
Middle East
Latin Americ
Region 2025 (USD Billion) 2035 (USD Billion) CAGR (%)
North America $10.0 USD Billion $40.0 USD Billion 9.0%
Europe $17.1 USD Billion $51.1 USD Billion 27.0%
Asia-Pacific $24.2 USD Billion $62.2 USD Billion 25.0%
Middle East & Africa $31.3 USD Billion $73.3 USD Billion 23.0%
Latin America $38.4 USD Billion $84.4 USD Billion 12.0%

Regional data is locked

Unlock complete regional numbers for this market.

Unlock Full Data

Competitive Landscape

We observed that the environmental liability insurance market remains moderately concentrated, with global specialty carriers, diversified P&C insurers, and reinsurers competing across overlapping segments of the value chain.

Dimension Description
Market Structure Moderately concentrated among top 10 global specialty carriers, with a long tail of regional pollution liability underwriters
Innovation Focus AI-assisted underwriting, PFAS-specific endorsements, and combined broad-form policy packaging
M&A Activity Acquisition of risk-analytics fintechs and specialty environmental underwriting teams

How Do Companies Compete in the Environmental Liability Insurance Market?

Companies compete primarily on underwriting capacity, claims-handling expertise, and breadth of coverage forms within the environmental liability insurance market. We observed that carriers with dedicated environmental risk engineering teams can offer more competitive terms on complex industrial risks than generalist P&C insurers. Financial strength ratings and 24/7 emergency spill-response support increasingly differentiate bids in contractor and industrial procurement, alongside multinational claims capability for buyers with cross-border exposure.

Which Competitive Archetypes Dominate the Environmental Liability Insurance Industry?

Two archetypes dominate the environmental liability insurance industry: large diversified specialty insurers with global environmental underwriting divisions, and focused Lloyd's and London-market pollution liability specialists. We found that the first group competes primarily on capacity and multinational claims reach, while the second differentiates through underwriting flexibility on complex or legacy contamination risks that generalist carriers decline, securing recurring renewal business from specialized industrial and consulting-sector buyers.

What Innovation and Differentiation Strategies Define Market Leaders?

Market leaders differentiate through PFAS-specific endorsements, digital underwriting speed, and integration with adjacent cyber insurance and professional liability lines for buyers managing converging digital and physical risk. Our analysis shows that companies investing in risk-analytics fintech acquisitions are positioning to capture premium industrial accounts, while multinational policy issuance capability increasingly forms a core part of competitive bids across cross-border construction and manufacturing tenders.

How Active Is M&A in the Environmental Liability Insurance Market?

M&A activity remains active as carriers pursue acquisitions of specialty underwriting teams and risk-analytics fintechs to strengthen environmental risk assessment capability. We found that Chubb's 2025 acquisition of an environmental impact forecasting fintech reflects this trend, while regional carriers pursue distribution partnerships to enter new industrial and construction procurement markets across Asia-Pacific and the Middle East.

Key Market Players

We observed that the following companies represent the leading participants shaping the competitive structure of the environmental liability insurance market.

American International Group, Inc. (AIG) Zurich Insurance Group Ltd Allianz SE AXA SA (AXA XL) Chubb Limited Liberty Mutual Insurance Company The Travelers Companies, Inc. American Financial Group, Inc. (Great American Insurance Group) Markel Group Inc. CNA Financial Corporation Starr International Company, Inc. (Starr Companies) Argo Group International Holdings, Ltd. QBE Insurance Group Limited Sompo Holdings, Inc. Munich Reinsurance Company (Munich Re) Swiss Re Ltd Berkshire Hathaway Specialty Insurance Company W. R. Berkley Corporation Beazley plc RLI Corp.

Latest Developments

Our assessment indicates that recent corporate activity reflects continued underwriting innovation and specialty portfolio expansion across the environmental liability insurance market.

Date Event
July 2024 NAIC reported that the frequency and severity of environmental claims were expected to increase in 2024, driven in part by natural catastrophes such as floods and earthquakes, infrastructure damage, and increasing claims associated with PFAS contamination. The association highlighted rising environmental-risk exposure and the significant financial impact of emerging environmental perils on the insurance industry, supporting continued growth and development of the environmental insurance market.
July 2024 Zurich and Aon launched a Clean Hydrogen Insurance Facility providing integrated insurance coverage for blue and green hydrogen projects with capital expenditures of up to USD 250 million. The facility includes construction, operational, business interruption, marine cargo, third-party liability, and carbon capture (CCUS) coverage. This expands insurers' capabilities in underwriting environmental and pollution-related risks associated with the energy transition

Investment Opportunities

Where Are Capital Inflows Concentrated in the Environmental Liability Insurance Market?

Capital inflows are concentrated in specialty underwriting capacity expansion and risk-analytics technology acquisitions. We observed that strategic investors are increasingly funding environmental risk-engineering and remediation-forecasting capabilities to strengthen underwriting precision, reflecting growing investor confidence in environmental liability insurance as a durable specialty line rather than a niche coverage category.

How Significant Is Infrastructure Investment in Environmental Liability Underwriting?

Infrastructure investment in digital underwriting and claims platforms is accelerating as carriers modernize policy administration systems. Our findings suggest that Europe P&C insurance core platform adoption is emerging as an adjacent infrastructure investment theme, with European insurers piloting integrated environmental risk-scoring modules to supplement traditional underwriting workflows during periods of rising submission volume.

What ESG Considerations Shape Environmental Liability Insurance Investment?

Environmental, social, and governance considerations increasingly shape investment decisions, with investors prioritizing carriers that demonstrably support brownfield remediation and sustainable redevelopment financing. We observed that policy wording addressing biodiversity and habitat damage liability is drawing heightened regulatory and investor scrutiny, reflecting growing attention to comprehensive environmental risk transfer across the insurance value chain.

Key Benefits for Stakeholders

How Does This Report Benefit Carrier and Industry Leaders?

Carrier and industry leaders gain access to segment-level revenue forecasts and coverage-type adoption trends that inform underwriting capacity planning. Our analysis shows that the report's regional breakdowns support market-entry and licensing-strategy decisions, helping stakeholders align capital deployment with the fastest-growing coverage types and end-user industries through 2035.

How Does This Report Benefit Investors and Financial Analysts?

Investors and financial analysts benefit from consolidated market-sizing data, competitive-landscape mapping, and CAGR-level growth drivers that support valuation and due-diligence work. We found that the report's country-level forecasts help identify markets with the strongest risk-adjusted return profiles, particularly across the fastest-growing Asia-Pacific and Middle East & Africa regions.

How Does This Report Benefit Brokers and Risk Management Teams?

Brokers and risk management teams gain segmentation-level insight into coverage type, end-user industry, and enterprise size preferences that inform placement strategy. Our assessment indicates that the report's trend analysis highlights PFAS-specific endorsements as a high-growth adjacency, helping teams align client advisory services with the fastest-growing sub-segments identified in this market report.

Key Market Segments Evaluated

By Coverage Type

  • Site Pollution Liability
  • Contractors Pollution Liability
  • Products Pollution Liability
  • Storage Tank Liability
  • Environmental Professional Liability
  • Combined Package Policies

By End User Industry

  • Manufacturing
  • Oil and Gas
  • Construction and Contractors
  • Waste Management
  • Real Estate and Brownfield Development
  • Chemicals
  • Mining

By Enterprise Size

  • Large Enterprises
  • Small and Medium Enterprises

Conclusion & Recommendations

The long-term outlook remains positive, with the market projected to grow from USD 5.9 billion in 2026 to USD 10.2 billion by 2035. We observed that this trajectory is underpinned by structural regulatory enforcement and brownfield redevelopment activity rather than short-term pricing cycles alone, positioning environmental liability insurance as a durable specialty line through 2035 and beyond.

What Strategic Positioning Should Stakeholders Pursue?

Stakeholders should pursue specialty positioning that combines environmental risk engineering, digital underwriting speed, and broad-form policy capability. Our analysis shows that carriers investing early in PFAS-specific endorsements and combined package policy design, spanning site pollution, contractors pollution, and professional liability, will be best positioned to capture premium industrial and contractor accounts within the environmental liability insurance market.

How Attractive Is the Environmental Liability Insurance Market for New Investment?

The environmental liability insurance industry presents an attractive investment case, supported by a USD 4.3 billion absolute dollar opportunity between 2026 and 2035 and above-average growth in Asia-Pacific and Middle East & Africa. We found that investment attractiveness is highest for carriers combining underwriting capacity with digital differentiation, positioning them to serve both cost-sensitive small and medium enterprise buyers and premium industrial segments simultaneously.

What Market Shifts and Key Risks Should Stakeholders Monitor?

Stakeholders should monitor soft-market pricing pressure, PFAS litigation exposure, and limited underwriting capacity for legacy contamination sites as key risks to the environmental liability insurance market. Our analysis shows that carriers unable to maintain rate adequacy risk ceding market share to competitors with stronger capital positions, particularly as claims severity from contamination litigation accelerates through 2035.

What Are the Key Growth Pathways for the Environmental Liability Insurance Market?

Key growth pathways include expanding PFAS-specific and combined package policy portfolios, scaling digital underwriting capability, and deepening penetration into small and medium enterprise buyer segments. Next Move Strategy Consulting's analysis indicates that carriers pursuing these pathways while maintaining underwriting discipline in core site pollution categories will be best positioned to capture the environmental liability insurance market's projected growth through 2035.

FAQs

About the Author

Mayurima Roy

Mayurima Roy

Mayurima Roy is Research Analyst at Next Move Strategy Consulting, where she has spent 4 years working across the firm's full industry coverage rather than a single fixed vertical. Her work centers on structured research, ongoing trend tracking, competitive assessment, and insight-led content development, translating complex market data into clear, decision-ready narratives that support informed client decision-making across diverse global industries, market sectors, and world regions every day.

About the Reviewer

Supradip Baul

Supradip Baul

Supradip Baul is an accomplished business consultant and strategist with over a decade of rich experience in market intelligence, strategy, technology, and business transformation. His work has included rigorous qualitative and quantitative analysis across multiple industries, helping clients shape investment decisions and long-term roadmaps. Earlier in his career, he was associated with Gartner, where he contributed to industry-leading reports and market share analyses. He has worked with leading global companies and holds an MBA with a dual specialization in Marketing and Finance.

Download Free Sample

Gaurav Jaiswal

GAURAV JAISWAL

Founder & CEO

Yano Charge Private Limited

The EV Charging market research report provided by the NextMSC was exceptionally detailed and insightful. It offered a comprehensive analysis that proved to be a game-changer for our strategic planning. Truly a testament to the NextMSC’s expertise and thoroughness in EV market landscape & analysis.

Kevin Coker

KEVIN COKER

Founder, CEO and Board Diector

Proxima Clinical Research

I have been using Next MSC reports for product positioning in a new geography for a long time. They have by far the best reports I have found and the price is reasonable too!

Pratyush Kumar Das

PRATYUSH KUMAR DAS

Assistant Manager

Polycab India Limited

We would like to express our appreciation for the data and insights provided by nextmsc. We are very pleased with the quality and depth of the information, which has proven to be highly valuable and beneficial for our business decision-making.

Diana Trejo

DIANA TREJO

Assistant Manager

Sumitomo Corporation de Mexico, S.A. de C.V.

Recently, we purchased a report on the Mexico Data Center Market from Next Move Strategy Consulting. The service has been excellent, with support that is always timely and thoroughly professional. The information provided is interesting, highly useful, and delivered with clarity. I would highly recommend NextMSC for anyone seeking insightful and dependable analysis.

Robert Sean Trevino

ROBERT SEAN TREVINO

Sr. Director, Head of Strategic Insights & Analytics

Foundation Medicine

I realized that it was a reliable source of information. These days, there are many people who are looking for authentic data, and this is one of the only sources that can offer them with what they need;

Custom Market Research Services

We will customize the research for you if the listed report does not fully match your requirements.

Get 30% Free Customization

Select License

This website uses cookies to ensure you get the best experience on our website. Learn more

✖