Furniture Market by Type (Ready-to-Assemble (RTA), and Assembled), by Product Type (Beds and Mattresses, Sofas and Armchairs, Entertainment Units, Storage Units, Tables and Desks, and Other Furniture), by Material Type (Wooden Furniture, Metal Furniture, Plastic Furniture, Leather Furniture, and Glass Furniture), by Price Range (High-End Price Furniture, Medium Price Range Furniture, and Low-Price Range Furniture), and Others – Global Opportunity Analysis and Industry Forecast, 2024–2030
Industry: Retail and Consumer | Publish Date: 14-Feb-2025 | No of Pages: 459 | No. of Tables: 382 | No. of Figures: 358 | Format: PDF | Report Code : RC453
Market Overview:
The global Furniture Market size was valued at USD 649.91 billion in 2023 and is expected to reach USD 930.43 billion by 2030, with a CAGR of 5.3% from 2024 to 2030. Furniture, comprising an array of items like chairs, tables, beds, and storage units, serves as indispensable elements in living and working spaces.
Beyond its utilitarian function, furniture provides comfort through ergonomic designs, contributes to organizational efficiency with storage solutions, and adds aesthetic value by reflecting personal style and enhancing interior design. With versatility, adaptability, and durability as its core features, furniture caters to diverse end users. In essence, furniture plays a pivotal role in shaping the ambiance, comfort, and functionality of spaces, offering advantages that extend beyond mere utility to encompass aesthetics, personal expression, and an enhanced quality of life for its users.
Urbanization and Population Growth Drives Expansion for the Furniture Industry
The substantial growth of the global furniture market is significantly propelled by the concurrent trends of urbanization and population expansion, particularly evident in emerging economies. As per the World Bank, the current landscape indicates that approximately 56% of the world's population, equivalent to 4.4 billion individuals, resides in urban areas. This trajectory is expected to persist, with the urban population forecasted to more than double its present size by 2050.
Projections suggest that nearly seven out of ten people will be urban dwellers by that juncture. This burgeoning urbanization, underscored by statistical data, underpins a burgeoning demand for housing and, inextricably, fuels the need for furniture to furnish these evolving living spaces. The resultant surge in urban living represents a compelling force shaping the trajectory of the global furniture market, emphasizing the market's responsiveness to demographic shifts and urban development trends.
Rising Hospitality and Commercial Sector Boosts the Market Growth:
The substantial growth of the global furniture market is significantly propelled by the robust expansion witnessed in the hospitality and commercial sectors, encompassing establishments such as hotels, restaurants, and offices. This surge in growth emanates from an escalating demand for commercial-grade furniture, a trend that significantly augments the overall expansion of the market.
According to Condor Ferries, a reputable source in the industry, the global hotel landscape comprises a noteworthy 187,000 establishments as of 2023. An indicative metric of this burgeoning sector is the remarkable increase in the average U.S. hotel occupancy, reaching 63.8% in 2023, a notable ascent from the 43.9% recorded in 2020. These statistics underscore the pivotal role played by the burgeoning hospitality and commercial sectors in propelling the demand for specialized furniture, thereby contributing substantially to the thriving momentum of the global furniture market.
Rising Penetration of E-Commerce and Online Retailing Boosts Market Expansion
The notable growth in the global furniture market is significantly influenced by the widespread adoption of e-commerce and online retailing platforms. The proliferation of these digital avenues has greatly streamlined the process of furniture shopping, offering consumers convenient access to an extensive array of choices, facilitating price comparisons, and ensuring doorstep delivery. This enhanced accessibility contributes significantly to the market's expansion.
As reported by Forbes, in 2023, a noteworthy 20.8% of retail purchases occurred online, signifying a substantial shift in consumer behavior. Projections indicate a further increase, with an anticipated 24% of retail purchases expected to take place online by 2026. These statistics underscore the pivotal role of e-commerce in reshaping consumer preferences and driving the upward trajectory of the global furniture market.
Raw Material Cost Volatility Hinders the Market Expansion
The instability in raw material prices, encompassing essential elements like wood, metal, and textiles, stands as a significant constraint on the growth of the furniture market. Fluctuations in these material costs directly impact manufacturing expenses, introducing the potential for heightened prices in furniture products. Such increased pricing, in turn, has the potential to deter consumer demand, creating a challenging environment for market expansion.
Advancement in Home Automation Technology to Create Future Market Prospects
The rapid advancements in home automation technology are expected to create ample opportunities for the furniture industry in the future. This technological progress allows for the integration of furniture into the broader smart home ecosystem, making it user-friendly and versatile for consumers of various technical backgrounds. The seamless integration of furniture with existing home automation systems, such as voice assistants and smart thermostats, ensures the streamlining of the user experience and enhances the appeal of smart homes.
Additionally, this collaboration between furniture and home automation systems contributes to energy efficiency, aligning with the increasingly important trend of eco-friendly living. With more user-friendly, stylish, and environmentally conscious options available than before, the furniture industry is well-positioned to thrive as it caters to the evolving needs of homeowners.
North America Holds the Dominant Market Share in The Global Market
A pivotal driver for the growth of the global furniture market in North America is the seamless integration of smart home technologies. This transformative trend has exerted a discernible influence on consumer choices, particularly in the context of furniture selection. Consumers in North America are increasingly inclined towards furniture products that seamlessly integrate with their smart home systems, reflecting a growing demand for technologically advanced and interconnected living spaces. This proclivity not only underscores the region's technological sophistication but also contributes significantly to the expansion of the furniture market, as manufacturers respond to evolving preferences by incorporating smart functionalities into their product offerings.
Furthermore, a significant factor driving the growth of the furniture market in North America is the sustained economic prosperity, notably observed in the United States and Canada. This economic affluence plays a pivotal role in fostering higher consumer spending on furniture, as individuals channel their resources into home improvements and décor. According to the U.S. Bureau of Labor Statistics (BLS), average annual expenditures for all consumer units in 2022 witnessed a notable uptick, reaching USD 72,967, reflecting a substantial 9.0-percent increase from the preceding year.
Within this economic landscape, the housing sector emerges as a dominant player, claiming the largest share at 33.3 percent. This robust economic condition not only underscores the financial well-being of North American consumers but also serves as a significant impetus for increased investment in furniture, thereby propelling the growth trajectory of the global furniture market in the region.
Asia-Pacific is Expected to Show Steady Growth in the Global Furniture Market
The robust growth of the furniture industry in the Asia Pacific region is the rapid urbanization observed in countries such as China and India. This accelerated urbanization has generated an increased demand for furniture, with newly established urban residents actively seeking to furnish their homes. The preference for modern and stylish furniture aligns with the prevailing urban lifestyle trends, further accentuating the need for contemporary furnishing solutions.
According to the UN-Habitat, urbanization remains a defining megatrend in the Asia-Pacific region, encompassing more than 2.2 billion people, constituting 54% of the global urban population. Looking ahead, projections indicate a continued surge, with the urban population in Asia expected to grow by 50%, leading to an additional 1.2 billion people by the year 2050. This sustained momentum in urbanization underscores a persistent and escalating demand for furniture, solidifying the region's pivotal role in propelling the global furniture market.
Moreover, the growth of the global furniture market in the Asia Pacific region is driven by the rising effect of population growth and escalating housing needs. The surge in population, notably in densely populated countries, instigates a heightened demand for housing.
Consequently, this surge fuels an associated need for furniture, establishing a consistent market demand across both residential and commercial segments. According to the United Nations, the Asia and the Pacific region constitute a home for 60% of the world's population, approximately 4.3 billion people, encompassing the world's most populous nations, China and India. This demographic reality underscores the substantial and enduring market for furniture in the region, affirming its pivotal role in driving growth within the global furniture market.
Competitive Landscape
Several market players operating in the furniture industry include IKEA, MillerKnoll, Durian, Steelcase, Inc., HNI Corporation, Okamura Corporation, Ashley HomeStore, Berkshire Hathaway, La-Z-Boy Inc., Kukoyo, and others. These market players are adopting strategies, such as product launches, across various regions to maintain their dominance in the furniture market.
For instance, in December 2023, IKEA introduced the latest iteration of the Nytillverkad collection, featuring iconic pieces that seamlessly blend timeless design with contemporary functionality. Scheduled to hit stores in January 2024, this collection revisits the laid-back and playful aesthetics of the '60s and early '70s, skillfully reimagined to align with the requirements of modern homes.
Moreover, in June 2023, Durian Furniture unveiled an exquisite line of Marble & Granite furniture pieces tailored for contemporary residences. This launch introduces a coveted collection of enduring furniture crafted from natural marble and granite materials, encompassing an array of items such as coffee tables, bedside tables, dining tables, TV units, and more.
Furniture Market Key Segments
By Type
-
Ready-to-Assemble (RTA)
-
Assembled
By Product Type
-
Beds and Mattresses
-
Sofas and Chairs
-
Entertainment Units
-
Storage Units
-
Tables and Desks
-
Other Furniture
By Material Type
-
Wooden Furniture
-
Metal Furniture
-
Plastic Furniture
-
Leather Furniture
-
Glass Furniture
By Price Range
-
High-End Price Furniture
-
Medium Price Range Furniture
-
Low-Price Range Furniture
By End Use
-
Residential
-
Commercial
By Distribution Channel
-
Home Centers
-
Flagships Stores
-
Specialty Stores
-
E-Commerce
-
Other Distribution Channels
By Region
-
North America
-
The U.S.
-
Canada
-
Mexico
-
-
Europe
-
The U.K.
-
Germany
-
France
-
Italy
-
Spain
-
Denmark
-
Netherlands
-
Finland
-
Sweden
-
Norway
-
Russia
-
Rest of Europe
-
-
Asia Pacific
-
China
-
Japan
-
India
-
South Korea
-
Australia
-
Singapore
-
Taiwan
-
Vietnam
-
Rest of Asia Pacific
-
-
Rest of the World (RoW)
-
Brazil
-
South Africa
-
Nigeria
-
Israel
-
KSA
-
Turkey
-
Remaining Countries
-
Key Players
-
IKEA
-
MillerKnoll
-
Durian
-
Steelcase Inc.
-
HNI Corporation
-
Okamura Corporation
-
Ashley HomeStore
-
Berkshire Hathaway
-
La-Z-Boy Inc.
-
Kukoyo
REPORT SCOPE AND SEGMENTATION:
|
Parameters |
Details |
|
Market Size in 2023 |
USD 649.91 Billion |
|
Revenue Forecast in 2030 |
USD 930.43 Billion |
|
Growth Rate |
CAGR of 5.3% from 2024 to 2030 |
|
Analysis Period |
2023–2030 |
|
Base Year Considered |
2023 |
|
Forecast Period |
2024–2030 |
|
Market Size Estimation |
Billion (USD) |
|
Growth Factors |
|
|
Countries Covered |
31 |
|
Companies Profiled |
10 |
|
Market Share |
Available for 10 companies |
|
Customization Scope |
Free customization (equivalent up to 80 working hours of analysts) after purchase. Addition or alteration to country, regional, and segment scope. |
")


About the Author
 Sikha Haritwal is a researcher with more than 5 years of experience. She has been keeping a close eye on several industry verticals, including construction & manufacturing, personal care products, and consumer electronics. She has avid interest in writing news articles and hopes to use blog as a platform to share her knowledge with others.
About the Reviewer
 Supradip Baul is an accomplished business consultant and strategist with over a decade of rich experience in market intelligence, strategy, technology and business transformation. His work has included rigorous qualitative and quantitative analysis across multiple industries, helping clients shape investment decisions and long-term roadmaps. Earlier in his career, he was associated with Gartner, where he contributed to industry-leading reports and market share analyses. He has worked with leading global companies and holds an MBA with a dual specialization in Marketing and Finance.
At Next Move Strategy Consulting, we understand that insightful market research is the cornerstone of successful business decisions. That's why we employ a robust and multifaceted approach, combining various methodologies to deliver the most accurate and actionable data for our clients.

Research Landscape
We navigate the world of research with two primary approaches:
Qualitative Approach
Our qualitative research methodologies involve immersive techniques such as in-depth interviews, focus groups, and observational studies. By engaging directly with individuals and stakeholders, we uncover valuable insights that quantitative data alone may overlook.
Quantitative Research
In tandem with qualitative methodologies, NMSC leverages the power of Quantitative Research to provide a robust foundation of numerical insights. Through systematic data collection and analysis, we quantify patterns, preferences, and market trends, offering a comprehensive view of the business landscape.
Our quantitative research approach employs diverse tools, including surveys, experiments, and statistical modelling. These methodologies enable us to gather data from a large and representative sample, ensuring the statistical significance of our findings. By employing structured questionnaires and standardized data collection methods, we guarantee the reliability and validity of the information we present to our clients.
Quantitative research is particularly effective in measuring the prevalence of trends, assessing market size, and gauging the impact of various factors on consumer behavior. The numerical precision attained through this approach equips our clients with actionable insights, facilitating data-driven decision-making and strategy formulation.
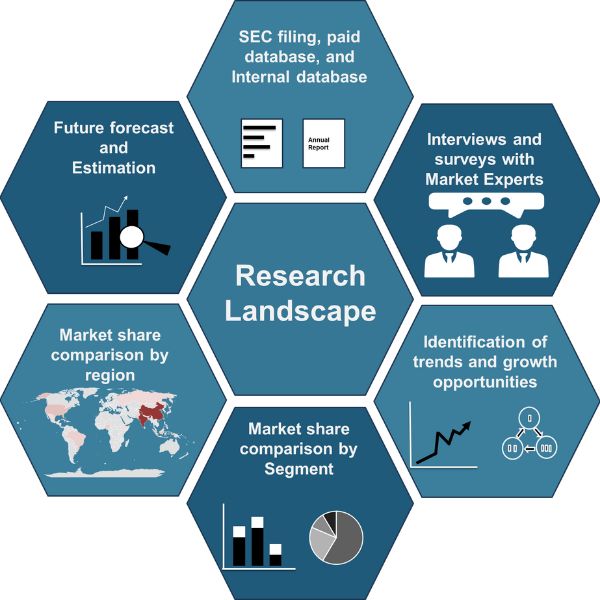
Our Specialized Toolbox for Industry-Specific Market Research
We deploy a specialized arsenal of techniques tailored to meet your unique requirements. Here's a glimpse into our comprehensive toolbox:

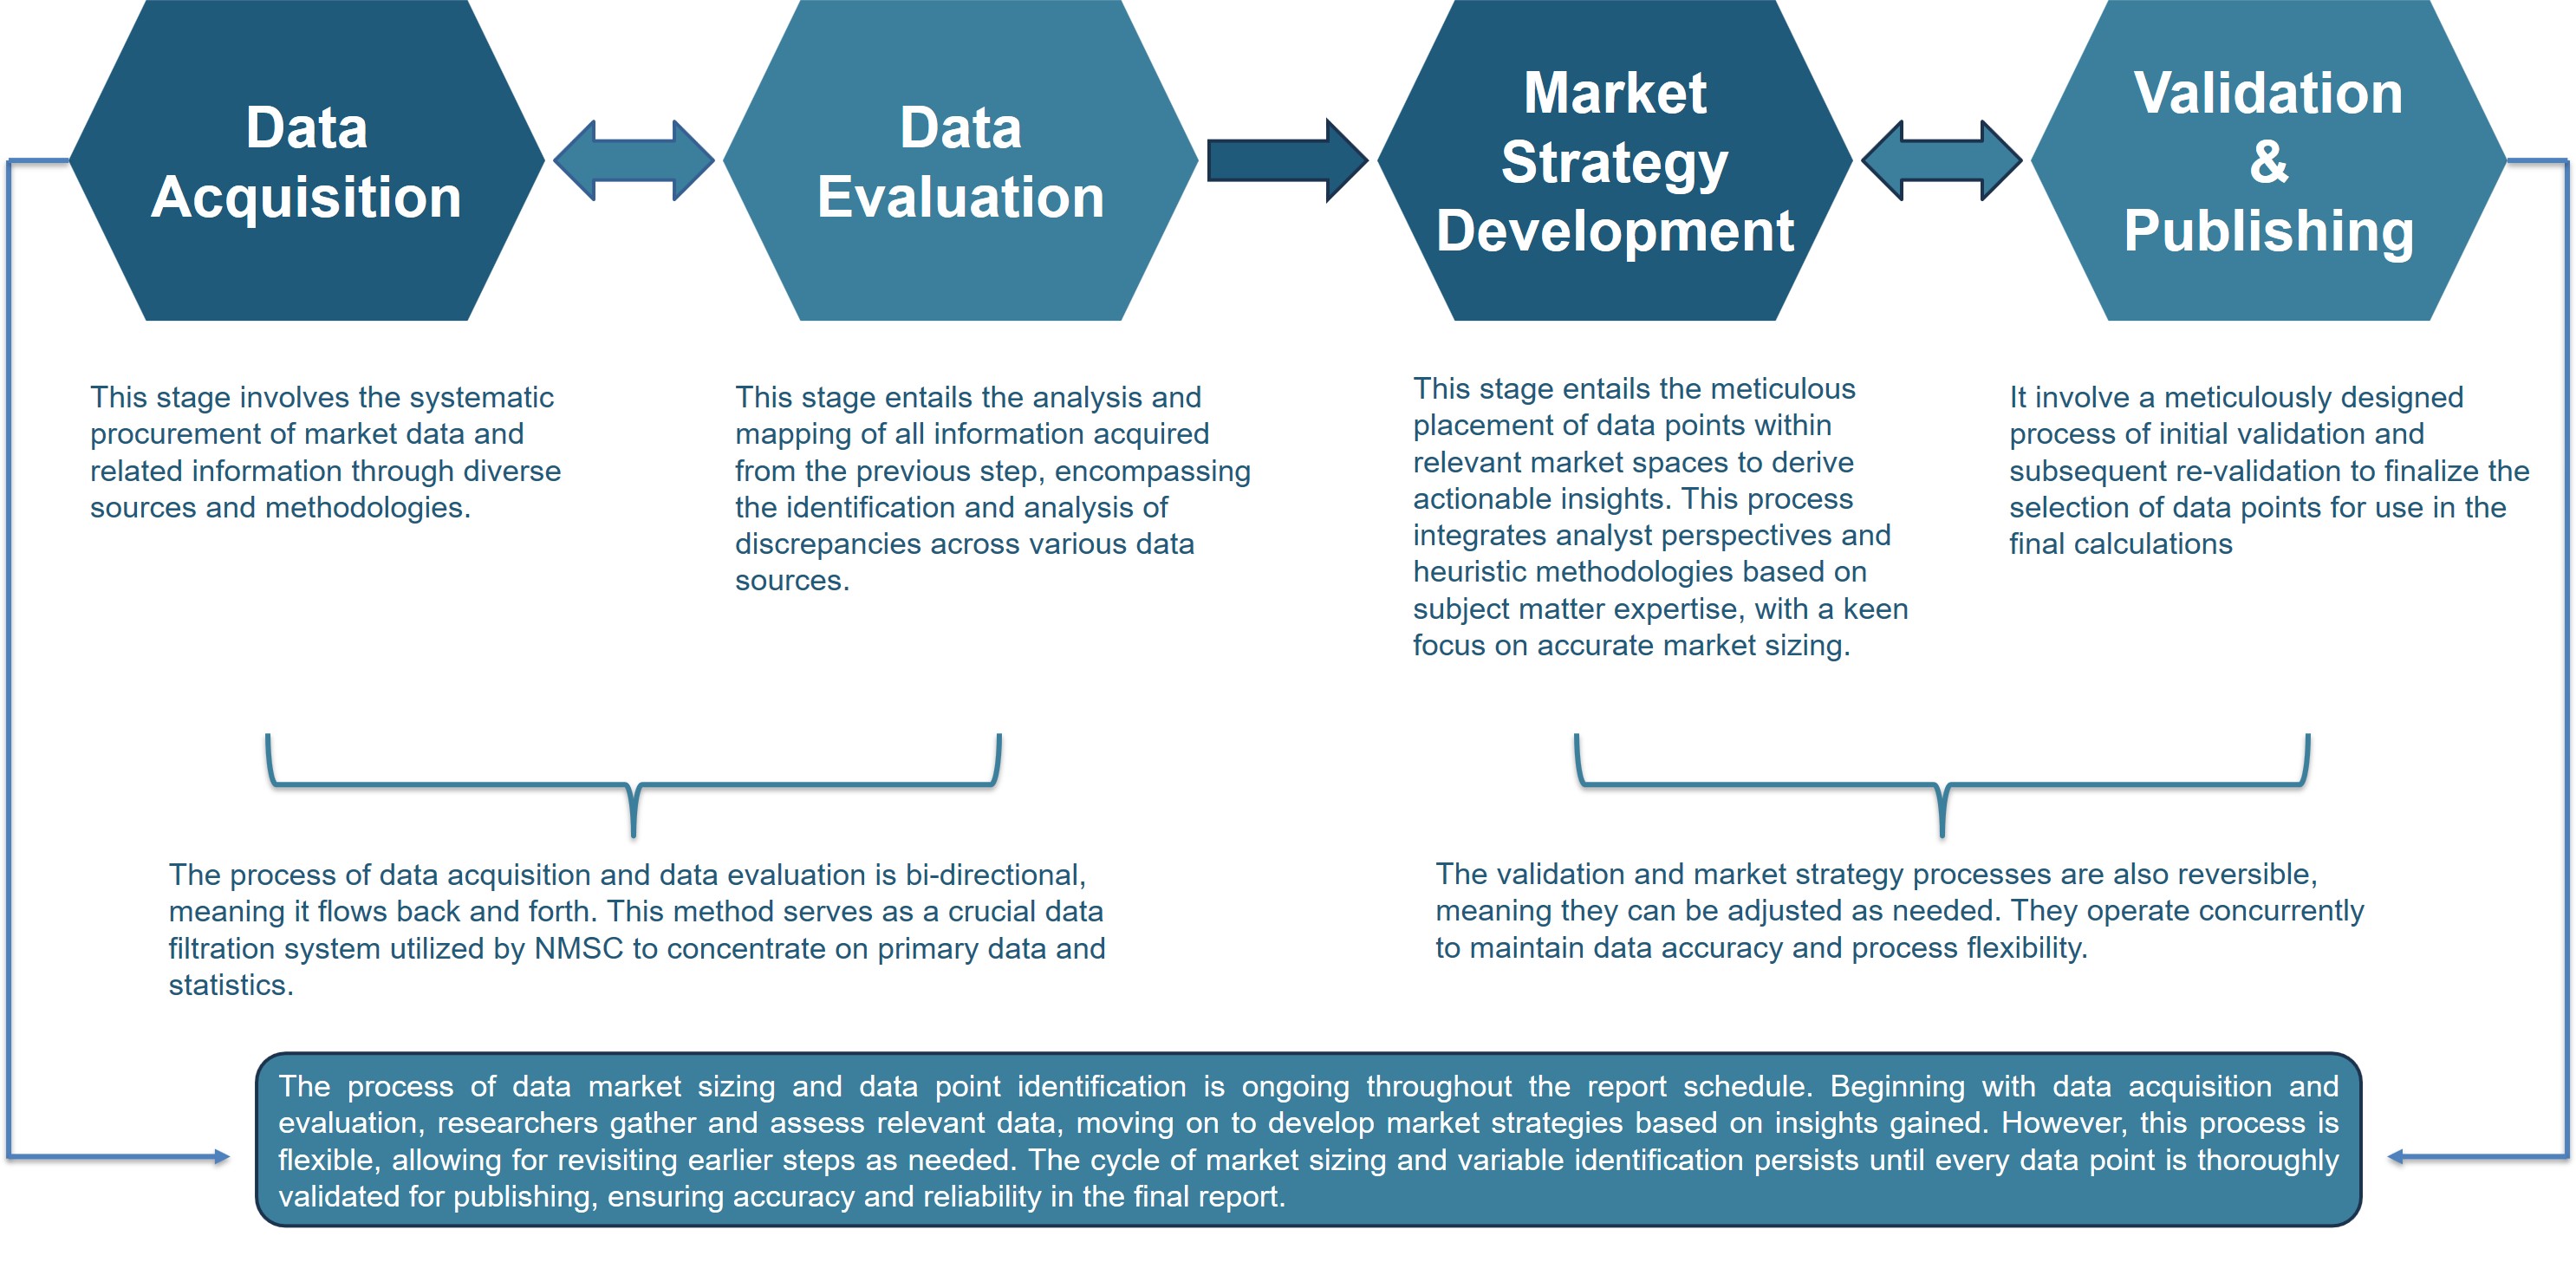
Information Procurement
The stage entails acquiring market data or relevant information through various sources and methodologies.


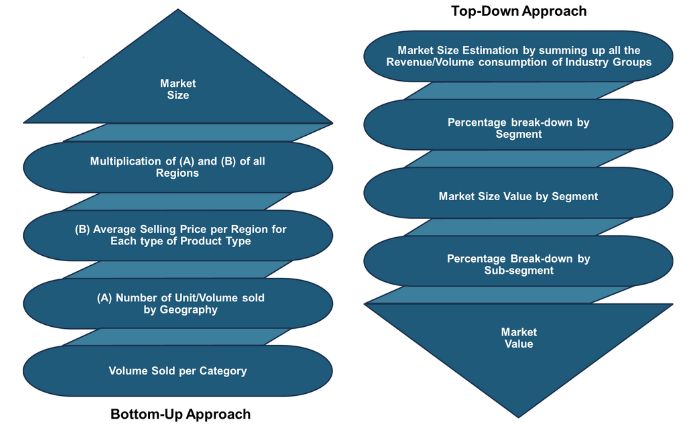
Market Research Approach
We utilize both top-down and bottom-up approaches in market research analysis to achieve a comprehensive understanding of the market dynamics, leveraging the broad perspective of industry trends and macroeconomic factors alongside detailed insights from specific segments and individual companies.
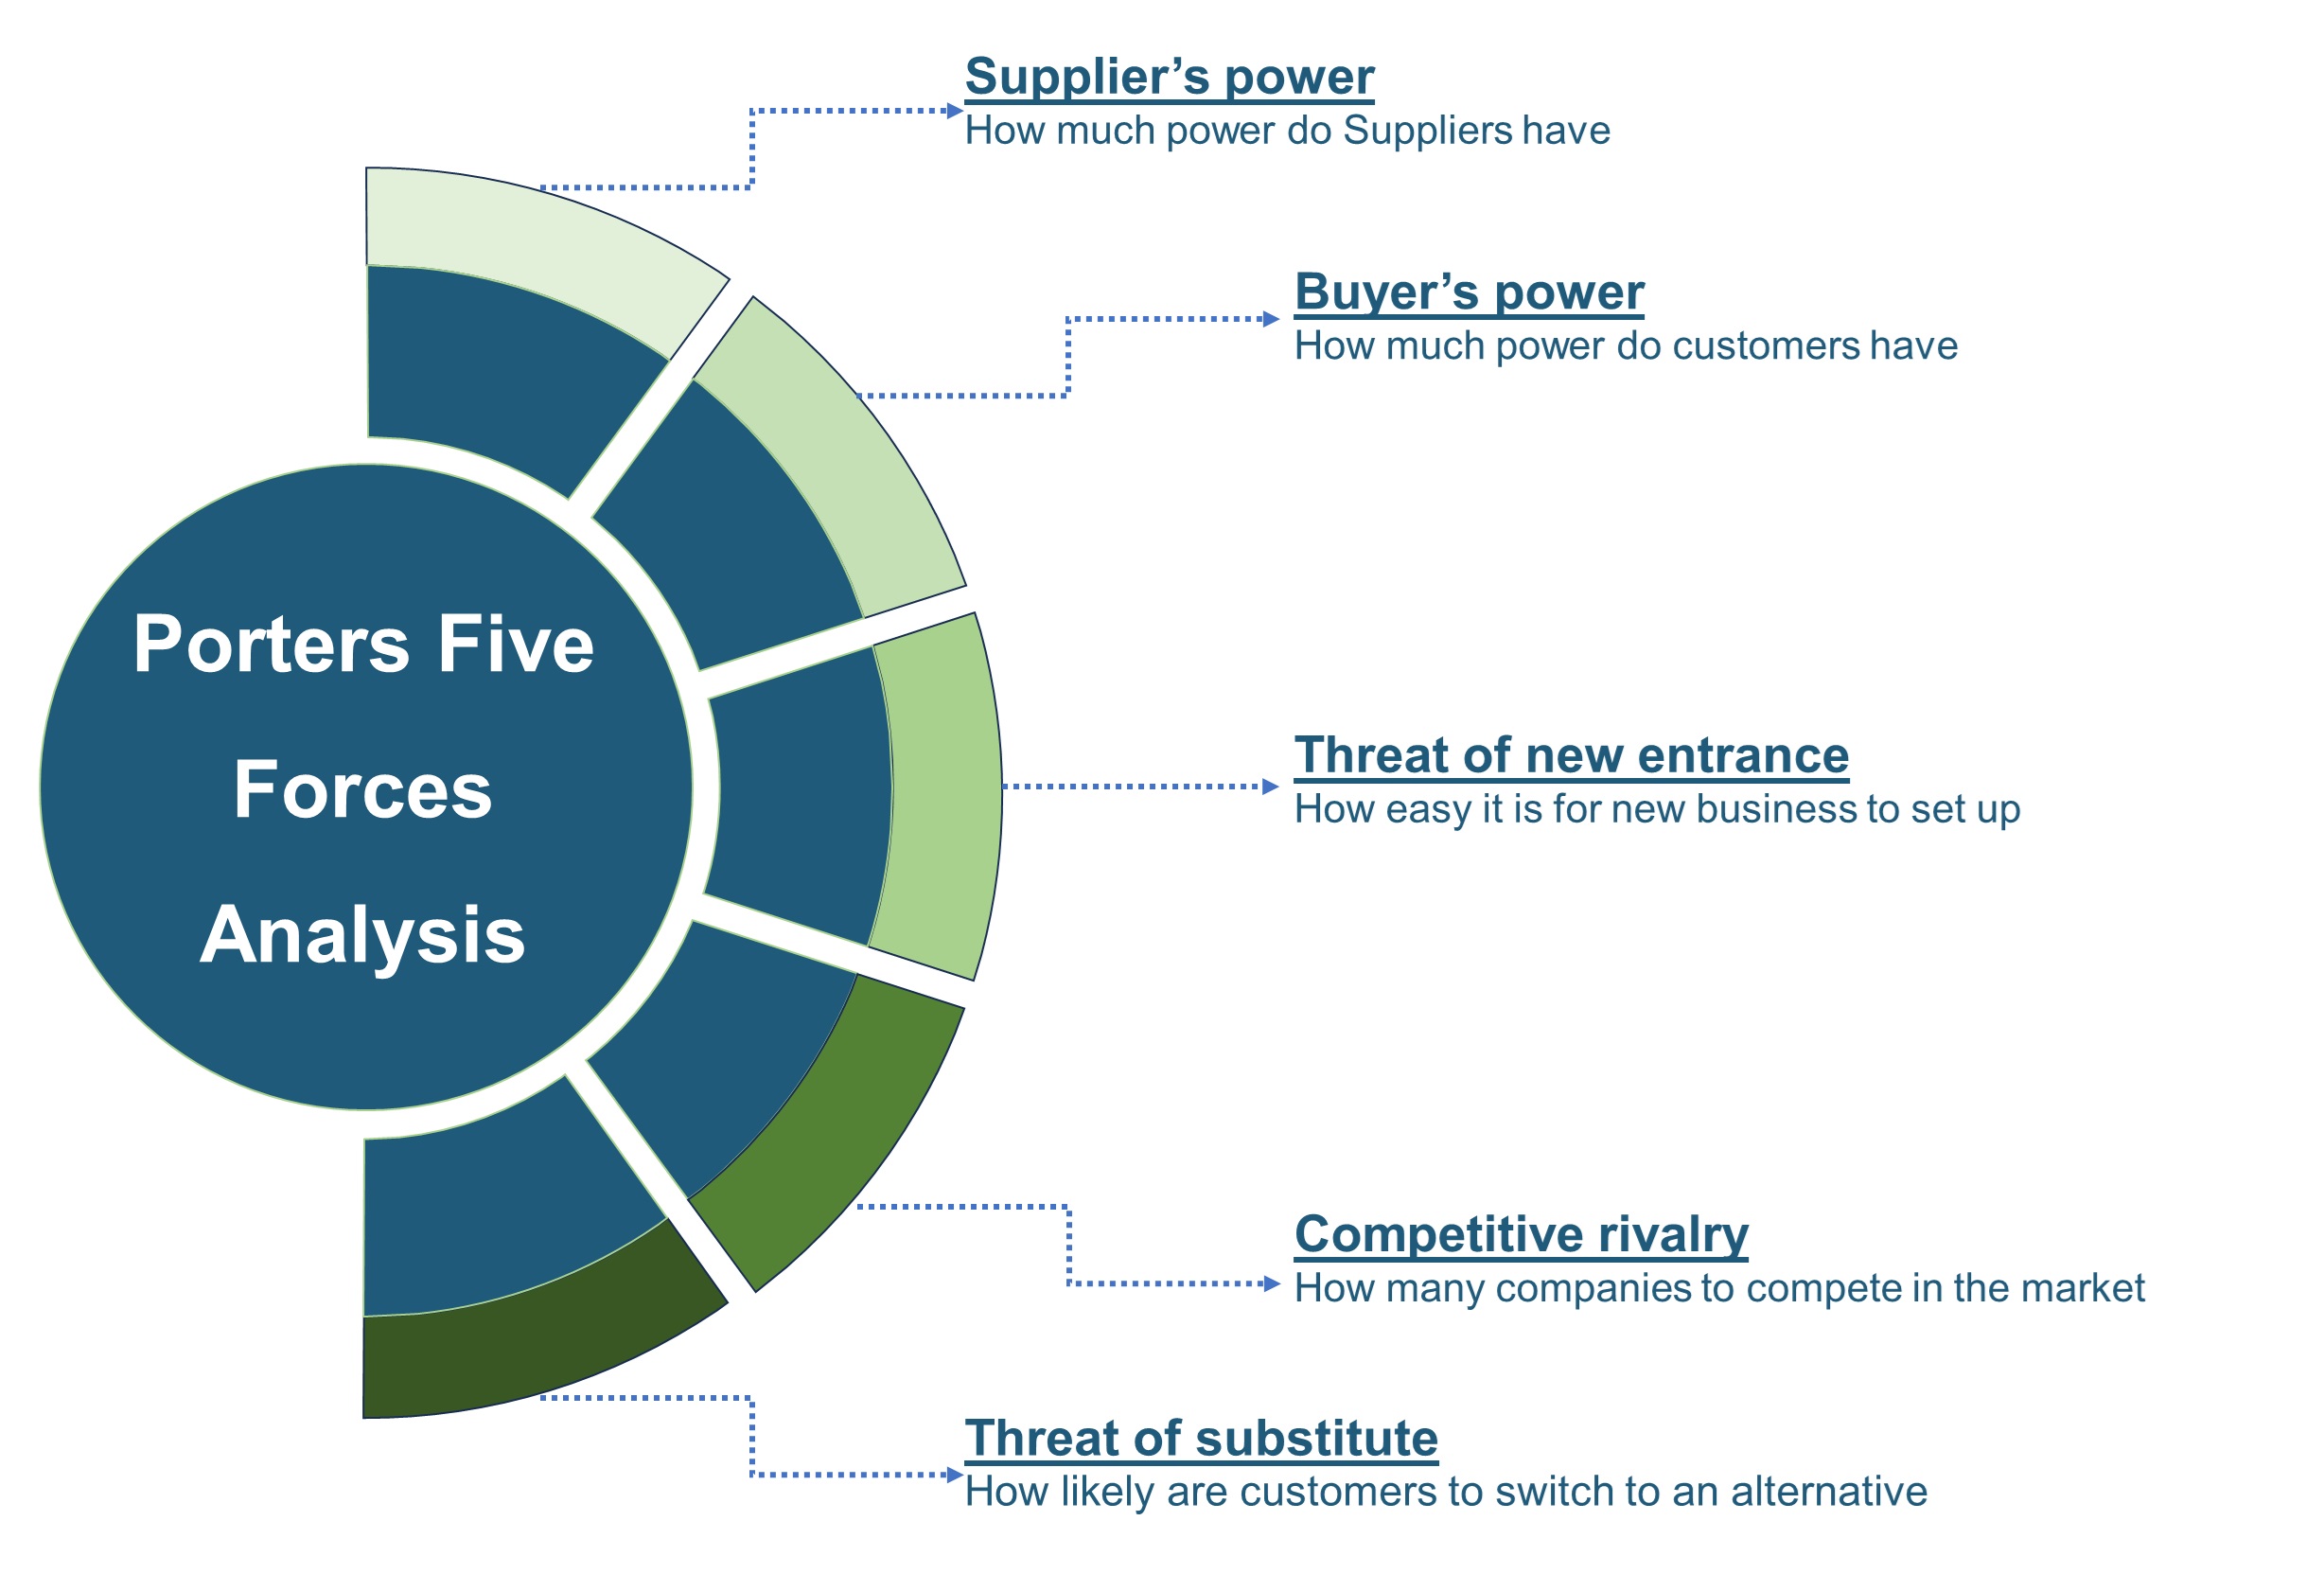
Porters Five Forces Analysis
We conduct Porter's Five Forces analysis to evaluate the competitive landscape of an industry, providing us with insights into factors that affect profitability and strategic positioning.
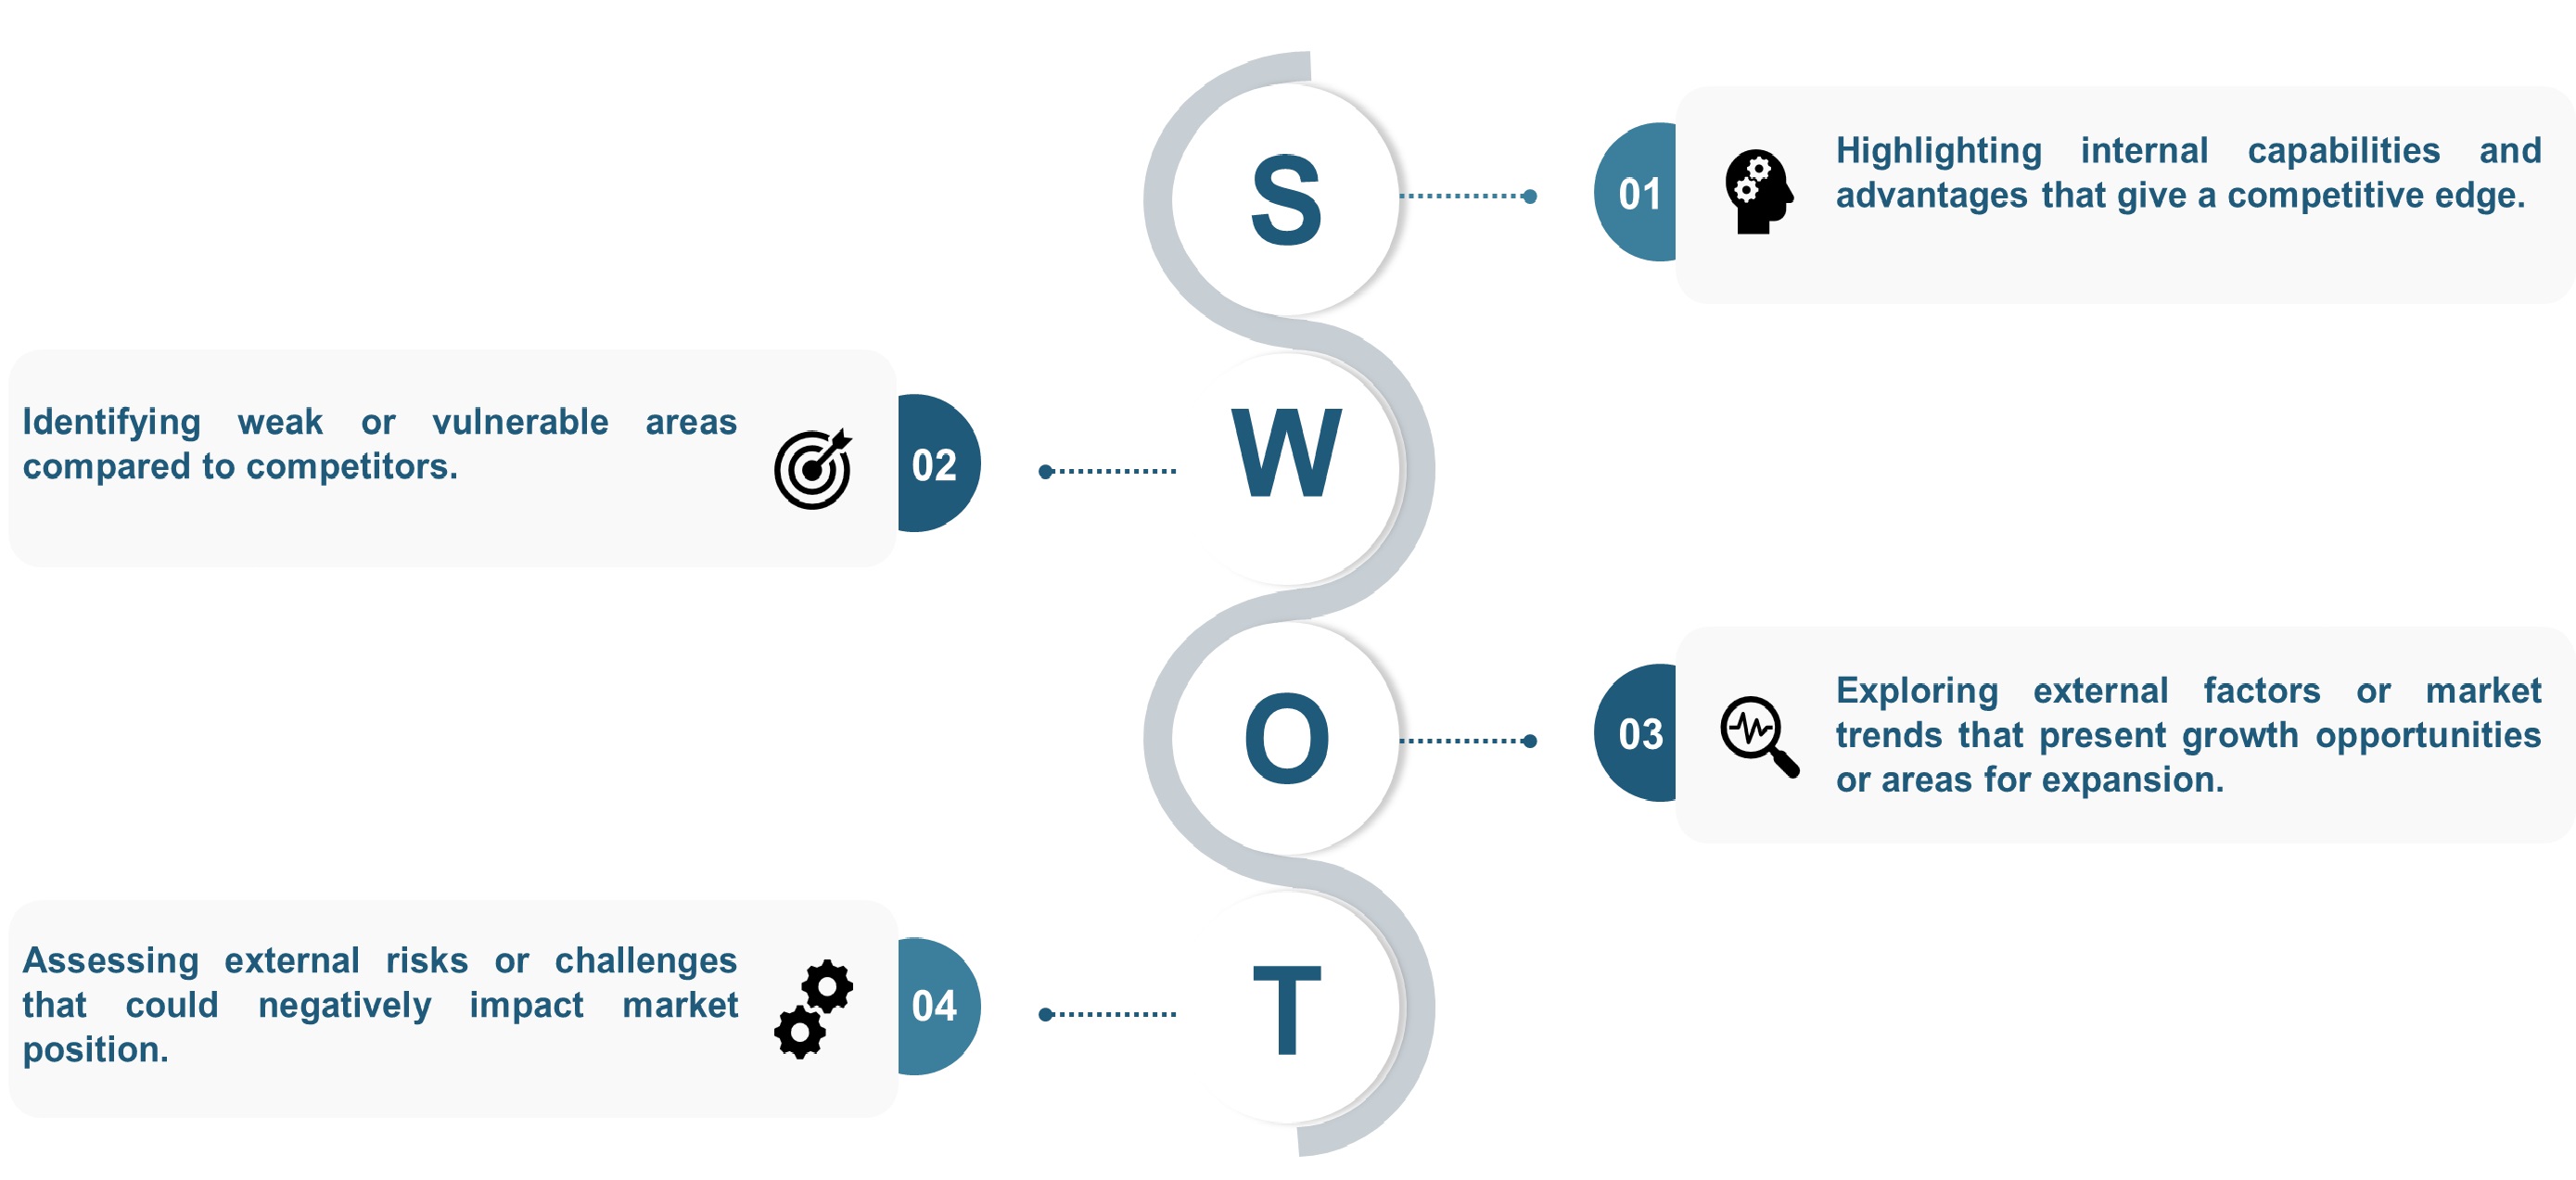
SWOT Analysis
We conduct SWOT analysis to understand market trends, identify potential threats, capitalize on opportunities, and assess our strengths and weaknesses.
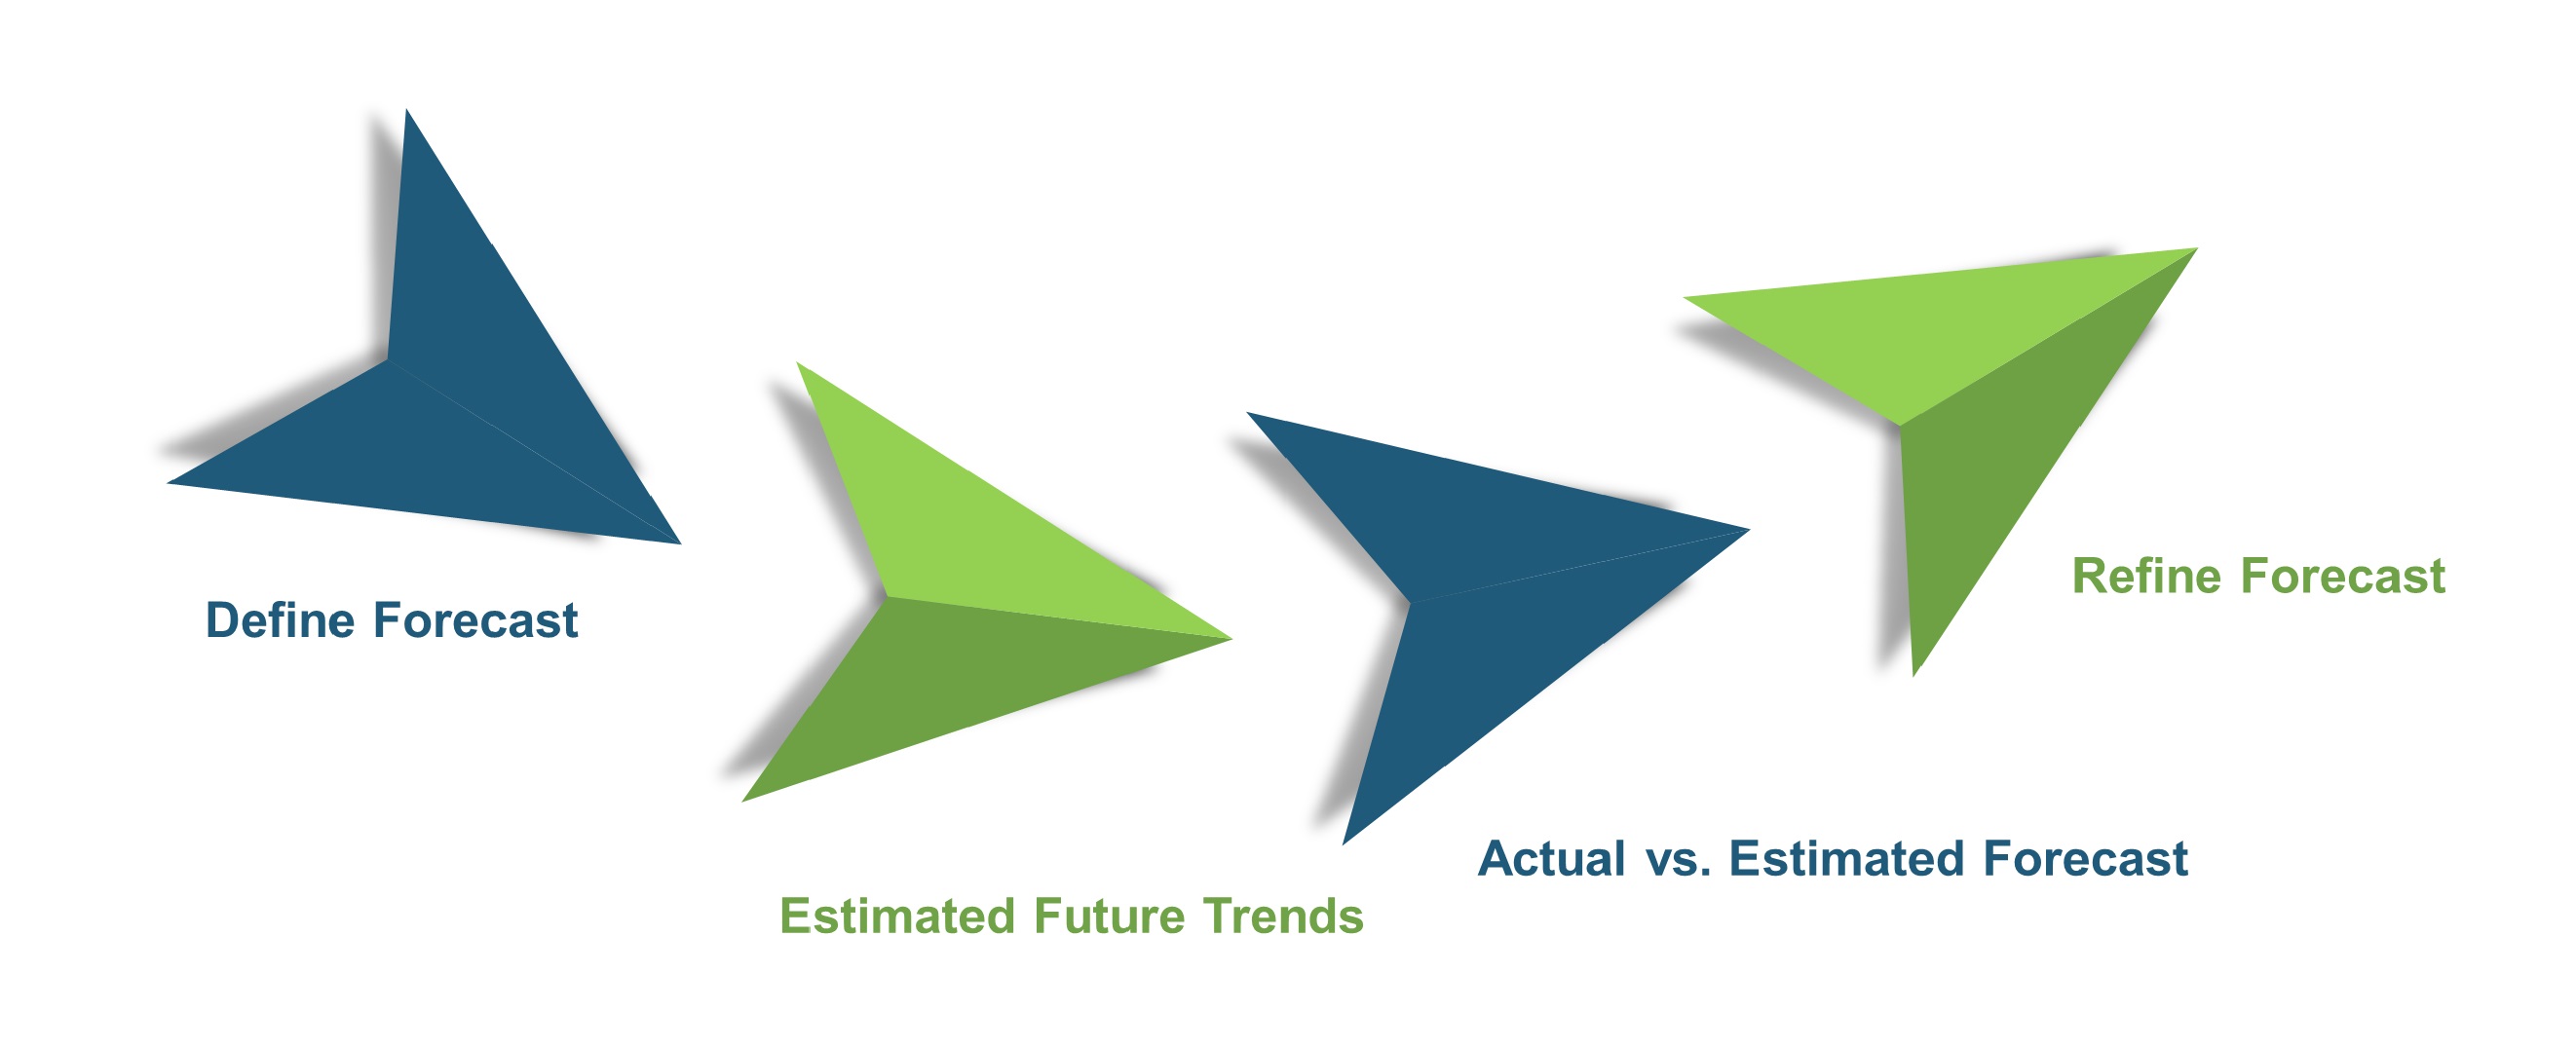
Forecasting
We utilize a forecasting model to predict future consumption by considering parameters like population, economics, regulations, market competition, drivers, constraints, technology, and pricing. We also employ statistical techniques such as multilinear regression, exponential smoothing, moving average, ARIMA, and Monte Carlo simulations for accurate predictions. In econometric forecasting, we analyzed short-term and long-term event impacts, attributing values based on regulatory frameworks, economic factors, and market events.


 Speak to Our Analyst