Grid Scale Battery Market Global Industry Analysis and Forecast (2026–2035)

The global Grid Scale Battery Market is valued at USD 158.57 Billion in 2026 and is projected to reach USD 784.40 Billion by 2035, growing at a 19.44% CAGR. Renewable energy integration and long-duration storage procurement drive growth, with Asia-Pacific leading at approximately 42% share and Lithium-Ion at approximately 82%.
Download Free Sample PDF
Base Year (2025)
$89.04 Billion
Forecast (2035)
$784.40 Billion
CAGR (2026-2035)
19.4%
Top Region
Asia-Pacific

What Is the Grid Scale Battery Market Size?
The global grid scale battery market size was valued at USD 89.04 billion in 2025 and is estimated at USD 158.57 billion in 2026, forecast to reach USD 784.40 billion by 2035, expanding at a 19.44% CAGR between 2026 and 2035. Asia-Pacific leads with approximately 42% share, while Lithium-Ion dominates all other battery chemistry categories with approximately 82% share.

We observed that growth is accelerating across every segmentation axis, with renewable energy integration mandates and expanding long-duration storage procurement driving the dominant structural shifts through 2035.

Grid Scale Battery Market Global Industry Analysis and Forecast (2026–2035) Revenue Forecast
Values in USD Billion

2025 $89.04 Billion
2025
2026 $158.57 Billion
2026
2027 $189.40 Billion
2027
2028 $226.21 Billion
2028
2029 $270.19 Billion
2029
2030 $322.72 Billion
2030
2031 $385.45 Billion
2031
2032 $460.38 Billion
2032
2033 $549.88 Billion
2033
2034 $656.78 Billion
2034
2035 $784.40 Billion
2035

Key Takeaways

By Battery Chemistry: Lithium-Ion held the largest share of approximately 82% (USD 73.01 billion) in 2025; Sodium-Ion is the fastest-growing sub-segment at 41.0% CAGR from 2026–2035.

By Duration: Medium Duration held the largest share of approximately 42% (USD 37.40 billion) in 2025; Long Duration is the fastest-growing sub-segment at 33.0% CAGR from 2026–2035.

By Connection Type: Front-of-Meter held the largest share of approximately 74% (USD 65.89 billion) in 2025 and is also the fastest-growing sub-segment at 28.0% CAGR from 2026–2035.

By Ownership Model: Utility-Owned held the largest share of approximately 46% (USD 40.96 billion) in 2025; Third-Party-Owned is the fastest-growing sub-segment at 29.0% CAGR from 2026–2035.

By Application: Renewable Energy Integration held the largest share of approximately 34% (USD 30.27 billion) in 2025; Backup Power and Grid Resilience is the fastest-growing sub-segment at 29.3% CAGR from 2026–2035.

By Installation Type: New Installation held the largest share of approximately 87% (USD 77.46 billion) in 2025; Retrofit is the fastest-growing sub-segment at 29.9% CAGR from 2026–2035.

By Component: Battery Cells and Modules held the largest share of approximately 58% (USD 51.64 billion) in 2025; Other Components is the fastest-growing sub-segment at 29.3% CAGR from 2026–2035.

Dominant Region: Asia-Pacific dominated with approximately 42% revenue share (USD 37.40 billion) in 2025.

Fastest-Growing Region: Middle East & Africa is expected to register the highest CAGR of 30.6% during 2026–2035.

Dominant Country: China led with approximately USD 19.45 billion in 2025.

Fastest-Growing Country: India and Argentina are tied as the fastest-growing countries at approximately 31.5% CAGR from 2026–2035.

Market Opportunity: The grid scale battery market is expected to create an absolute dollar opportunity of USD 625.83 billion between 2026 and 2035, presenting significant investment potential across long-duration flow battery capacity and renewable-integrated storage infrastructure.

According to NMSC analysis, developers are increasingly pairing grid scale battery procurement directly with renewable generation capacity contracts, a shift that favors integrators with proven multi-gigawatt-hour delivery track records over component-only suppliers as utilities and independent power producers prioritize single-source accountability for system performance guarantees through 2035.

What Does the Grid Scale Battery Market Encompass?
The grid scale battery market encompasses battery energy storage systems deployed by utilities, independent power producers, and grid operators to store electricity for renewable integration, frequency regulation, peak shaving, and transmission and distribution deferral. Our assessment indicates that scope spans lithium-ion, flow, sodium-ion, and lead-acid chemistries packaged into containerized systems with power conversion and battery management components, installed as new front-of-meter and behind-the-meter capacity or retrofitted into existing substations. The market has evolved from short-duration frequency-response applications into a core grid-planning asset class, propelled by accelerating renewable capacity additions that require dispatchable storage to firm intermittent solar and wind generation.
Regulatory frameworks including the U.S. Federal Energy Regulatory Commission's Order 841, which requires grid operators to allow energy storage participation in wholesale electricity markets, and the European Union's Electricity Market Design reforms continue to shape procurement and market-access rules for grid scale battery projects. We observed that technology adoption is shifting toward longer-duration systems and lithium iron phosphate chemistry that improves thermal stability and cycle life relative to earlier nickel-based formulations. NMSC's analysis indicates that this structural shift, combined with expanding utility-scale procurement mandates, is redefining competitive positioning across the grid scale battery market.

Market Drivers & Dynamics

Interactive Dataset
Accelerating renewable capacity additions requiring dispatchable storage firming driver +4.8% Global 2026-2035
Expanding wholesale market access rules for storage participation driver +3.2% North America, Europe 2026-2035
Rising gigafactory-scale manufacturing capacity reducing per-unit costs driver +2.6% Asia-Pacific, North America 2026-2035
Growing utility resource-adequacy mandates for long-duration storage driver +2.1% North America, Asia-Pacific 2026-2035
Expanding grid modernization investment in emerging markets driver +1.5% Middle East & Africa, Latin America 2026-2035
Rising retrofit demand at aging substations and generation sites driver +0.9% Global 2026-2032
Critical mineral supply constraints affecting battery cell costs restraint -1.8% Global 2026-2032
Interconnection queue backlogs delaying project commissioning restraint -1.3% North America 2026-2032
Fire-safety and permitting complexity for large-scale installations restraint -0.8% North America, Europe 2026-2032
Currency volatility and financing cost exposure in emerging markets restraint -0.6% Latin America, Middle East & Africa 2028-2035
Source: Next Move Strategy Consulting

Growth Drivers

What Is the Primary Growth Driver of the Grid Scale Battery Market?

Accelerating renewable capacity additions requiring dispatchable storage firming is the primary driver of the market. The U.S. Energy Information Administration continues to report that solar and wind account for the majority of new U.S. generating capacity additions, creating a structural need for storage that can shift intermittent output to periods of peak demand. We observed that this renewable buildout, reinforced by expanding gigafactory-scale battery manufacturing capacity, continues to anchor procurement of front-of-meter storage paired directly with new generation projects.

How Is Wholesale Market Access Driving Grid Scale Battery Market Growth?
Expanding wholesale market access rules are accelerating market growth by allowing storage assets to earn revenue across multiple grid services rather than a single application. The U.S. Federal Energy Regulatory Commission's Order 841 requires regional grid operators to establish participation models for storage resources in capacity, energy, and ancillary service markets. Our assessment indicates that this market-access expansion, combined with rising utility resource-adequacy mandates, is compressing project payback periods relative to prior single-revenue-stream storage deployments.

Growth Inhibitors

What Is Restraining Grid Scale Battery Market Expansion?

Critical mineral supply constraints restrain market expansion by exposing battery cell costs to volatility in lithium, nickel, and cobalt markets. The U.S. Geological Survey continues to document supply concentration risk across several battery-critical minerals sourced from a limited number of producing countries. We found that this supply exposure disproportionately affects smaller developers with limited long-term procurement contracts, as they face greater cost volatility than vertically integrated manufacturers with direct mineral sourcing agreements.

Segmentation Analysis

2025 (USD Billion)
2035 (USD Billion)
Lithium-Ion 2025: $73.01 Billion | 2035: $576.53 Billion
Lithium-Ion
Flow Battery 2025: $7.12 Billion | 2035: $105.89 Billion
Flow Battery
Sodium-Ion 2025: $2.67 Billion | 2035: $58.83 Billion
Sodium-Ion
Lead-Acid 2025: $3.56 Billion | 2035: $15.69 Billion
Lead-Acid
Other Chemistries 2025: $2.68 Billion | 2035: $27.46 Billion
Other Chemis
Lithium-Ion $73.01 Billion $576.53 Billion 25.8%
Flow Battery $7.12 Billion $105.89 Billion 35.0%
Sodium-Ion $2.67 Billion $58.83 Billion 41.0%
Lead-Acid $3.56 Billion $15.69 Billion 17.9%
Other Chemistries $2.68 Billion $27.46 Billion 29.5%

Which Battery Chemistry Segment Dominates the Grid Scale Battery Market?

Lithium-Ion led the market with USD 73.01 billion in 2025, supported by its established manufacturing scale, favorable energy density, and the extensive gigafactory capacity that leading cell producers have already dedicated to stationary storage products. We observed that Sodium-Ion is the fastest-growing chemistry segment, expanding at a 41.0% CAGR from 2026 to 2035, as manufacturers commercialize sodium-based cells that avoid lithium and cobalt supply exposure for cost-sensitive, less energy-density-constrained grid applications.

2025 (USD Billion)
2035 (USD Billion)
Lithium-Ion
Flow Battery
Sodium-Ion
Lead-Acid
Other Chemis
Segment Item 2025 (USD Billion) 2035 (USD Billion) CAGR
Lithium-Ion $10.0 USD Billion $40.0 USD Billion 25.0%
Flow Battery $17.1 USD Billion $51.1 USD Billion 11.0%
Sodium-Ion $24.2 USD Billion $62.2 USD Billion 25.0%
Lead-Acid $31.3 USD Billion $73.3 USD Billion 11.0%
Other Chemistries $38.4 USD Billion $84.4 USD Billion 16.0%

Segment-wise data is locked

Unlock complete segment-wise numbers for By Duration.

Unlock Full Data
2025 (USD Billion)
2035 (USD Billion)
Lithium-Ion
Flow Battery
Sodium-Ion
Lead-Acid
Other Chemis
Segment Item 2025 (USD Billion) 2035 (USD Billion) CAGR
Lithium-Ion $10.0 USD Billion $40.0 USD Billion 27.0%
Flow Battery $17.1 USD Billion $51.1 USD Billion 9.0%
Sodium-Ion $24.2 USD Billion $62.2 USD Billion 19.0%
Lead-Acid $31.3 USD Billion $73.3 USD Billion 17.0%
Other Chemistries $38.4 USD Billion $84.4 USD Billion 18.0%

Segment-wise data is locked

Unlock complete segment-wise numbers for By Connection Type.

Unlock Full Data
2025 (USD Billion)
2035 (USD Billion)
Lithium-Ion
Flow Battery
Sodium-Ion
Lead-Acid
Other Chemis
Segment Item 2025 (USD Billion) 2035 (USD Billion) CAGR
Lithium-Ion $10.0 USD Billion $40.0 USD Billion 14.0%
Flow Battery $17.1 USD Billion $51.1 USD Billion 24.0%
Sodium-Ion $24.2 USD Billion $62.2 USD Billion 22.0%
Lead-Acid $31.3 USD Billion $73.3 USD Billion 12.0%
Other Chemistries $38.4 USD Billion $84.4 USD Billion 27.0%

Segment-wise data is locked

Unlock complete segment-wise numbers for By Ownership Model.

Unlock Full Data
2025 (USD Billion)
2035 (USD Billion)
Lithium-Ion
Flow Battery
Sodium-Ion
Lead-Acid
Other Chemis
Segment Item 2025 (USD Billion) 2035 (USD Billion) CAGR
Lithium-Ion $10.0 USD Billion $40.0 USD Billion 24.0%
Flow Battery $17.1 USD Billion $51.1 USD Billion 22.0%
Sodium-Ion $24.2 USD Billion $62.2 USD Billion 20.0%
Lead-Acid $31.3 USD Billion $73.3 USD Billion 22.0%
Other Chemistries $38.4 USD Billion $84.4 USD Billion 13.0%

Segment-wise data is locked

Unlock complete segment-wise numbers for By Application.

Unlock Full Data
2025 (USD Billion)
2035 (USD Billion)
Lithium-Ion
Flow Battery
Sodium-Ion
Lead-Acid
Other Chemis
Segment Item 2025 (USD Billion) 2035 (USD Billion) CAGR
Lithium-Ion $10.0 USD Billion $40.0 USD Billion 23.0%
Flow Battery $17.1 USD Billion $51.1 USD Billion 9.0%
Sodium-Ion $24.2 USD Billion $62.2 USD Billion 19.0%
Lead-Acid $31.3 USD Billion $73.3 USD Billion 13.0%
Other Chemistries $38.4 USD Billion $84.4 USD Billion 10.0%

Segment-wise data is locked

Unlock complete segment-wise numbers for By Installation Type.

Unlock Full Data
2025 (USD Billion)
2035 (USD Billion)
Lithium-Ion
Flow Battery
Sodium-Ion
Lead-Acid
Other Chemis
Segment Item 2025 (USD Billion) 2035 (USD Billion) CAGR
Lithium-Ion $10.0 USD Billion $40.0 USD Billion 21.0%
Flow Battery $17.1 USD Billion $51.1 USD Billion 23.0%
Sodium-Ion $24.2 USD Billion $62.2 USD Billion 25.0%
Lead-Acid $31.3 USD Billion $73.3 USD Billion 15.0%
Other Chemistries $38.4 USD Billion $84.4 USD Billion 16.0%

Segment-wise data is locked

Unlock complete segment-wise numbers for By Component.

Unlock Full Data

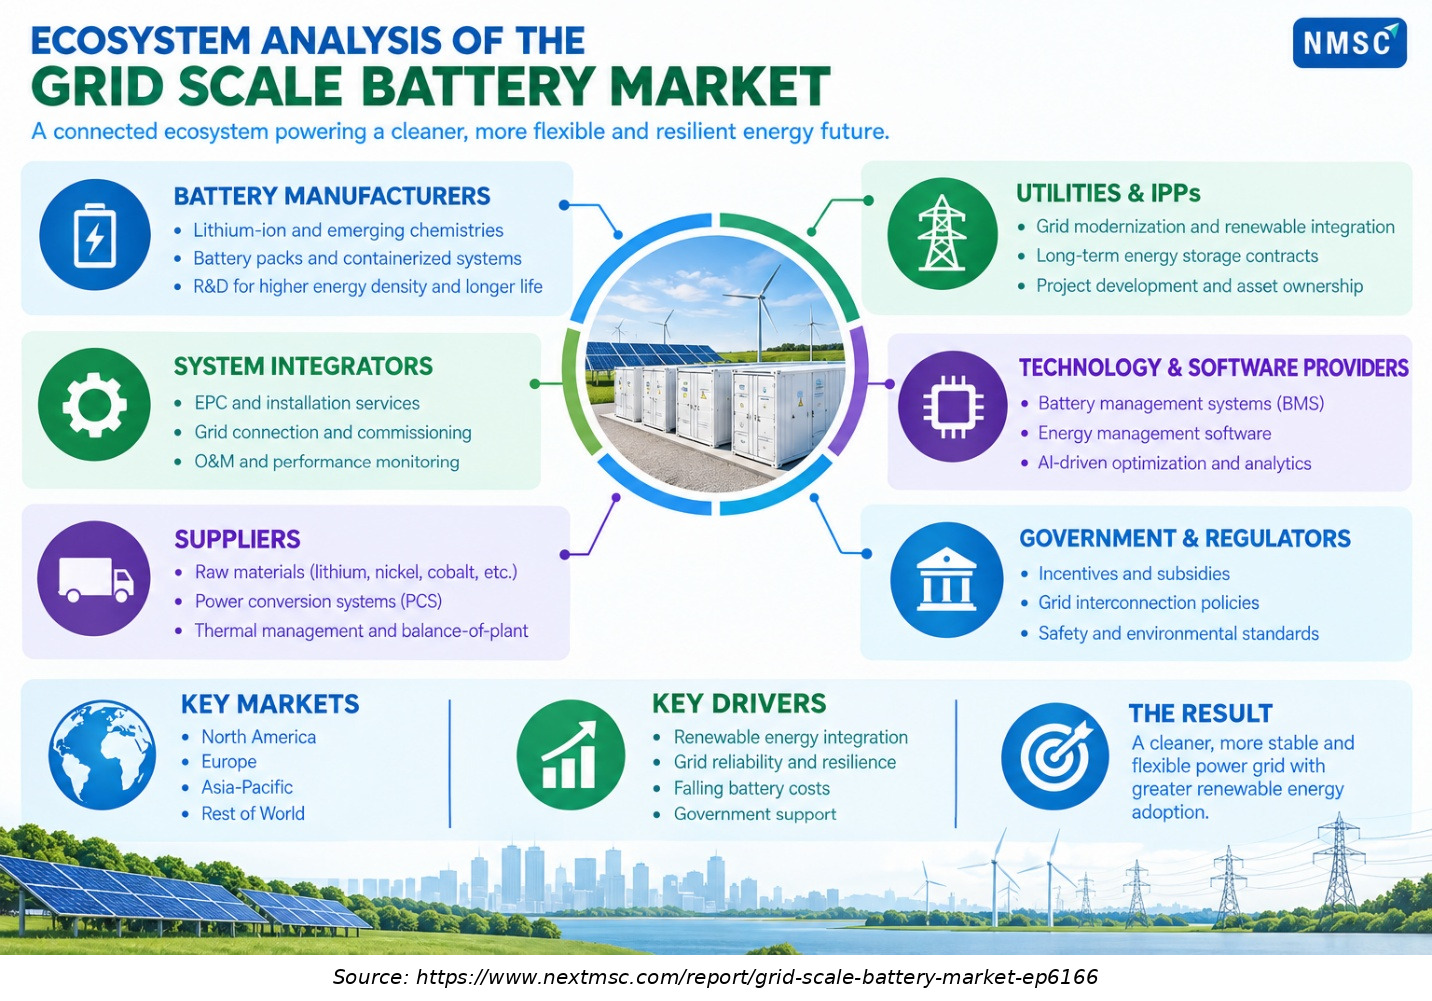
Ecosystem Analysis of the Grid Scale Battery Market

The grid scale battery market comprises battery manufacturers, component suppliers, system integrators, utilities, independent power producers, technology providers, and regulators. This interconnected ecosystem supports energy storage deployment, renewable integration, and grid modernization. Growing demand for flexible power systems, declining battery costs, software-driven optimization, and supportive policies are strengthening collaboration across the global value chain.

Growth Opportunities

Our analysis shows that three forward-looking opportunities stand out for stakeholders positioning within the grid scale battery market over the 2026-2035 forecast period.

How Can Long-Duration Chemistry Platforms Unlock Growth in Resource-Adequacy Procurement?

Long-duration storage platforms present a whitespace opportunity for manufacturers seeking to serve utility resource-adequacy mandates that lithium-ion alone cannot cost-effectively address beyond several hours of discharge. Companies that commercialize flow battery or sodium-ion systems optimized for eight-hour-plus discharge stand to capture recurring procurement revenue as grid operators formalize multi-day renewable-smoothing capacity requirements.

Where Does Retrofit Demand at Aging Substations Create New Demand?

Aging substations and thermal generation sites nearing retirement represent an underpenetrated opportunity as Retrofit is the fastest-growing installation type at a 29.9% CAGR through 2035. Developers that package storage retrofits with existing interconnection rights can accelerate project timelines relative to greenfield development, capturing recurring revenue from utilities seeking to preserve valuable grid connection points.

How Can Third-Party Ownership Models Accelerate Independent Power Producer Adoption?

Independent power producers and commercial site hosts seeking storage without upfront capital exposure create a growing opportunity for third-party ownership and storage-as-a-service structures. Providers that offer performance-guaranteed, third-party-financed storage agreements can secure long-term service contracts, benefiting from recurring revenue as Third-Party-Owned capacity grows at a 29.0% CAGR from 2026 to 2035.

Regional Outlook

2025 (USD Billion)
2035 (USD Billion)
North Americ
Europe
Asia-Pacific
Middle East
Latin Americ
Region 2025 (USD Billion) 2035 (USD Billion) CAGR (%)
North America $10.0 USD Billion $40.0 USD Billion 9.0%
Europe $17.1 USD Billion $51.1 USD Billion 27.0%
Asia-Pacific $24.2 USD Billion $62.2 USD Billion 25.0%
Middle East & Africa $31.3 USD Billion $73.3 USD Billion 23.0%
Latin America $38.4 USD Billion $84.4 USD Billion 12.0%

Regional data is locked

Unlock complete regional numbers for this market.

Unlock Full Data

Competitive Landscape

We observed that the grid scale battery market features a moderately consolidated competitive landscape, with vertically integrated cell manufacturers competing alongside system integrators and diversified energy conglomerates on delivery scale, product density, and project performance guarantees.

Dimension Description
Market Structure Moderately consolidated; cell manufacturers such as Contemporary Amperex Technology Co., Limited and BYD Company Limited compete alongside system integrators such as Fluence Energy, Inc. and Tesla, Inc., while diversified energy groups serve utility-scale project requirements.
Innovation Focus High-density containerized system architecture, lithium iron phosphate cell optimization, long-duration chemistry commercialization, and grid-forming inverter integration dominate current innovation pipelines across leading suppliers.
Supply Agreements and Manufacturing Partnerships Selective supply agreements and manufacturing partnerships, exemplified by cell producers signing long-term supply contracts with system integrators to localize production and qualify for regional incentive programs.

How Do Companies Compete in the Grid Scale Battery Market?

Companies compete primarily on delivered project scale, system energy density, and warranty-backed performance guarantees across the industry. Tesla, Inc. leverages its dedicated Megapack manufacturing capacity to shorten delivery lead times, while Fluence Energy, Inc. competes on integrated hardware, software, and service offerings that support long-term asset optimization for utilities and independent power producers seeking single-source accountability.

Which Competitive Archetypes Dominate the Grid Scale Battery Market?

Two archetypes dominate the market: vertically integrated cell manufacturers with captive production scale and cost advantages, and system integrators that assemble third-party cells into engineered, warrantied project solutions. Contemporary Amperex Technology Co., Limited and BYD Company Limited exemplify the vertically integrated archetype, while Fluence Energy, Inc. and Sungrow Power Supply Co., Ltd. exemplify the integrator archetype focused on system design, software, and long-term service.

How Are Companies Differentiating Through Innovation in Grid Scale Batteries?

Innovation and differentiation strategy increasingly center on system-level energy density and modular deployment speed rather than cell chemistry alone. Fluence Energy, Inc.'s eighth-generation Smartstack product, which began manufacturing at an automated facility in Vietnam during fiscal 2025, illustrates how integrators are redesigning enclosures to increase battery density and shorten site installation time. Our analysis shows that suppliers unable to demonstrate credible density and delivery-speed advantages risk losing tender competitiveness against better-integrated rivals.

What Supply and Expansion Activity Is Shaping the Grid Scale Battery Market?

Long-term supply agreements and localized manufacturing partnerships continue to shape competitive positioning within the industry more than traditional acquisitions. LG Energy Solution, Ltd.'s agreement to supply lithium iron phosphate cells for Tesla, Inc.'s Megapack production illustrates how integrators are diversifying cell sourcing beyond a single supplier, while cell manufacturers expand geographically diversified production footprints to qualify for regional domestic-content incentive programs.

Key Market Players

Our assessment indicates that the following 20 companies are actively shaping product innovation, manufacturing capacity, and project delivery strategy within the global grid scale battery market.

Contemporary Amperex Technology Co., Limited BYD Company Limited Tesla, Inc. Fluence Energy, Inc. LG Energy Solution, Ltd. Samsung SDI Co., Ltd. Sungrow Power Supply Co., Ltd. EVE Energy Co., Ltd. Hithium Energy Storage Technology Co., Ltd. Trina Solar Co., Ltd. Wärtsilä Corporation General Electric Company Siemens Energy AG Hitachi, Ltd. Powin, LLC NHOA S.p.A. TotalEnergies SE Toshiba Corporation Panasonic Holdings Corporation ESS Tech, Inc.

Latest Developments

We found that recent developments within the grid scale battery market are concentrated on utility-scale project deployments, BESS supply agreements, strategic partnerships, and stationary-storage manufacturing capacity expansion.

Date Event
September 2026 Sungrow announced successful grid connection and full acceptance testing of the 108.4 MW/215.6 MWh Cambodia EDC Kandal Stueng BESS on September 29, 2026. The project uses grid-forming technology and black-start capability, demonstrating utility-scale storage applications for voltage and frequency stability and coordination with hydro and thermal generation.
September 2026 Trina Storage announced selection as BESS supplier for Stage One of the Waroona Renewable Energy Project in Western Australia on September 14, 2026. The project pairs 132 MW solar with an 81.5 MW, 6.9-hour BESS, expanding utility-scale storage deployment and demonstrating Trina’s positioning in long-duration solar-plus-storage projects.
August 2026 CATL announced a strategic partnership with Moura on August 25, 2026, to jointly participate in Brazil’s Capacity Reserve Auction for Energy Storage. The collaboration combines CATL’s large-scale storage portfolio with Moura’s local capabilities, supporting market entry and localized project development as Brazil establishes procurement mechanisms for grid storage.
August 2026 Fluence and LEAG Clean Power began construction of the 400 MWh Heinersbrück GridBattery in Germany on August 13, 2026. Co-located with wind and solar assets, the project uses Fluence Smartstack technology and is designed to strengthen supply security, reduce grid pressure, and support renewable integration through utility-scale storage.
August 2026 HiTHIUM signed a BESS supply agreement with Global Power Generation on August 12, 2026, covering 421 MWh for the Fraser Coast project in Queensland, Australia. HiTHIUM will provide 84 liquid-cooled units plus design, manufacturing, commissioning, technical support, and training, expanding its utility-scale project delivery presence in Australia.

Investment Opportunities

What Capital Inflows Are Targeting the Grid Scale Battery Market?

Capital inflows into the grid scale battery market are increasingly directed toward dedicated stationary-storage manufacturing capacity and next-generation high-density system platforms. Tesla, Inc.'s Shanghai Megafactory and Fluence Energy, Inc.'s Smartstack manufacturing expansion in Vietnam illustrate sustained capital commitment behind delivery-scale capacity. We observed that investors favor integrators demonstrating record backlog coverage, viewing contracted revenue visibility as a proxy for resilience against policy and tariff uncertainty.

How Is Infrastructure Investment Supporting Grid Scale Battery Delivery?

Infrastructure investment is expanding dedicated cell and system manufacturing capacity to reduce reliance on electric-vehicle production lines for grid-storage supply. Our findings suggest that manufacturers are investing in gigafactory-scale facilities purpose-built for stationary storage products, supporting the delivery scale required as utilities and independent power producers commit to multi-gigawatt-hour procurement programs through 2035.

What ESG Considerations Are Shaping Grid Scale Battery Investment Decisions?

Environmental, social, and governance considerations increasingly shape investment decisions, with battery end-of-life recycling, critical mineral sourcing transparency, and fire-safety compliance as key criteria. Manufacturers increasingly disclose supply-chain traceability and recycling-program participation as governance indicators. We found that investors increasingly favor manufacturers demonstrating measurable responsible-sourcing outcomes, treating it as a governance indicator alongside product safety certification.

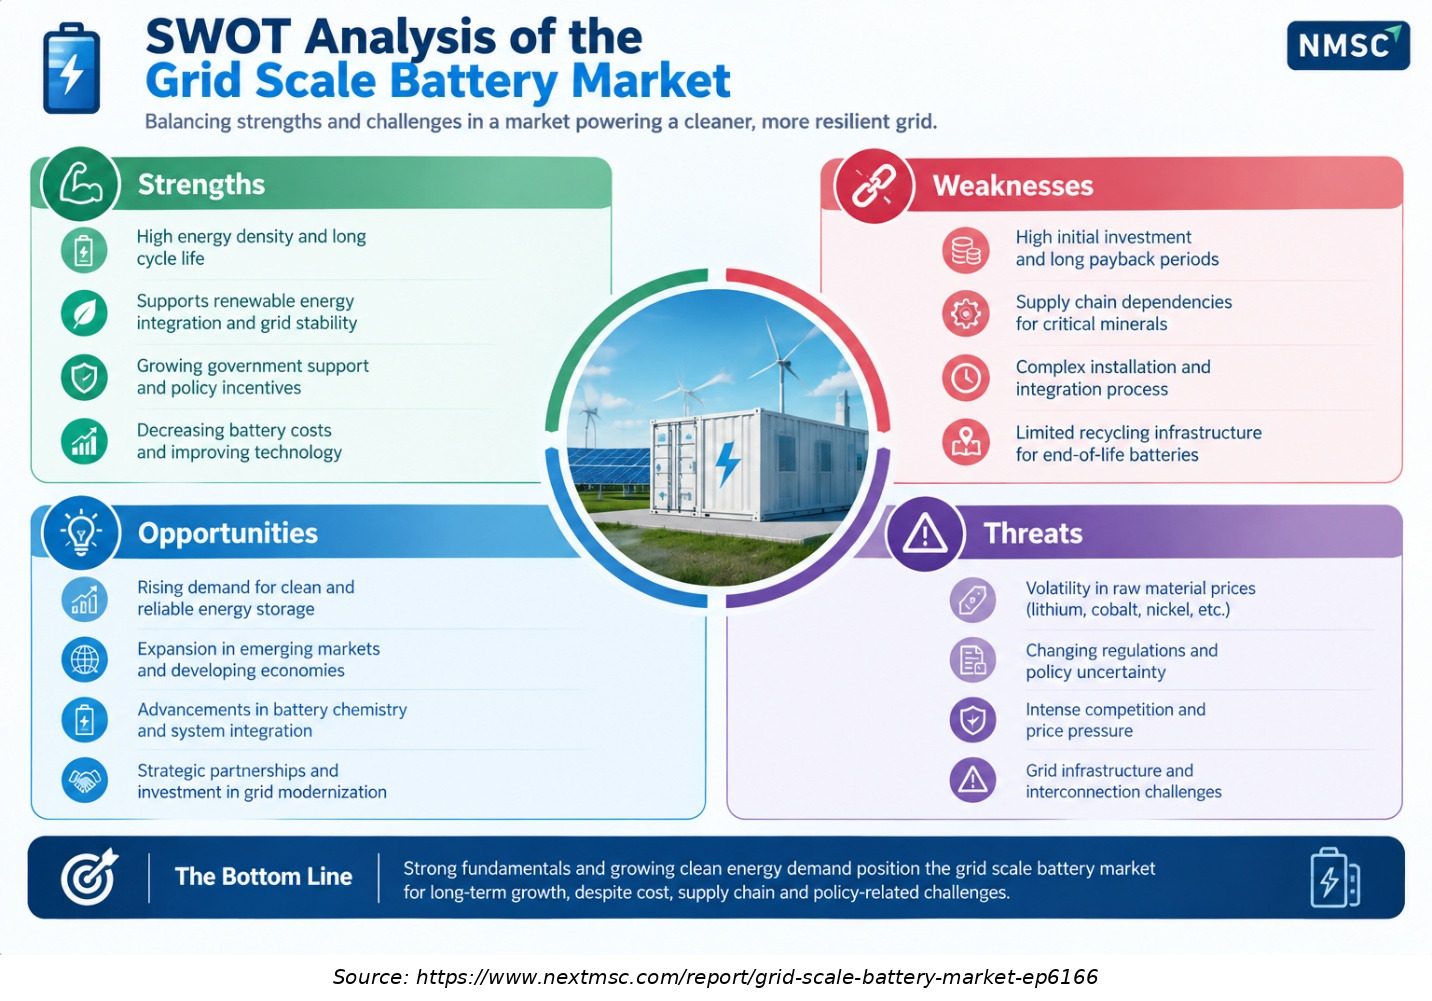
SWOT Analysis

This SWOT view highlights structural strengths, strategic gaps, expansion headroom, and external risks shaping outcomes in the Grid Scale Battery Market Global Industry Analysis and Forecast (2026–2035).

Strengths

The grid scale battery market benefits from improving energy density, longer cycle life, declining technology costs, and rising renewable energy integration.

Weaknesses

However, high upfront investment, critical mineral dependencies, recycling limitations, and complex grid integration remain important considerations.

Opportunities

Opportunities include emerging-market deployment and technology advances.

Threats

Raw-material volatility, policy changes, competitive pressure, and infrastructure constraints continue shaping market dynamics.

Key Benefits for Stakeholders

How Does This Report Benefit Enterprise and Industry Leaders?

Enterprise and industry leaders gain access to validated segmentation, competitive benchmarking, and regional demand forecasts that support sourcing and portfolio decisions across the grid scale battery industry. Our analysis shows that detailed chemistry, duration, and application breakdowns help utility and developer procurement teams align system specifications with resource-adequacy requirements while identifying underserved application categories for portfolio expansion.

How Does This Report Benefit Investors and Financial Analysts?

Investors and financial analysts benefit from consistent, single-point market size and CAGR estimates that support valuation and capital-allocation decisions across the grid scale battery supply chain. We observed that the report's regional and segment-level growth differentials help identify which manufacturers are best positioned to capture above-market growth in long-duration and Middle East & Africa categories through 2035.

How Does This Report Benefit Technology Vendors and Product Teams?

Technology vendors and product teams gain insight into emerging design requirements, including high-density modular architecture, long-duration chemistry platforms, and grid-forming inverter capability, that are reshaping the industry. Our findings suggest that this analysis helps product roadmap teams prioritize investment around chemistry diversification and delivery-speed improvements increasingly required by utility procurement processes.

Key Market Segments Evaluated

By Battery Chemistry

  • Lithium-Ion
  • Flow Battery
  • Sodium-Ion
  • Lead-Acid
  • Other Chemistries

By Duration

  • Short Duration
  • Medium Duration
  • Long Duration

By Connection Type

  • Front-of-Meter
  • Behind-the-Meter

By Ownership Model

  • Utility-Owned
  • Independent Power Producer-Owned
  • Third-Party-Owned

By Application

  • Renewable Energy Integration
  • Frequency Regulation
  • Peak Shaving and Energy Arbitrage
  • Transmission and Distribution Deferral
  • Backup Power and Grid Resilience
  • Other Applications

By Installation Type

  • New Installation
  • Retrofit

By Component

  • Battery Cells and Modules
  • Power Conversion System
  • Battery Management System
  • Other Components

By Region

  • North America 
    • U.S.
    • Canada
    • Mexico
  • Europe 
    • UK
    • Germany
    • France
    • Italy
    • Spain
    • Sweden
    • Denmark
    • Finland
    • Netherlands
    • Rest of Europe
  • Asia-Pacific 
    • China
    • India
    • Japan
    • South Korea
    • Taiwan
    • Indonesia
    • Vietnam
    • Australia
    • Philippines
    • Malaysia
    • Rest of APAC
  • Middle East & Africa 
    • Saudi Arabia
    • UAE
    • Egypt
    • Israel
    • Turkey
    • Nigeria
    • South Africa
    • Rest of MEA
  • Latin America 
    • Brazil
    • Argentina
    • Chile
    • Colombia
    • Rest of LATAM

Conclusion & Recommendations

The long-term outlook for the market remains highly positive, with global revenue projected to expand nearly ninefold from USD 89.04 billion in 2025 to USD 784.40 billion by 2035 at a 19.44% CAGR. We observed that sustained renewable capacity additions, expanding wholesale market access, and rising long-duration storage procurement will continue underpinning growth across front-of-meter and behind-the-meter categories through the forecast period.

What Strategic Positioning Should Grid Scale Battery Manufacturers Pursue?

Manufacturers should prioritize chemistry diversification and dedicated stationary-storage manufacturing capacity while pursuing localized production partnerships to secure durable utility and independent power producer relationships. Our assessment indicates that manufacturers investing early in long-duration platforms and high-density modular system architecture will be best positioned to capture premium pricing within the grid scale battery market.

How Attractive Is the Grid Scale Battery Market for New Investment?

The grid scale battery industry presents a highly attractive investment case, supported by a USD 625.83 billion absolute dollar opportunity between 2026 and 2035 and above-average growth in Middle East & Africa and sodium-ion technology categories. We found that investment attractiveness is highest for manufacturers combining vertically integrated cell production with system-level engineering capability, positioning them to serve both utility-scale and distributed storage segments simultaneously.

What Market Shifts and Key Risks Should Stakeholders Monitor?

Stakeholders should monitor critical mineral supply constraints, interconnection queue backlogs, and fire-safety permitting complexity as key risks to the grid scale battery market. Our analysis shows that manufacturers unable to demonstrate credible supply-chain resilience and safety compliance risk losing project awards to competitors with diversified sourcing and established safety track records, particularly within North America's increasingly capacity-constrained interconnection environment.

What Are the Key Growth Pathways for the Grid Scale Battery Market?

Key growth pathways include expanding long-duration chemistry capability, scaling dedicated stationary-storage manufacturing capacity, and deepening penetration into retrofit and third-party ownership categories. NMSC's analysis indicates that manufacturers pursuing these pathways while maintaining cost competitiveness in core lithium-ion categories will be best positioned to capture the grid scale battery market's projected growth through 2035.

FAQs

About the Author

Mihul Sharma

Mihul Sharma

Mihul Sharma is Research Associate at Next Move Strategy Consulting, where he has covered technology, industrial, and healthcare markets for 3 years. His work applies structured business research, market analysis, and secondary-source review to assess market trends, competitive developments, and growth opportunities. He supports report development by fully synthesizing industry data, company information, and market signals into concise findings for strategy and investment-focused research teams.

About the Reviewer

Supradip Baul

Supradip Baul

Supradip Baul is an accomplished business consultant and strategist with over a decade of rich experience in market intelligence, strategy, technology, and business transformation. His work has included rigorous qualitative and quantitative analysis across multiple industries, helping clients shape investment decisions and long-term roadmaps. Earlier in his career, he was associated with Gartner, where he contributed to industry-leading reports and market share analyses. He has worked with leading global companies and holds an MBA with a dual specialization in Marketing and Finance.

Download Free Sample

Robert Sean Trevino

ROBERT SEAN TREVINO

Sr. Director, Head of Strategic Insights & Analytics

Foundation Medicine

I realized that it was a reliable source of information. These days, there are many people who are looking for authentic data, and this is one of the only sources that can offer them with what they need;

Mohit Agarwal

MOHIT AGARWAL

Chief Manager

DryChem India Pvt. Ltd.

Next Move Strategy Consulting is an amazing team of consultants. We required a market study report for our investors on top priority and the team went above and beyond our expectations to deliver the same with ample supporting data within a short time span enabling us to secure the investments and keep our project timeline maintained. Their professionalism, attention to detail, and timely delivery of actionable recommendations have left a lasting impression on our organization.

Diana Trejo

DIANA TREJO

Assistant Manager

Sumitomo Corporation de Mexico, S.A. de C.V.

Recently, we purchased a report on the Mexico Data Center Market from Next Move Strategy Consulting. The service has been excellent, with support that is always timely and thoroughly professional. The information provided is interesting, highly useful, and delivered with clarity. I would highly recommend NextMSC for anyone seeking insightful and dependable analysis.

Pratyush Kumar Das

PRATYUSH KUMAR DAS

Assistant Manager

Polycab India Limited

We would like to express our appreciation for the data and insights provided by nextmsc. We are very pleased with the quality and depth of the information, which has proven to be highly valuable and beneficial for our business decision-making.

Gaurav Jaiswal

GAURAV JAISWAL

Founder & CEO

Yano Charge Private Limited

The EV Charging market research report provided by the NextMSC was exceptionally detailed and insightful. It offered a comprehensive analysis that proved to be a game-changer for our strategic planning. Truly a testament to the NextMSC’s expertise and thoroughness in EV market landscape & analysis.

Custom Market Research Services

We will customize the research for you if the listed report does not fully match your requirements.

Get 30% Free Customization

Select License

This website uses cookies to ensure you get the best experience on our website. Learn more

✖