Hemodialysis Market by Product & Service (Equipment, Consumable, Drug, Service), Type (Conventional, Daily, Nocturnal), End User (In-Center Dialysis, Home Dialysis) - Global Opportunity Analysis and Industry Forecast, 2020 – 2030

Hemodialysis Market

Industry:  Life Sciences & Healthcare | Publish Date: Jul 2020 | No of Pages:  357 | No. Tables:  202 | No. Figures:  172

Market Definition:

The global Hemodialysis Market size was valued at USD 78.30 billion in 2019, and is predicted to hit USD 116.66 billion by 2030, witnessing a CAGR of 3.60% from 2020-2030.

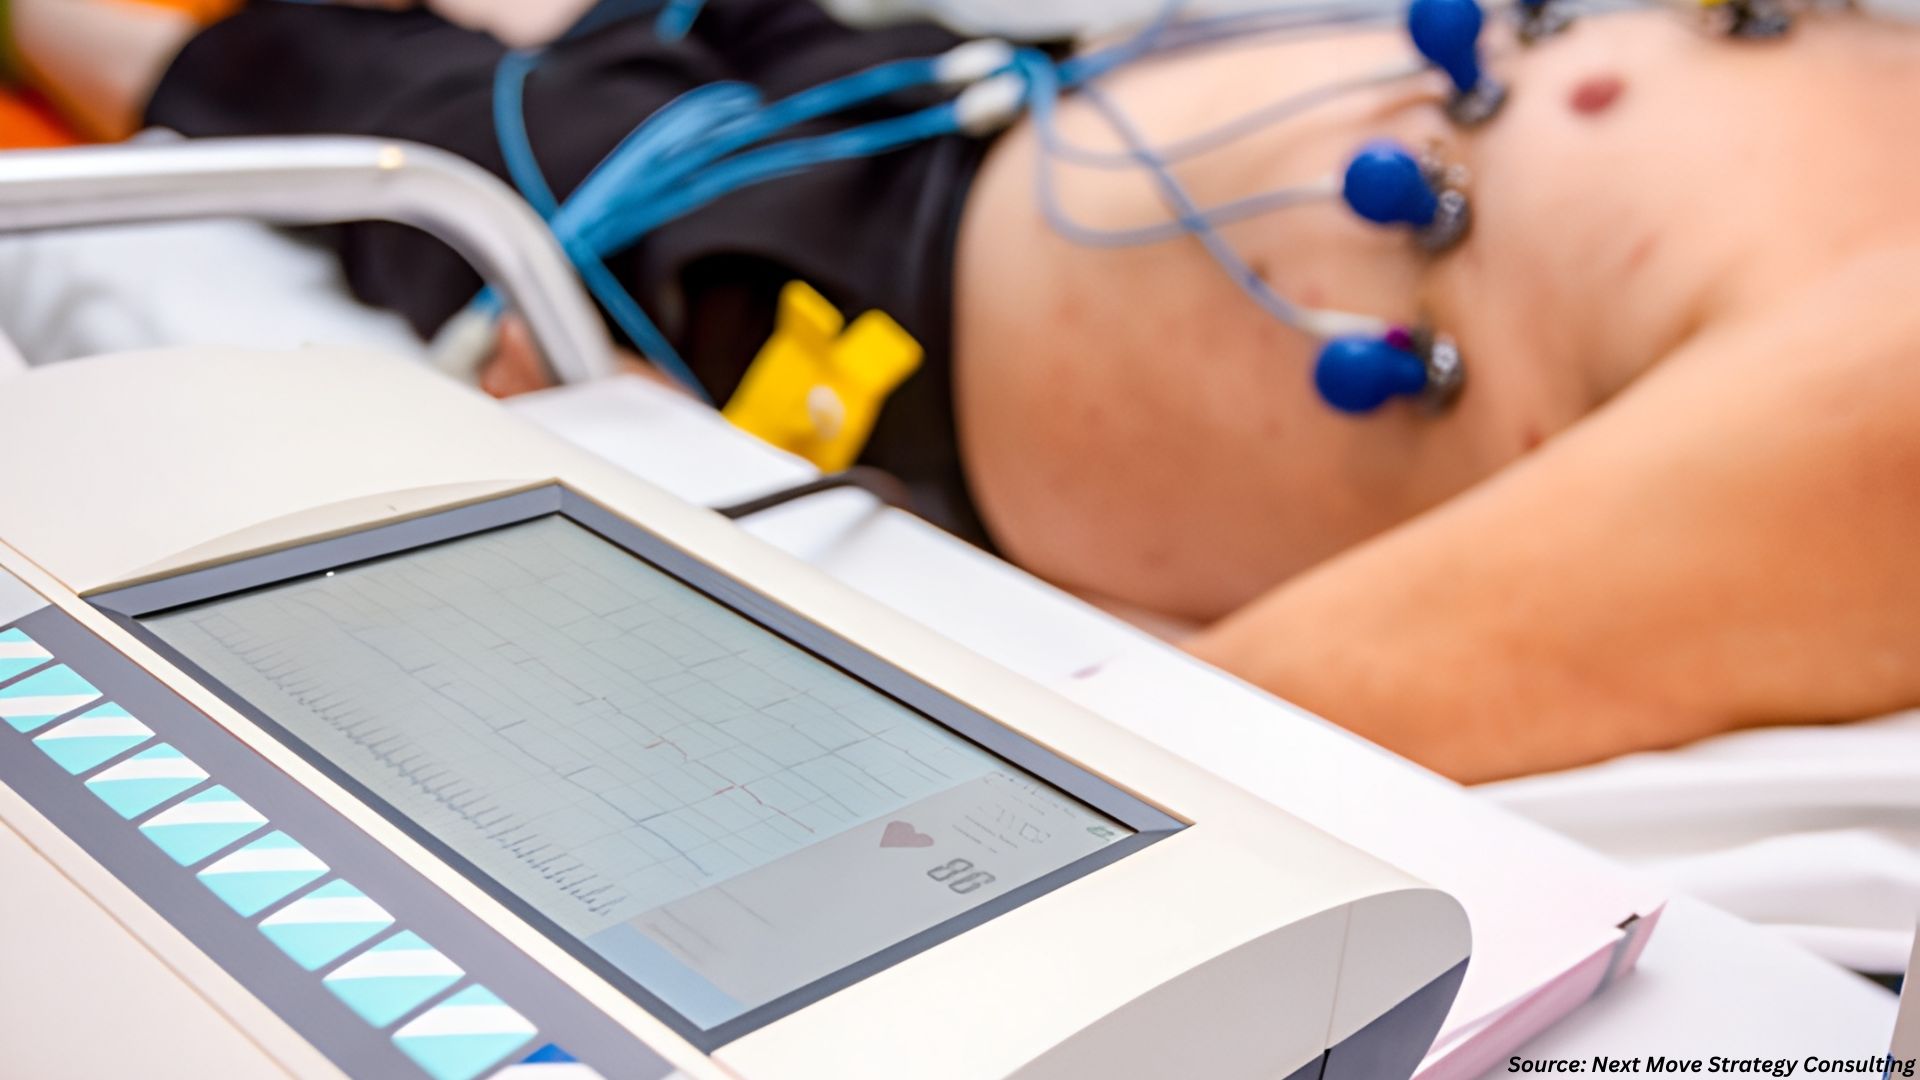
Hemodialysis is an extra-corporeal renal replacement procedure that aids blood purification by removing of toxins, creatinine, urea, and excess water from blood, utilizing an artificial membrane, hence maintaining the electrolyte balance of the blood.

At the point when kidney functioning goes below 10%-15%, it is unable to filter blood naturally. This enables the toxins to develop in the body alongside excess fluid. Hemodialysis helps evacuate these toxins and is an effective treatment for end-stage renal disease. It is performed at a frequency of 3 times per week, 6 days per week or 3-6 nights per week based on the condition of the patient.

Hemodialysis is performed using a hemodialyzer in hospitals or dialysis centers, and it may be an in-patient or an out-patient treatment. It is used in the treatment of chronic kidney disease, and acute renal injury, for those expecting a kidney transplant or as a permanent measure in cases where a kidney transplant is not advisable.

Market Dynamics and Trends:

According to the data reported by World Health Organization, 2.62 million people received  in 2010, and the need for dialysis is projected to double by the year 2030. This scenario is propagating the growth of the global hemodialysis market.

Besides, factors such as increasing incidences of renal dysfunction, kidney failures, chronic kidney disease and growing number of end-stage renal disease (ESRD) patients, are likely to propel the growth of the hemodialysis market throughout the forecast period.

Furthermore, increased occurrence of diabetes and hypertension, as well as shortage of kidney donors, are increasing the demand for hemodialysis treatment, hence supplementing the growth of the hemodialysis market.

However, high-cost of the treatment, risks & complications associated with dialysis procedure and product recall are the factors hampering the growth of the hemodialysis market.

Moreover, higher investments in R&D activities, increase in funding for better dialysis products and services, as well as the technological advancements leading to better adoption and growth opportunities in emerging economies shall create lucrative opportunities for growth in the global hemodialysis market in coming future.


Market Segmentations and Scope of the Study:

The hemodialysis market share has been analyzed on product & service, type, end user, and geography.

Based on product & service, the market is segmented into equipment, consumable, drug, and service. Based on type, the market covers conventional, daily, and nocturnal. Based on the end user, the market is classified into in-center dialysis and home dialysis. Geographic breakdown and analysis of each of the previously mentioned segments include regions comprising North America, Europe, Asia-Pacific, and RoW.


Geographical Analysis:

North America region demonstrates higher adoption of hemodialysis treatment, hence it is expected to dominate the global hemodialysis market, accounting for the highest market share, throughout the forecast period. This is due to presence of well-established healthcare-infrastructure, presence of key market players, introduction to new technologies & innovations as well as higher prevalence of kidney diseases in this region.

Asia Pacific region is expected to grow with the highest CAGR values in the global hemodialysis market throughout the forecast period, owing to higher investments in R&D activities, increasing awareness in diagnosis of kidney diseases at an early stage, and untapped market opportunities in the emerging economies present in this region.


Competitive Landscape:

Comprehensive competitive analysis and profiles of the major market players such as Asahi Kasei Corporation, Cantel Medical Corp., DaVita, Inc., Diaverum, Fresenius Medical Care AG & Co. KGaA, Nikkiso Co., Ltd., B. Braun Melsungen AG, Baxter International, Inc., Nipro Corporation, NxStage Medical, Inc., and others are provided in the hemodialysis industry report.

An upsurge in R&D activities, advancement in product technologies along with new product launches, expansions, and acquisitions by the key players, is leading the healthcare infrastructure to new heights, thereby creating lucrative opportunities in the global hemodialysis market.

For instance, in October 2019, one of the key players of the global Hemodialysis market, Diaverum announced its acquisition over INEDI (Instituto de Nefrologia e Diálise Ltda), based in Taboão da Serra in greater São Paulo, Brazil. With this, Diaverum plans to operate its eight renal care centers, treating more than 3,000 patients in Brazil. INEDI is a well-known renal care center with proven record of accomplishment for high treatment volume, strict quality standards, along with commitment & innovation for the patients. This acquisition reinforces Diaverum’s strategy to acquire high-standard treatment centers in the market with potential for continued growth, hence contributing to the local nephrologist community in providing finest renal care to the patients.

Furthermore, in April 2020, the very well-known player of the global hemodialysis market, Baxter International Inc., announced its achievement of receiving emergency use authorization (EUA) from the U.S. FDA, for its ‘Oxiris filter set’ to treat patients suffering from novel corona disease, who are admitted to the intensive care unit (ICU), and are in need of continuous renal replacement therapy (CRRT). The patient’s blood flows into the Oxiris filter set, where endotoxin, cytokines, uremic toxins, and excess fluids are removed from the blood, and purified blood returns to the patient’s body. Oxiris is a multi-purpose filter set that can perform several blood-purification therapies at the same time, including cytokine removal and continuous renal replacement therapy.

Key Benefits:

  • The hemodialysis market report provides a quantitative analysis of the current market and estimations through 2020-2030 that assists in identifying the prevailing market opportunities to capitalize on.

  • The study comprises a deep dive analysis of the market trend including the current and future market trends for depicting the prevalent investment pockets in the market

  • The report provides detailed information related to key drivers, restraints, opportunities, and their impact on the market.

  • The report incorporates competitive analysis of the market players along with their market share and market size in the global market.

  • The SWOT analysis and Porters Five Forces model is elaborated in the study of global market.

  • Value chain analysis in the hemodialysis market study provides a clear picture of the stakeholders’ roles.

Hemodialysis Market Key Segments:

By Product & Service

  • Equipment

  • Consumable

  • Drug

  • Service

By Type

  • Conventional

  • Daily

  • Nocturnal

By Geography

  • North America

    • U.S.

    • Canada

    • Mexico

  • Europe

    • UK

    • Germany

    • France

    • Spain

    • Italy

    • Rest of Europe

  • Asia-Pacific

    • China

    • India

    • South Korea

    • Japan

    • Australia

    • Rest of Asia-Pacific

  • ROW

    • Saudi Arabia

    • South Africa

    • Brazil

    • Remaining Countries

REPORT SCOPE AND SEGMENTATION:

Parameters

Details

Analysis Period

2019–2030

Base Year Considered

2020

Forecast Period

2020–2030

Market Size Estimation

Billion (USD)

Market Segmentation

By Type (Conventional Hemodialysis, Short Daily Hemodialysis, Nocturnal Hemodialysis) By Product & Service (Equipment, Consumables, Drugs, Services)

Geographical Segmentation

North America (U.S., Canada, Mexico) Europe (UK, Germany, France, Italy, Spain, Rest of Europe), Asia-Pacific (China, Japan, India, Australia, South Korea, Rest of APAC), Rest of the World (Brazil, Saudi Arabia, South Africa, Remaining Countries)

Companies Profiled

Asahi Kasei Corporation, Cantel Medical Corp., DaVita, Inc., Diaverum, Fresenius Medical Care AG & Co. KGaA, Nikkiso Co., Ltd., B. Braun Melsungen AG, Baxter International, Inc., Nipro Corporation, NxStage Medical, Inc.

Test

1.   INTRODUCTION

1.1.           REPORT DESCRIPTION

1.2.           Research Methodology

1.2.1               Secondary Research

1.2.2               Data Analysis Framework

1.2.3               Market size estimation

1.2.4               Forecasting

1.2.5               Primary Research and Data Validation

2.  MARKET SNAPSHOT, 2019-2030 Million USD

2.1.           MARKET SNAPSHOT

3.  PORTER’S FIVE FORCE MODEL ANALYSIS

4.  MARKET DYNAMICS

4.1.           GROWTH DRIVERS

4.1.1               DRIVER 1

4.1.2               DRIVER 2

4.1.3               DRIVER 3

4.1.4               DRIVER 4

4.2.           CHALLENGES

4.2.1               CHALLENGE 1

4.2.2               CHALLENGE 2

4.3.           OPPORTUNITIES

4.3.1               OPPORTUNITY 1

4.3.2               OPPORTUNITY 2

5.  Global  Hemodailysis Market, By Type

5.1.           Overview

5.2.           Conventional Hemodialysis

5.2.1               Conventional Hemodialysis Market, By Region

5.2.1.1          North America Conventional Hemodialysis Market, By Country

5.2.1.2          Europe Conventional Hemodialysis Market, By Country

5.2.1.3          Asia-Pacific Conventional Hemodialysis Market, By Country

5.2.1.4          Rest of World Conventional Hemodialysis Market, By Country

5.3.           Short Daily Hemodialysis

5.3.1               Short Daily Hemodialysis Market, By Region

5.3.1.1          North America Short Daily Hemodialysis Market, By Country

5.3.1.2          Europe Short Daily Hemodialysis Market, By Country

5.3.1.3          Asia-Pacific Short Daily Hemodialysis Market, By Country

5.3.1.4          Rest of World Short Daily Hemodialysis Market, By Country

5.4.           Nocturnal Hemodialysis

5.4.1               Nocturnal Hemodialysis Market, By Region

5.4.1.1          North America Nocturnal Hemodialysis Market, By Country

5.4.1.2          Europe Nocturnal Hemodialysis Market, By Country

5.4.1.3          Asia-Pacific Nocturnal Hemodialysis Market, By Country

5.4.1.4          Rest of World Nocturnal Hemodialysis Market, By Country

6.   Global  Hemodailysis Market, By Product & Service

6.1.           Overview

6.2.           Equipment

6.2.1               Global Equipment Market, By Product & Service

6.2.1.1          Dialysis Machines Market, By Region

6.2.1.1.1          North America Dialysis Machines Market, By Country

6.2.1.1.2          Europe Dialysis Machines Market, By Country

6.2.1.1.3          Asia-Pacific Dialysis Machines Market, By Country

6.2.1.1.4          Rest of World Dialysis Machines Market, By Country

6.2.1.2          Hemodialysis Water Treatment Systems Market, By Region

6.2.1.2.1          North America Hemodialysis Water Treatment Systems Market, By Country

6.2.1.2.2          Europe Hemodialysis Water Treatment Systems Market, By Country

6.2.1.2.3          Asia-Pacific Hemodialysis Water Treatment Systems Market, By Country

6.2.1.2.4          Rest of World Hemodialysis Water Treatment Systems Market, By Country

6.2.1.3          Others Hemodialysis Equipment Market, By Region

6.2.1.3.1          North America Others Hemodialysis Equipment Market, By Country

6.2.1.3.2          Europe Others Hemodialysis Equipment Market, By Country

6.2.1.3.3          Asia-Pacific Others Hemodialysis Equipment Market, By Country

6.2.1.3.4          Rest of World Others Hemodialysis Equipment Market, By Country

6.2.2               Equipment Market, By Region

6.2.2.1          North America Equipment Market, By Country

6.2.2.2          Europe Equipment Market, By Country

6.2.2.3          Asia-Pacific Equipment Market, By Country

6.2.2.4          Rest of World Equipment Market, By Country

6.3.           Consumables

6.3.1               Global Consumables Market, By Product & Service

6.3.1.1          Dialyzers Market, By Region

6.3.1.1.1          North America Dialyzers Market, By Country

6.3.1.1.2          Europe Dialyzers Market, By Country

6.3.1.1.3          Asia-Pacific Dialyzers Market, By Country

6.3.1.1.4          Rest of World Dialyzers Market, By Country

6.3.1.2          Catheters Market, By Region

6.3.1.2.1          North America Catheters Market, By Country

6.3.1.2.2          Europe Catheters Market, By Country

6.3.1.2.3          Asia-Pacific Catheters Market, By Country

6.3.1.2.4          Rest of World Catheters Market, By Country

6.3.1.3          Other Hemodialysis Consumables Market, By Region

6.3.1.3.1          North America Other Hemodialysis Consumables Market, By Country

6.3.1.3.2          Europe Other Hemodialysis Consumables Market, By Country

6.3.1.3.3          Asia-Pacific Other Hemodialysis Consumables Market, By Country

6.3.1.3.4          Rest of World Other Hemodialysis Consumables Market, By Country

6.3.2               Consumables Market, By Region

6.3.2.1          North America Consumables Market, By Country

6.3.2.2          Europe Consumables Market, By Country

6.3.2.3          Asia-Pacific Consumables Market, By Country

6.3.2.4          Rest of World Consumables Market, By Country

6.4.           Drugs

6.4.1               Drugs Market, By Region

6.4.1.1          North America Drugs Market, By Country

6.4.1.2          Europe Drugs Market, By Country

6.4.1.3          Asia-Pacific Drugs Market, By Country

6.4.1.4          Rest of World Drugs Market, By Country

6.5.           Services

6.5.1               Services Market, By Region

6.5.1.1          North America Services Market, By Country

6.5.1.2          Europe Services Market, By Country

6.5.1.3          Asia-Pacific Services Market, By Country

6.5.1.4          Rest of World Services Market, By Country

7.  Global  Hemodailysis Market, By Region

7.1.           Overview

7.2.           North America

7.2.1               North America Hemodailysis Market, By Type

7.2.2               North America Hemodailysis Market, By Product & Service

7.2.2.1          North America  Equipment Market, By Product & Service

7.2.2.2          North America  Consumables Market, By Product & Service

7.2.3               North America Hemodailysis, Market By Country

7.2.3.1          U.S

7.2.3.1.1          U.S Hemodailysis Market, By Type

7.2.3.1.2          U.S Hemodailysis Market, By Product & Service

7.2.3.1.2.1.      U.S Equipment Market, By Product & Service

7.2.3.1.2.2.      U.S Consumables Market, By Product & Service

7.2.3.2          Canada

7.2.3.2.1          Canada Hemodailysis Market, By Type

7.2.3.2.2          Canada Hemodailysis Market, By Product & Service

7.2.3.2.2.1.      Canada Equipment Market, By Product & Service

7.2.3.2.2.2.      Canada Consumables Market, By Product & Service

7.2.3.3          Mexico

7.2.3.3.1          Mexico Hemodailysis Market, By Type

7.2.3.3.2          Mexico Hemodailysis Market, By Product & Service

7.2.3.3.2.1.      Mexico Equipment Market, By Product & Service

7.2.3.3.2.2.      Mexico Consumables Market, By Product & Service

7.3.           Europe

7.3.1               Europe Hemodailysis Market, By Type

7.3.2               Europe Hemodailysis Market, By Product & Service

7.3.2.1          Europe  Equipment Market, By Product & Service

7.3.2.2          Europe  Consumables Market, By Product & Service

7.3.3               Europe Hemodailysis, Market By Country

7.3.3.1          Germany

7.3.3.1.1          Germany Hemodailysis Market, By Type

7.3.3.1.2          Germany Hemodailysis Market, By Product & Service

7.3.3.1.2.1.      Germany Equipment Market, By Product & Service

7.3.3.1.2.2.      Germany Consumables Market, By Product & Service

7.3.3.2          France

7.3.3.2.1          France Hemodailysis Market, By Type

7.3.3.2.2          France Hemodailysis Market, By Product & Service

7.3.3.2.2.1.      France Equipment Market, By Product & Service

7.3.3.2.2.2.      France Consumables Market, By Product & Service

7.3.3.3          UK

7.3.3.3.1          UK Hemodailysis Market, By Type

7.3.3.3.2          UK Hemodailysis Market, By Product & Service

7.3.3.3.2.1.      UK Equipment Market, By Product & Service

7.3.3.3.2.2.      UK Consumables Market, By Product & Service

7.3.3.4          Italy

7.3.3.4.1          Italy Hemodailysis Market, By Type

7.3.3.4.2          Italy Hemodailysis Market, By Product & Service

7.3.3.4.2.1.      Italy Equipment Market, By Product & Service

7.3.3.4.2.2.      Italy Consumables Market, By Product & Service

7.3.3.5          Spain

7.3.3.5.1          Spain Hemodailysis Market, By Type

7.3.3.5.2          Spain Hemodailysis Market, By Product & Service

7.3.3.5.2.1.      Spain Equipment Market, By Product & Service

7.3.3.5.2.2.      Spain Consumables Market, By Product & Service

7.3.3.6          Rest of Europe

7.3.3.6.1          Rest of Europe Hemodailysis Market, By Type

7.3.3.6.2          Rest of Europe Hemodailysis Market, By Product & Service

7.3.3.6.2.1.      Rest of Europe Equipment Market, By Product & Service

7.3.3.6.2.2.      Rest of Europe Consumables Market, By Product & Service

7.4.           Asia-Pacific

7.4.1               Asia-Pacific Hemodailysis Market, By Type

7.4.2               Asia-Pacific Hemodailysis Market, By Product & Service

7.4.2.1          Asia-Pacific  Equipment Market, By Product & Service

7.4.2.2          Asia-Pacific  Consumables Market, By Product & Service

7.4.3               Asia-Pacific Hemodailysis, Market By Country

7.4.3.1          Japan

7.4.3.1.1          Japan Hemodailysis Market, By Type

7.4.3.1.2          Japan Hemodailysis Market, By Product & Service

7.4.3.1.2.1.      Japan Equipment Market, By Product & Service

7.4.3.1.2.2.      Japan Consumables Market, By Product & Service

7.4.3.2          China

7.4.3.2.1          China Hemodailysis Market, By Type

7.4.3.2.2          China Hemodailysis Market, By Product & Service

7.4.3.2.2.1.      China Equipment Market, By Product & Service

7.4.3.2.2.2.      China Consumables Market, By Product & Service

7.4.3.3          India

7.4.3.3.1          India Hemodailysis Market, By Type

7.4.3.3.2          India Hemodailysis Market, By Product & Service

7.4.3.3.2.1.      India Equipment Market, By Product & Service

7.4.3.3.2.2.      India Consumables Market, By Product & Service

7.4.3.4          Australia

7.4.3.4.1          Australia Hemodailysis Market, By Type

7.4.3.4.2          Australia Hemodailysis Market, By Product & Service

7.4.3.4.2.1.      Australia Equipment Market, By Product & Service

7.4.3.4.2.2.      Australia Consumables Market, By Product & Service

7.4.3.5          South Korea

7.4.3.5.1          South Korea Hemodailysis Market, By Type

7.4.3.5.2          south Korea Hemodailysis Market, By Product & Service

7.4.3.5.2.1.      south Korea Equipment Market, By Product & Service

7.4.3.5.2.2.      south Korea Consumables Market, By Product & Service

7.4.3.6          Rest of Asia-Pacific

7.4.3.6.1          Rest of Asia-Pacific Hemodailysis Market, By Type

7.4.3.6.2          Rest of Asia-Pacific Hemodailysis Market, By Product & Service

7.4.3.6.2.1.      Rest of Asia-Pacific Equipment Market, By Product & Service

7.4.3.6.2.2.      Rest of Asia-Pacific Consumables Market, By Product & Service

7.5.           Rest of World

7.5.1               Rest of World Hemodailysis Market, By Type

7.5.2               Rest of World Hemodailysis Market, By Product & Service

7.5.2.1          Rest of World  Equipment Market, By Product & Service

7.5.2.2          Rest of World  Consumables Market, By Product & Service

7.5.3               Rest of World Hemodailysis, Market By Country

7.5.3.1          Brazil

7.5.3.1.1          Brazil Hemodailysis Market, By Type

7.5.3.1.2          Brazil Hemodailysis Market, By Product & Service

7.5.3.1.2.1.      Brazil Equipment Market, By Product & Service

7.5.3.1.2.2.      Brazil Consumables Market, By Product & Service

7.5.3.2          Saudi Arabia

7.5.3.2.1          Saudi Arabia Hemodailysis Market, By Type

7.5.3.2.2          Saudi Arabia Hemodailysis Market, By Product & Service

7.5.3.2.2.1.      Saudi Arabia Equipment Market, By Product & Service

7.5.3.2.2.2.      Saudi Arabia Consumables Market, By Product & Service

7.5.3.3          South Africa

7.5.3.3.1          South Africa Hemodailysis Market, By Type

7.5.3.3.2          South Africa Hemodailysis Market, By Product & Service

7.5.3.3.2.1.      South Africa Equipment Market, By Product & Service

7.5.3.3.2.2.      South Africa Consumables Market, By Product & Service

7.5.3.4          Remaing Countries

7.5.3.4.1          Remaing Countries Hemodailysis Market, By Type

7.5.3.4.2          Remaing Countries Hemodailysis Market, By Product & Service

7.5.3.4.2.1.      Remaing Countries Equipment Market, By Product & Service

7.5.3.4.2.2.      Remaing Countries Consumables Market, By Product & Service

8.   COMPANY PROFILES

8.1.           Asahi Kasei Corporation

8.1.1               COMPANY OVERVIEW

8.1.2               COMPANY SNAPSHOT

8.1.3               OPERATING BUSINESS SEGMENTS

8.1.4               PRODUCT PORTFOLIO

8.1.5               BUSINESS PERFORMANCE

8.1.6               KEY STRATEGIC MOVES AND DEVELOPMENT

8.2.           B. Braun Melsungen AG

8.2.1               COMPANY OVERVIEW

8.2.2               COMPANY SNAPSHOT

8.2.3               OPERATING BUSINESS SEGMENTS

8.2.4               PRODUCT PORTFOLIO

8.2.5               BUSINESS PERFORMANCE

8.2.6               KEY STRATEGIC MOVES AND DEVELOPMENT

8.3.           Baxter International Inc.

8.3.1               COMPANY OVERVIEW

8.3.2               COMPANY SNAPSHOT

8.3.3               OPERATING BUSINESS SEGMENTS

8.3.4               PRODUCT PORTFOLIO

8.3.5               BUSINESS PERFORMANCE

8.3.6               KEY STRATEGIC MOVES AND DEVELOPMENT

8.4.           Cantel Medical Corp.

8.4.1               COMPANY OVERVIEW

8.4.2               COMPANY SNAPSHOT

8.4.3               OPERATING BUSINESS SEGMENTS

8.4.4               PRODUCT PORTFOLIO

8.4.5               BUSINESS PERFORMANCE

8.4.6               KEY STRATEGIC MOVES AND DEVELOPMENT

8.5.           DaVita Inc.

8.5.1               COMPANY OVERVIEW

8.5.2               COMPANY SNAPSHOT

8.5.3               OPERATING BUSINESS SEGMENTS

8.5.4               PRODUCT PORTFOLIO

8.5.5               BUSINESS PERFORMANCE

8.5.6               KEY STRATEGIC MOVES AND DEVELOPMENT

8.6.           Diaverum.

8.6.1               COMPANY OVERVIEW

8.6.2               COMPANY SNAPSHOT

8.6.3               OPERATING BUSINESS SEGMENTS

8.6.4               PRODUCT PORTFOLIO

8.6.5               BUSINESS PERFORMANCE

8.6.6               KEY STRATEGIC MOVES AND DEVELOPMENT

8.7.           Fresenius Medical Care AG & Co. KGaA

8.7.1               COMPANY OVERVIEW

8.7.2               COMPANY SNAPSHOT

8.7.3               OPERATING BUSINESS SEGMENTS

8.7.4               PRODUCT PORTFOLIO

8.7.5               BUSINESS PERFORMANCE

8.7.6               KEY STRATEGIC MOVES AND DEVELOPMENT

8.8.           Nikkiso Co., Ltd.

8.8.1               COMPANY OVERVIEW

8.8.2               COMPANY SNAPSHOT

8.8.3               OPERATING BUSINESS SEGMENTS

8.8.4               PRODUCT PORTFOLIO

8.8.5               BUSINESS PERFORMANCE

8.8.6               KEY STRATEGIC MOVES AND DEVELOPMENT

8.9.           Nipro Corporation

8.9.1               COMPANY OVERVIEW

8.9.2               COMPANY SNAPSHOT

8.9.3               OPERATING BUSINESS SEGMENTS

8.9.4               PRODUCT PORTFOLIO

8.9.5               BUSINESS PERFORMANCE

8.9.6               KEY STRATEGIC MOVES AND DEVELOPMENT

8.10.         NxStage Medical, Inc.

8.10.1             COMPANY OVERVIEW

8.10.2             COMPANY SNAPSHOT

8.10.3             OPERATING BUSINESS SEGMENTS

8.10.4             PRODUCT PORTFOLIO

8.10.5             BUSINESS PERFORMANCE

8.10.6           KEY STRATEGIC MOVES AND DEVELOPMENT

LIST OF TABLE

TABLE 1.    Global  Hemodailysis Market Value, By Type, 2019-2030, Million USD

TABLE 2.    Conventional Hemodialysis Market Value, By Region, 2019-2030, Million USD

TABLE 3.    North America Conventional Hemodialysis Market Value, By Country, 2019-2030, Million USD

TABLE 4.    Europe Conventional Hemodialysis Market Value, By Country, 2019-2030, Million USD

TABLE 5.    Asia-Pacific Conventional Hemodialysis Market Value, By Country, 2019-2030, Million USD

TABLE 6.    Rest of World Conventional Hemodialysis Market Value, By Country, 2019-2030, Million USD

TABLE 7.    Short Daily Hemodialysis Market Value, By Region, 2019-2030, Million USD

TABLE 8.    North America Short Daily Hemodialysis Market Value, By Country, 2019-2030, Million USD

TABLE 9.    Europe Short Daily Hemodialysis Market Value, By Country, 2019-2030, Million USD

TABLE 10.    sia-Pacific Short Daily Hemodialysis Market Value, By Country, 2019-2030, Million USD

TABLE 11.    Rest of World Short Daily Hemodialysis Market Value, By Country, 2019-2030, Million USD

TABLE 12.    Nocturnal Hemodialysis Market Value, By Region, 2019-2030, Million USD

TABLE 13.       North America Nocturnal Hemodialysis Market Value, By Country, 2019-2030, Million USD

TABLE 14.       Europe Nocturnal Hemodialysis Market Value, By Country, 2019-2030, Million USD

TABLE 15.    Asia-Pacific Nocturnal Hemodialysis Market Value, By Country, 2019-2030, Million USD

TABLE 16.    Rest of World Nocturnal Hemodialysis Market Value, By Country, 2019-2030, Million USD

TABLE 17.    Global  Hemodailysis Market Value, By Product & Service, 2019-2030, Million USD

TABLE 18.    Global Equipment Market Value, By Product & Service, 2019-2030, Million USD

TABLE 19.    Dialysis Machines Market Value, By Region, 2019-2030, Million USD

TABLE 20.       North America Dialysis Machines Market Value, By Country, 2019-2030, Million USD

TABLE 21.    Europe Dialysis Machines Market Value, By Country, 2019-2030, Million USD

TABLE 22.    Asia-Pacific Dialysis Machines Market Value, By Country, 2019-2030, Million USD

TABLE 23.       Rest of World Dialysis Machines Market Value, By Country, 2019-2030, Million USD

TABLE 24.    Hemodialysis Water Treatment Systems Market Value, By Region, 2019-2030, Million USD

TABLE 25.     North America Hemodialysis Water Treatment Systems Market Value, By Country, 2019-2030, Million USD

TABLE 26.    Europe Hemodialysis Water Treatment Systems Market Value, By Country, 2019-2030, Million USD

TABLE 27.       Asia-Pacific Hemodialysis Water Treatment Systems Market Value, By Country, 2019-2030, Million USD

TABLE 28.    Rest of World Hemodialysis Water Treatment Systems Market Value, By Country, 2019-2030, Million USD

TABLE 29.       Others Hemodialysis Equipment Market Value, By Region, 2019-2030, Million USD

TABLE 30.    North America Others Hemodialysis Equipment Market Value, By Country, 2019-2030, Million USD

TABLE 31.       Europe Others Hemodialysis Equipment Market Value, By Country, 2019-2030, Million USD

TABLE 32.       Asia-Pacific Others Hemodialysis Equipment Market Value, By Country, 2019-2030, Million USD

TABLE 33.    Rest of World Others Hemodialysis Equipment Market Value, By Country, 2019-2030, Million USD

TABLE 34.       Equipment Market Value, By Region, 2019-2030, Million USD

TABLE 35.    North America Equipment Market Value, By Country, 2019-2030, Million USD

TABLE 36.    Europe Equipment Market Value, By Country, 2019-2030, Million USD

TABLE 37.       Asia-Pacific Equipment Market Value, By Country, 2019-2030, Million USD

TABLE 38.       Rest of World Equipment Market Value, By Country, 2019-2030, Million USD

TABLE 39.       Global Consumables Market Value, By Product & Service, 2019-2030, Million USD

TABLE 40.       Dialyzers Market Value, By Region, 2019-2030, Million USD

TABLE 41.       North America Dialyzers Market Value, By Country, 2019-2030, Million USD

TABLE 42.       Europe Dialyzers Market Value, By Country, 2019-2030, Million USD

TABLE 43.       Asia-Pacific Dialyzers Market Value, By Country, 2019-2030, Million USD

TABLE 44.       Rest of World Dialyzers Market Value, By Country, 2019-2030, Million USD

TABLE 45.       Catheters Market Value, By Region, 2019-2030, Million USD

TABLE 46.       North America Catheters Market Value, By Country, 2019-2030, Million USD

TABLE 47.       Europe Catheters Market Value, By Country, 2019-2030, Million USD

TABLE 48.       Asia-Pacific Catheters Market Value, By Country, 2019-2030, Million USD

TABLE 49.       Rest of World Catheters Market Value, By Country, 2019-2030, Million USD

TABLE 50.       Other Hemodialysis Consumables Market Value, By Region, 2019-2030, Million USD

TABLE 51.       North America Other Hemodialysis Consumables Market Value, By Country, 2019-2030, Million USD

TABLE 52.       Europe Other Hemodialysis Consumables Market Value, By Country, 2019-2030, Million USD

TABLE 53.       Asia-Pacific Other Hemodialysis Consumables Market Value, By Country, 2019-2030, Million USD

TABLE 54.       Rest of World Other Hemodialysis Consumables Market Value, By Country, 2019-2030, Million USD

TABLE 55.       Consumables Market Value, By Region, 2019-2030, Million USD

TABLE 56.    North America Consumables Market Value, By Country, 2019-2030, Million USD

TABLE 57.       Europe Consumables Market Value, By Country, 2019-2030, Million USD

TABLE 58.       Asia-Pacific Consumables Market Value, By Country, 2019-2030, Million USD

TABLE 59.       Rest of World Consumables Market Value, By Country, 2019-2030, Million USD

TABLE 60.       Drugs Market Value, By Region, 2019-2030, Million USD

TABLE 61.       North America Drugs Market Value, By Country, 2019-2030, Million USD

TABLE 62.       Europe Drugs Market Value, By Country, 2019-2030, Million USD

TABLE 63.    Asia-Pacific Drugs Market Value, By Country, 2019-2030, Million USD

TABLE 64.       Rest of World Drugs Market Value, By Country, 2019-2030, Million USD

TABLE 65.       Services Market Value, By Region, 2019-2030, Million USD

TABLE 66.       North America Services Market Value, By Country, 2019-2030, Million USD

TABLE 67.    Europe Services Market Value, By Country, 2019-2030, Million USD

TABLE 68.       Asia-Pacific Services Market Value, By Country, 2019-2030, Million USD

TABLE 69.       Rest of World Services Market Value, By Country, 2019-2030, Million USD

TABLE 70.       Global  Hemodailysis Market Value, By Region, 2019-2030, Million USD

TABLE 71.       North America Hemodailysis Market Value, By Type, 2019-2030, Million USD

TABLE 72.       North America Hemodailysis Market Value, By Product & Service, 2019-2030, Million USD

TABLE 73.       North America  Equipment Market Value, By Product & Service, 2019-2030, Million USD

TABLE 74.       North America  Consumables Market Value, By Product & Service, 2019-2030, Million USD

TABLE 75.       U.S Hemodailysis Market Value, By Type, 2019-2030, Million USD

TABLE 76.       U.S Hemodailysis Market Value, By Product & Service, 2019-2030, Million USD

TABLE 77.       U.S Equipment Market Value, By Product & Service, 2019-2030, Million USD

TABLE 78.       U.S Consumables Market Value, By Product & Service, 2019-2030, Million USD

TABLE 79.    Canada Hemodailysis Market Value, By Type, 2019-2030, Million USD

TABLE 80.       Canada Hemodailysis Market Value, By Product & Service, 2019-2030, Million USD

TABLE 81.    Canada Equipment Market Value, By Product & Service, 2019-2030, Million USD

TABLE 82.       Canada Consumables Market Value, By Product & Service, 2019-2030, Million USD

TABLE 83.       Mexico Hemodailysis Market Value, By Type, 2019-2030, Million USD

TABLE 84.       Mexico Hemodailysis Market Value, By Product & Service, 2019-2030, Million USD

TABLE 85.       Mexico Equipment Market Value, By Product & Service, 2019-2030, Million USD

TABLE 86.       Mexico Consumables Market Value, By Product & Service, 2019-2030, Million USD

TABLE 87.    Europe Hemodailysis Market Value, By Type, 2019-2030, Million USD

TABLE 88.       Europe Hemodailysis Market Value, By Product & Service, 2019-2030, Million USD

TABLE 89.       Europe  Equipment Market Value, By Product & Service, 2019-2030, Million USD

TABLE 90.       Europe  Consumables Market Value, By Product & Service, 2019-2030, Million USD

TABLE 91.    Germany Hemodailysis Market Value, By Type, 2019-2030, Million USD

TABLE 92.       Germany Hemodailysis Market Value, By Product & Service, 2019-2030, Million USD

TABLE 93.       Germany Equipment Market Value, By Product & Service, 2019-2030, Million USD

TABLE 94.       Germany Consumables Market Value, By Product & Service, 2019-2030, Million USD

TABLE 95.    France Hemodailysis Market Value, By Type, 2019-2030, Million USD

TABLE 96.       France Hemodailysis Market Value, By Product & Service, 2019-2030, Million USD

TABLE 97.       France Equipment Market Value, By Product & Service, 2019-2030, Million USD

TABLE 98.       France Consumables Market Value, By Product & Service, 2019-2030, Million USD

TABLE 99.       UK Hemodailysis Market Value, By Type, 2019-2030, Million USD

TABLE 100.    UK Hemodailysis Market Value, By Product & Service, 2019-2030, Million USD

TABLE 101.    UK Equipment Market Value, By Product & Service, 2019-2030, Million USD

TABLE 102.    UK Consumables Market Value, By Product & Service, 2019-2030, Million USD

TABLE 103.    Italy Hemodailysis Market Value, By Type, 2019-2030, Million USD

TABLE 104.    Italy Hemodailysis Market Value, By Product & Service, 2019-2030, Million USD

TABLE 105.    Italy Equipment Market Value, By Product & Service, 2019-2030, Million USD

TABLE 106.    Italy Consumables Market Value, By Product & Service, 2019-2030, Million USD

TABLE 107.    Spain Hemodailysis Market Value, By Type, 2019-2030, Million USD

TABLE 108.    Spain Hemodailysis Market Value, By Product & Service, 2019-2030, Million USD

TABLE 109.    Spain Equipment Market Value, By Product & Service, 2019-2030, Million USD

TABLE 110.    Spain Consumables Market Value, By Product & Service, 2019-2030, Million USD

TABLE 111.    Rest of Europe Hemodailysis Market Value, By Type, 2019-2030, Million USD

TABLE 112.    Rest of Europe Hemodailysis Market Value, By Product & Service, 2019-2030, Million USD

TABLE 113.    Rest of Europe Equipment Market Value, By Product & Service, 2019-2030, Million USD

TABLE 114.    Rest of Europe Consumables Market Value, By Product & Service, 2019-2030, Million USD

TABLE 115.    Asia-Pacific Hemodailysis Market Value, By Type, 2019-2030, Million USD

TABLE 116.    Asia-Pacific Hemodailysis Market Value, By Product & Service, 2019-2030, Million USD

TABLE 117.    Asia-Pacific  Equipment Market Value, By Product & Service, 2019-2030, Million USD

TABLE 118.    Asia-Pacific  Consumables Market Value, By Product & Service, 2019-2030, Million USD

TABLE 119.    Japan Hemodailysis Market Value, By Type, 2019-2030, Million USD

TABLE 120.    Japan Hemodailysis Market Value, By Product & Service, 2019-2030, Million USD

TABLE 121.    Japan Equipment Market Value, By Product & Service, 2019-2030, Million USD

TABLE 122.    Japan Consumables Market Value, By Product & Service, 2019-2030, Million USD

TABLE 123.    China Hemodailysis Market Value, By Type, 2019-2030, Million USD

TABLE 124.    China Hemodailysis Market Value, By Product & Service, 2019-2030, Million USD

TABLE 125.    China Equipment Market Value, By Product & Service, 2019-2030, Million USD

TABLE 126.    China Consumables Market Value, By Product & Service, 2019-2030, Million USD

TABLE 127.    India Hemodailysis Market Value, By Type, 2019-2030, Million USD

TABLE 128.    India Hemodailysis Market Value, By Product & Service, 2019-2030, Million USD

TABLE 129.    India Equipment Market Value, By Product & Service, 2019-2030, Million USD

TABLE 130.    India Consumables Market Value, By Product & Service, 2019-2030, Million USD

TABLE 131.    Australia Hemodailysis Market Value, By Type, 2019-2030, Million USD

TABLE 132.    Australia Hemodailysis Market Value, By Product & Service, 2019-2030, Million USD

TABLE 133.    Australia Equipment Market Value, By Product & Service, 2019-2030, Million USD

TABLE 134.    Australia Consumables Market Value, By Product & Service, 2019-2030, Million USD

TABLE 135.    south Korea Hemodailysis Market Value, By Type, 2019-2030, Million USD

TABLE 136.    south Korea Hemodailysis Market Value, By Product & Service, 2019-2030, Million USD

TABLE 137.    south Korea Equipment Market Value, By Product & Service, 2019-2030, Million USD

TABLE 138.    south Korea Consumables Market Value, By Product & Service, 2019-2030, Million USD

TABLE 139.    Rest of Asia-Pacific Hemodailysis Market Value, By Type, 2019-2030, Million USD

TABLE 140.    Rest of Asia-Pacific Hemodailysis Market Value, By Product & Service, 2019-2030, Million USD

TABLE 141.    Rest of Asia-Pacific Equipment Market Value, By Product & Service, 2019-2030, Million USD

TABLE 142.    Rest of Asia-Pacific Consumables Market Value, By Product & Service, 2019-2030, Million USD

TABLE 143.    Rest of World Hemodailysis Market Value, By Type, 2019-2030, Million USD

TABLE 144.    Rest of World Hemodailysis Market Value, By Product & Service, 2019-2030, Million USD

TABLE 145.    Rest of World  Equipment Market Value, By Product & Service, 2019-2030, Million USD

TABLE 146.    Rest of World  Consumables Market Value, By Product & Service, 2019-2030, Million USD

TABLE 147.    Brazil Hemodailysis Market Value, By Type, 2019-2030, Million USD

TABLE 148.    Brazil Hemodailysis Market Value, By Product & Service, 2019-2030, Million USD

TABLE 149.    Brazil Equipment Market Value, By Product & Service, 2019-2030, Million USD

TABLE 150.    Brazil Consumables Market Value, By Product & Service, 2019-2030, Million USD

TABLE 151.    Saudi Arabia Hemodailysis Market Value, By Type, 2019-2030, Million USD

TABLE 152.    Saudi Arabia Hemodailysis Market Value, By Product & Service, 2019-2030, Million USD

TABLE 153.    Saudi Arabia Equipment Market Value, By Product & Service, 2019-2030, Million USD

TABLE 154.    Saudi Arabia Consumables Market Value, By Product & Service, 2019-2030, Million USD

TABLE 155.    South Africa Hemodailysis Market Value, By Type, 2019-2030, Million USD

TABLE 156.    South Africa Hemodailysis Market Value, By Product & Service, 2019-2030, Million USD

TABLE 157.    South Africa Equipment Market Value, By Product & Service, 2019-2030, Million USD

TABLE 158.    South Africa Consumables Market Value, By Product & Service, 2019-2030, Million USD

TABLE 159.    Remaing Countries Hemodailysis Market Value, By Type, 2019-2030, Million USD

TABLE 160.    Remaing Countries Hemodailysis Market Value, By Product & Service, 2019-2030, Million USD

TABLE 161.    Remaing Countries Equipment Market Value, By Product & Service, 2019-2030, Million USD

TABLE 162.    Remaing Countries Consumables Market Value, By Product & Service, 2019-2030, Million USD

TABLE 163.    Asahi Kasei Corporation: COMPANY SNAPSHOT

TABLE 164.    Asahi Kasei Corporation: OPERATING SEGMENTS

TABLE 165.    Asahi Kasei Corporation: PRODUCT PORTFOLIO

TABLE 166.    Asahi Kasei Corporation: KEY STRATERGY

TABLE 167.    B. Braun Melsungen AG: COMPANY SNAPSHOT

TABLE 168.    B. Braun Melsungen AG: OPERATING SEGMENTS

TABLE 169.    B. Braun Melsungen AG: PRODUCT PORTFOLIO

TABLE 170.    B. Braun Melsungen AG: KEY STRATERGY

TABLE 171.    Baxter International Inc.: COMPANY SNAPSHOT

TABLE 172.    Baxter International Inc.: OPERATING SEGMENTS

TABLE 173.    Baxter International Inc.: PRODUCT PORTFOLIO

TABLE 174.    Baxter International Inc.: KEY STRATERGY

TABLE 175.    Cantel Medical Corp.: COMPANY SNAPSHOT

TABLE 176.    Cantel Medical Corp.: OPERATING SEGMENTS

TABLE 177.    Cantel Medical Corp.: PRODUCT PORTFOLIO

TABLE 178.    Cantel Medical Corp.: KEY STRATERGY

TABLE 179.    DaVita Inc.: COMPANY SNAPSHOT

TABLE 180.    DaVita Inc.: OPERATING SEGMENTS

TABLE 181.    DaVita Inc.: PRODUCT PORTFOLIO

TABLE 182.    DaVita Inc.: KEY STRATERGY

TABLE 183.    Diaverum.: COMPANY SNAPSHOT

TABLE 184.    Diaverum.: OPERATING SEGMENTS

TABLE 185.    Diaverum.: PRODUCT PORTFOLIO

TABLE 186.    Diaverum.: KEY STRATERGY

TABLE 187.    Fresenius Medical Care AG & Co. KGaA: COMPANY SNAPSHOT

TABLE 188.    Fresenius Medical Care AG & Co. KGaA: OPERATING SEGMENTS

TABLE 189.    Fresenius Medical Care AG & Co. KGaA: PRODUCT PORTFOLIO

TABLE 190.    Fresenius Medical Care AG & Co. KGaA: KEY STRATERGY

TABLE 191.    Nikkiso Co., Ltd.: COMPANY SNAPSHOT

TABLE 192.    Nikkiso Co., Ltd.: OPERATING SEGMENTS

TABLE 193.    Nikkiso Co., Ltd.: PRODUCT PORTFOLIO

TABLE 194.    Nikkiso Co., Ltd.: KEY STRATERGY

TABLE 195.    Nipro Corporation: COMPANY SNAPSHOT

TABLE 196.    Nipro Corporation: OPERATING SEGMENTS

TABLE 197.    Nipro Corporation: PRODUCT PORTFOLIO

TABLE 198.    Nipro Corporation: KEY STRATERGY

TABLE 199.    NxStage Medical, Inc.: COMPANY SNAPSHOT

TABLE 200.    NxStage Medical, Inc.: OPERATING SEGMENTS

TABLE 201.    NxStage Medical, Inc.: PRODUCT PORTFOLIO

TABLE 202.    NxStage Medical, Inc.: KEY STRATERGY


LIST OF FIGURES

FIGURE 1.    Global  Hemodailysis Market Value, By Type, 2019-2030, Million USD

FIGURE 2.    Conventional Hemodialysis Market Value, By Region, 2019-2030, Million USD

FIGURE 3.    North America Conventional Hemodialysis Market Value, By Country, 2019-2030, Million USD

FIGURE 4.    Europe Conventional Hemodialysis Market Value, By Country, 2019-2030, Million USD

FIGURE 5.    Asia-Pacific Conventional Hemodialysis Market Value, By Country, 2019-2030, Million USD

FIGURE 6.       Rest of World Conventional Hemodialysis Market Value, By Country, 2019-2030, Million USD

FIGURE 7.       Short Daily Hemodialysis Market Value, By Region, 2019-2030, Million USD

FIGURE 8.       North America Short Daily Hemodialysis Market Value, By Country, 2019-2030, Million USD

FIGURE 9.       Europe Short Daily Hemodialysis Market Value, By Country, 2019-2030, Million USD

FIGURE 10.    Asia-Pacific Short Daily Hemodialysis Market Value, By Country, 2019-2030, Million USD

FIGURE 11.    Rest of World Short Daily Hemodialysis Market Value, By Country, 2019-2030, Million USD

FIGURE 12.    Nocturnal Hemodialysis Market Value, By Region, 2019-2030, Million USD

FIGURE 13.    North America Nocturnal Hemodialysis Market Value, By Country, 2019-2030, Million USD

FIGURE 14.    Europe Nocturnal Hemodialysis Market Value, By Country, 2019-2030, Million USD

FIGURE 15.    Asia-Pacific Nocturnal Hemodialysis Market Value, By Country, 2019-2030, Million USD

FIGURE 16.    Rest of World Nocturnal Hemodialysis Market Value, By Country, 2019-2030, Million USD

FIGURE 17.    Global  Hemodailysis Market Value, By Product & Service, 2019-2030, Million USD

FIGURE 18.    Global Equipment Market Value, By Product & Service, 2019-2030, Million USD

FIGURE 19.    Dialysis Machines Market Value, By Region, 2019-2030, Million USD

FIGURE 20.    North America Dialysis Machines Market Value, By Country, 2019-2030, Million USD

FIGURE 21.    Europe Dialysis Machines Market Value, By Country, 2019-2030, Million USD

FIGURE 22.    Asia-Pacific Dialysis Machines Market Value, By Country, 2019-2030, Million USD

FIGURE 23.    Rest of World Dialysis Machines Market Value, By Country, 2019-2030, Million USD

FIGURE 24.    Hemodialysis Water Treatment Systems Market Value, By Region, 2019-2030, Million USD

FIGURE 25.    North America Hemodialysis Water Treatment Systems Market Value, By Country, 2019-2030, Million USD

FIGURE 26.    Europe Hemodialysis Water Treatment Systems Market Value, By Country, 2019-2030, Million USD

FIGURE 27.    Asia-Pacific Hemodialysis Water Treatment Systems Market Value, By Country, 2019-2030, Million USD

FIGURE 28.    Rest of World Hemodialysis Water Treatment Systems Market Value, By Country, 2019-2030, Million USD

FIGURE 29.    Others Hemodialysis Equipment Market Value, By Region, 2019-2030, Million USD

FIGURE 30.    North America Others Hemodialysis Equipment Market Value, By Country, 2019-2030, Million USD

FIGURE 31.    Europe Others Hemodialysis Equipment Market Value, By Country, 2019-2030, Million USD

FIGURE 32.    Asia-Pacific Others Hemodialysis Equipment Market Value, By Country, 2019-2030, Million USD

FIGURE 33.    Rest of World Others Hemodialysis Equipment Market Value, By Country, 2019-2030, Million USD

FIGURE 34.    Equipment Market Value, By Region, 2019-2030, Million USD

FIGURE 35.    North America Equipment Market Value, By Country, 2019-2030, Million USD

FIGURE 36.    Europe Equipment Market Value, By Country, 2019-2030, Million USD

FIGURE 37.    Asia-Pacific Equipment Market Value, By Country, 2019-2030, Million USD

FIGURE 38.    Rest of World Equipment Market Value, By Country, 2019-2030, Million USD

FIGURE 39.    Global Consumables Market Value, By Product & Service, 2019-2030, Million USD

FIGURE 40.    Dialyzers Market Value, By Region, 2019-2030, Million USD

FIGURE 41.    North America Dialyzers Market Value, By Country, 2019-2030, Million USD

FIGURE 42.    Europe Dialyzers Market Value, By Country, 2019-2030, Million USD

FIGURE 43.    Asia-Pacific Dialyzers Market Value, By Country, 2019-2030, Million USD

FIGURE 44.    Rest of World Dialyzers Market Value, By Country, 2019-2030, Million USD

FIGURE 45.    Catheters Market Value, By Region, 2019-2030, Million USD

FIGURE 46.    North America Catheters Market Value, By Country, 2019-2030, Million USD

FIGURE 47.    Europe Catheters Market Value, By Country, 2019-2030, Million USD

FIGURE 48.    Asia-Pacific Catheters Market Value, By Country, 2019-2030, Million USD

FIGURE 49.    Rest of World Catheters Market Value, By Country, 2019-2030, Million USD

FIGURE 50.    Other Hemodialysis Consumables Market Value, By Region, 2019-2030, Million USD

FIGURE 51.    North America Other Hemodialysis Consumables Market Value, By Country, 2019-2030, Million USD

FIGURE 52.    Europe Other Hemodialysis Consumables Market Value, By Country, 2019-2030, Million USD

FIGURE 53.    Asia-Pacific Other Hemodialysis Consumables Market Value, By Country, 2019-2030, Million USD

FIGURE 54.    Rest of World Other Hemodialysis Consumables Market Value, By Country, 2019-2030, Million USD

FIGURE 55.    Consumables Market Value, By Region, 2019-2030, Million USD

FIGURE 56.    North America Consumables Market Value, By Country, 2019-2030, Million USD

FIGURE 57.    Europe Consumables Market Value, By Country, 2019-2030, Million USD

FIGURE 58.    Asia-Pacific Consumables Market Value, By Country, 2019-2030, Million USD

FIGURE 59.    Rest of World Consumables Market Value, By Country, 2019-2030, Million USD

FIGURE 60.    Drugs Market Value, By Region, 2019-2030, Million USD

FIGURE 61.    North America Drugs Market Value, By Country, 2019-2030, Million USD

FIGURE 62.    Europe Drugs Market Value, By Country, 2019-2030, Million USD

FIGURE 63.    Asia-Pacific Drugs Market Value, By Country, 2019-2030, Million USD

FIGURE 64.    Rest of World Drugs Market Value, By Country, 2019-2030, Million USD

FIGURE 65.    Services Market Value, By Region, 2019-2030, Million USD

FIGURE 66.    North America Services Market Value, By Country, 2019-2030, Million USD

FIGURE 67.    Europe Services Market Value, By Country, 2019-2030, Million USD

FIGURE 68.    Asia-Pacific Services Market Value, By Country, 2019-2030, Million USD

FIGURE 69.    Rest of World Services Market Value, By Country, 2019-2030, Million USD

FIGURE 70.    Global  Hemodailysis Market Value, By Region, 2019-2030, Million USD

FIGURE 71.    North America Hemodailysis Market Value, By Type, 2019-2030, Million USD

FIGURE 72.    North America Hemodailysis Market Value, By Product & Service, 2019-2030, Million USD

FIGURE 73.    North America  Equipment Market Value, By Product & Service, 2019-2030, Million USD

FIGURE 74.    North America  Consumables Market Value, By Product & Service, 2019-2030, Million USD

FIGURE 75.    U.S Hemodailysis Market Value, By Type, 2019-2030, Million USD

FIGURE 76.    U.S Hemodailysis Market Value, By Product & Service, 2019-2030, Million USD

FIGURE 77.    U.S Equipment Market Value, By Product & Service, 2019-2030, Million USD

FIGURE 78.    U.S Consumables Market Value, By Product & Service, 2019-2030, Million USD

FIGURE 79.    Canada Hemodailysis Market Value, By Type, 2019-2030, Million USD

FIGURE 80.    Canada Hemodailysis Market Value, By Product & Service, 2019-2030, Million USD

FIGURE 81.    Canada Equipment Market Value, By Product & Service, 2019-2030, Million USD

FIGURE 82.    Canada Consumables Market Value, By Product & Service, 2019-2030, Million USD

FIGURE 83.    Mexico Hemodailysis Market Value, By Type, 2019-2030, Million USD

FIGURE 84.    Mexico Hemodailysis Market Value, By Product & Service, 2019-2030, Million USD

FIGURE 85.    Mexico Equipment Market Value, By Product & Service, 2019-2030, Million USD

FIGURE 86.    Mexico Consumables Market Value, By Product & Service, 2019-2030, Million USD

FIGURE 87.    Europe Hemodailysis Market Value, By Type, 2019-2030, Million USD

FIGURE 88.    Europe Hemodailysis Market Value, By Product & Service, 2019-2030, Million USD

FIGURE 89.    Europe  Equipment Market Value, By Product & Service, 2019-2030, Million USD

FIGURE 90.    Europe  Consumables Market Value, By Product & Service, 2019-2030, Million USD

FIGURE 91.    Germany Hemodailysis Market Value, By Type, 2019-2030, Million USD

FIGURE 92.    Germany Hemodailysis Market Value, By Product & Service, 2019-2030, Million USD

FIGURE 93.    Germany Equipment Market Value, By Product & Service, 2019-2030, Million USD

FIGURE 94.    Germany Consumables Market Value, By Product & Service, 2019-2030, Million USD

FIGURE 95.    France Hemodailysis Market Value, By Type, 2019-2030, Million USD

FIGURE 96.    France Hemodailysis Market Value, By Product & Service, 2019-2030, Million USD

FIGURE 97.    France Equipment Market Value, By Product & Service, 2019-2030, Million USD

FIGURE 98.    France Consumables Market Value, By Product & Service, 2019-2030, Million USD

FIGURE 99.    UK Hemodailysis Market Value, By Type, 2019-2030, Million USD

FIGURE 100. UK Hemodailysis Market Value, By Product & Service, 2019-2030, Million USD

FIGURE 101. UK Equipment Market Value, By Product & Service, 2019-2030, Million USD

FIGURE 102. UK Consumables Market Value, By Product & Service, 2019-2030, Million USD

FIGURE 103. Italy Hemodailysis Market Value, By Type, 2019-2030, Million USD

FIGURE 104. Italy Hemodailysis Market Value, By Product & Service, 2019-2030, Million USD

FIGURE 105. Italy Equipment Market Value, By Product & Service, 2019-2030, Million USD

FIGURE 106. Italy Consumables Market Value, By Product & Service, 2019-2030, Million USD

FIGURE 107. Spain Hemodailysis Market Value, By Type, 2019-2030, Million USD

FIGURE 108. Spain Hemodailysis Market Value, By Product & Service, 2019-2030, Million USD

FIGURE 109. Spain Equipment Market Value, By Product & Service, 2019-2030, Million USD

FIGURE 110. Spain Consumables Market Value, By Product & Service, 2019-2030, Million USD

FIGURE 111. Rest of Europe Hemodailysis Market Value, By Type, 2019-2030, Million USD

FIGURE 112. Rest of Europe Hemodailysis Market Value, By Product & Service, 2019-2030, Million USD

FIGURE 113. Rest of Europe Equipment Market Value, By Product & Service, 2019-2030, Million USD

FIGURE 114. Rest of Europe Consumables Market Value, By Product & Service, 2019-2030, Million USD

FIGURE 115. Asia-Pacific Hemodailysis Market Value, By Type, 2019-2030, Million USD

FIGURE 116. Asia-Pacific Hemodailysis Market Value, By Product & Service, 2019-2030, Million USD

FIGURE 117. Asia-Pacific  Equipment Market Value, By Product & Service, 2019-2030, Million USD

FIGURE 118. Asia-Pacific  Consumables Market Value, By Product & Service, 2019-2030, Million USD

FIGURE 119. Japan Hemodailysis Market Value, By Type, 2019-2030, Million USD

FIGURE 120. Japan Hemodailysis Market Value, By Product & Service, 2019-2030, Million USD

FIGURE 121.    Japan Equipment Market Value, By Product & Service, 2019-2030, Million USD

FIGURE 122.      Japan Consumables Market Value, By Product & Service, 2019-2030, Million USD

FIGURE 123. China Hemodailysis Market Value, By Type, 2019-2030, Million USD

FIGURE 124. China Hemodailysis Market Value, By Product & Service, 2019-2030, Million USD

FIGURE 125.    China Equipment Market Value, By Product & Service, 2019-2030, Million USD

FIGURE 126. China Consumables Market Value, By Product & Service, 2019-2030, Million USD

FIGURE 127.    India Hemodailysis Market Value, By Type, 2019-2030, Million USD

FIGURE 128.    India Hemodailysis Market Value, By Product & Service, 2019-2030, Million USD

FIGURE 129.    India Equipment Market Value, By Product & Service, 2019-2030, Million USD

FIGURE 130. India Consumables Market Value, By Product & Service, 2019-2030, Million USD

FIGURE 131. Australia Hemodailysis Market Value, By Type, 2019-2030, Million USD

FIGURE 132. Australia Hemodailysis Market Value, By Product & Service, 2019-2030, Million USD

FIGURE 133. Australia Equipment Market Value, By Product & Service, 2019-2030, Million USD

FIGURE 134. Australia Consumables Market Value, By Product & Service, 2019-2030, Million USD

FIGURE 135. south Korea Hemodailysis Market Value, By Type, 2019-2030, Million USD

FIGURE 136. south Korea Hemodailysis Market Value, By Product & Service, 2019-2030, Million USD

FIGURE 137. south Korea Equipment Market Value, By Product & Service, 2019-2030, Million USD

FIGURE 138. south Korea Consumables Market Value, By Product & Service, 2019-2030, Million USD

FIGURE 139. Rest of Asia-Pacific Hemodailysis Market Value, By Type, 2019-2030, Million USD

FIGURE 140. Rest of Asia-Pacific Hemodailysis Market Value, By Product & Service, 2019-2030, Million USD

FIGURE 141. Rest of Asia-Pacific Equipment Market Value, By Product & Service, 2019-2030, Million USD

FIGURE 142. Rest of Asia-Pacific Consumables Market Value, By Product & Service, 2019-2030, Million USD

FIGURE 143. Rest of World Hemodailysis Market Value, By Type, 2019-2030, Million USD

FIGURE 144. Rest of World Hemodailysis Market Value, By Product & Service, 2019-2030, Million USD

FIGURE 145. Rest of World  Equipment Market Value, By Product & Service, 2019-2030, Million USD

FIGURE 146. Rest of World  Consumables Market Value, By Product & Service, 2019-2030, Million USD

FIGURE 147. Brazil Hemodailysis Market Value, By Type, 2019-2030, Million USD

FIGURE 148. Brazil Hemodailysis Market Value, By Product & Service, 2019-2030, Million USD

FIGURE 149. Brazil Equipment Market Value, By Product & Service, 2019-2030, Million USD

FIGURE 150. Brazil Consumables Market Value, By Product & Service, 2019-2030, Million USD

FIGURE 151. Saudi Arabia Hemodailysis Market Value, By Type, 2019-2030, Million USD

FIGURE 152. Saudi Arabia Hemodailysis Market Value, By Product & Service, 2019-2030, Million USD

FIGURE 153. Saudi Arabia Equipment Market Value, By Product & Service, 2019-2030, Million USD

FIGURE 154. Saudi Arabia Consumables Market Value, By Product & Service, 2019-2030, Million USD

FIGURE 155. South Africa Hemodailysis Market Value, By Type, 2019-2030, Million USD

FIGURE 156. South Africa Hemodailysis Market Value, By Product & Service, 2019-2030, Million USD

FIGURE 157. South Africa Equipment Market Value, By Product & Service, 2019-2030, Million USD

FIGURE 158. South Africa Consumables Market Value, By Product & Service, 2019-2030, Million USD

FIGURE 159. Remaing Countries Hemodailysis Market Value, By Type, 2019-2030, Million USD

FIGURE 160. Remaing Countries Hemodailysis Market Value, By Product & Service, 2019-2030, Million USD

FIGURE 161. Remaing Countries Equipment Market Value, By Product & Service, 2019-2030, Million USD

FIGURE 162. Remaing Countries Consumables Market Value, By Product & Service, 2019-2030, Million USD

FIGURE 163. Asahi Kasei Corporation: NET SALES,2017-2019

FIGURE 164. B. Braun Melsungen AG: NET SALES,2017-2019

FIGURE 165. Baxter International Inc.: NET SALES,2017-2019

FIGURE 166. Cantel Medical Corp.: NET SALES,2017-2019

FIGURE 167. DaVita Inc.: NET SALES,2017-2019

FIGURE 168. Diaverum.: NET SALES,2017-2019

FIGURE 169. Fresenius Medical Care AG & Co. KGaA: NET SALES,2017-2019

FIGURE 170. Nikkiso Co., Ltd.: NET SALES,2017-2019

FIGURE 171. Nipro Corporation: NET SALES,2017-2019

FIGURE 172. NxStage Medical, Inc.: NET SALES,2017-2019

KEY PLAYERS:

  • Asahi Kasei Corporation

  • Cantel Medical Corp.

  • DaVita, Inc.

  • Diaverum

  • Fresenius Medical Care AG & Co. KGaA

  • Nikkiso Co., Ltd.

  • B. Braun Melsungen AG

  • Baxter International, Inc.

  • Nipro Corporation

  • NxStage Medical, Inc.


Frequently Asked Questions
What will be the worth of global hemodialysis market by the end of 2030?

According to the report published by Next Move Strategy Consulting, the dhemodialysis market business is expected to hit at $116.66 billion (USD) by 2030.

Which region is expected to hold the highest market share in the hemodialysis market?

North America is expected to hold the highest market share in the global market. The region is expected to witness remarkable growth as it houses the major key players in the market.

Which are the top companies in the hemodialysis industry?

Asahi Kasei Corporation, Cantel Medical Corp., DaVita, Inc., Diaverum, Fresenius Medical Care AG & Co. KGaA, Nikkiso Co., Ltd., B. Braun Melsungen AG, Baxter International, Inc., Nipro Corporation, NxStage Medical, Inc., and others.

What are the market segmentations and scope of the study?

The hemodialysis market share has been analyzed on product & service, type, end user, and geography.

How big is the hemodialysis market?

Currently (in 2019), the market value stands at USD 78.30 billion and it is anticipated to reach USD 116.66 billion by 2030.