India Battery Market By Battery Type (Primary Batteries and Secondary Batteries), By Voltage Type (Low Voltage Batteries, Medium Voltage Batteries, and High Voltage Batteries), By Power Capacity (Low Capacity Batteries, Medium Capacity Batteries, High Capacity Batteries, and Ultra High Capacity Batteries), By Self-Discharge Rate (Low, Medium, and High Self-Discharge Rate Batteries), and By Application – Analysis & Forecast, 2025–2035
Industry: Energy & Power | Lastest Edition: July 9, 2026 | No of Pages: 589 | No. of Tables: 148 | No. of Figures: 138 | Format: PDF | Report Code : EP711
India Battery Market Size & Forecast
|
Parameters |
Details |
|
Market Size in 2025 |
USD 9.29 Billion |
|
Market Size in 2026 |
USD 12.55 Billion |
|
Revenue Forecast in 2035 |
USD 78.81 Billion |
|
Growth Rate |
CAGR of 22.64% from 2026 to 2035 |
|
Market Volume in 2025 |
252.32 Million Units |
|
Market Volume in 2026 |
384.90 Million Units |
|
Volume Forecast in 2035 |
3,662.65 Million Units |
|
Growth Rate (Volume) |
CAGR of 28.44% from 2026 to 2035 |
|
Analysis Period |
2025–2035 |
|
Base Year Considered |
2025 |
|
Forecast Period |
2026–2035 |
|
Market Size Estimation |
Billion (USD) |
|
Companies Profiled |
15 |
|
Market Share |
Available for 10 Companies |
Industry Outlook
The India Battery Market size was valued at USD 9.29 billion in 2025 and reached USD 12.55 billion by 2026. The industry is projected to expand significantly, reaching USD 78.81 billion by 2035, registering a CAGR of 22.64% from 2026 to 2035. In terms of volume, the market recorded 252.32 million units in 2025, with forecasts indicating growth to 384.90 million units by 2026 and further to 3,662.65 million units by 2035, reflecting a CAGR of 28.44% over the same period.
What Are the Key Drivers, Restraints, and Opportunities Shaping the India Battery Market Through 2035?
Growth Catalyst & Risk Assessment Matrix
|
Drivers / Trends / Restraints |
(+/–) % Impact on CAGR Forecast |
Geographic Relevance |
Impact Timeline |
|
Government schemes such as PM E-DRIVE and FAME supporting rising electric vehicle adoption across passenger, commercial, and two-wheeler segments are creating sustained demand for lithium-ion battery cells, packs, and charging-linked storage solutions |
+3.1% |
India |
Short to medium term (1–4 years) |
|
Rapid expansion of solar and wind power capacity is increasing demand for grid-scale and behind-the-meter battery energy storage systems to manage intermittency and strengthen overall grid reliability |
+2.6% |
India |
Medium term (2–5 years) |
|
Expanding telecom towers, data centers, and digital infrastructure are increasing demand for reliable battery-based backup power solutions to minimize downtime and support uninterrupted operations |
+1.4% |
India |
Short to medium term (1–4 years) |
|
Heavy reliance on imported lithium-ion cells and critical raw materials such as lithium, cobalt, and nickel is exposing domestic manufacturers to currency fluctuations, supply disruptions, and elevated input costs |
–1.8% |
India |
Short to medium term (1–4 years) |
|
Government-backed Production Linked Incentive schemes are encouraging domestic cell manufacturing investment, creating opportunities for backward integration, technology transfer, and reduced import dependence across the battery value chain |
+2.2% |
India |
Medium to long term (3–7 years) |
Through our market assessment, we observed that the India Battery Market is witnessing strong growth driven by supportive electric vehicle policies, rapid renewable energy capacity additions, and expanding telecom and data center infrastructure. Increasing focus on domestic battery manufacturing under government incentive programs and rising consumer electronics demand are further strengthening market momentum. Meanwhile, heavy reliance on imported lithium-ion cells and raw materials continues posing a meaningful constraint, while production-linked incentive schemes are creating substantial long-term opportunities for domestic value chain development across the country.
Growth Driver:
How Are Government Schemes Supporting Rising EV Adoption Boosting the India Battery Market?
Through our market assessment, we observed that government schemes such as PM E-DRIVE, FAME, and various state-level electric vehicle subsidies are substantially accelerating electric vehicle adoption across passenger, commercial, and two-wheeler segments in India. These incentive programs are reducing upfront ownership costs and encouraging automakers to expand electric vehicle portfolios. Growing consumer confidence in electric mobility, expanding public charging infrastructure, and supportive state-level policies are collectively reinforcing battery demand across the automotive value chain, from cell manufacturing through pack assembly and final vehicle integration.
How Is Growing Demand for Energy Storage Due to Renewable Expansion Driving the India Battery Market?
Based on our market evaluation, we observed that rapid expansion of solar and wind power capacity across India is creating substantial demand for grid-scale and behind-the-meter battery energy storage systems. Utilities and independent power producers are increasingly deploying battery storage to manage renewable intermittency, enhance grid stability, and support round-the-clock power availability. Declining battery costs, supportive state-level storage mandates, and growing private investment in renewable-plus-storage projects are collectively strengthening procurement of advanced battery technologies across the broader Indian energy sector.
How Is Expanding Telecom and Data Center Infrastructure Fueling the India Battery Market?
Based on research conducted by NMSC, we found that the rapid expansion of telecom towers, data centers, and digital infrastructure across India is creating sustained demand for reliable battery-based backup power solutions. Telecom operators and data center providers are increasingly adopting lithium-ion and advanced lead-acid batteries to minimize downtime and ensure uninterrupted operations amid frequent grid fluctuations. Rising digitalization, accelerating 5G network rollout, and growing cloud computing adoption are further strengthening demand for industrial-grade battery storage solutions across the telecom and IT infrastructure sectors nationwide.
Growth Inhibitor:
How Is Heavy Reliance on Imported Lithium-Ion Cells and Raw Materials Acting as a Restraint on the India Battery Market?
Heavy dependence on imported lithium-ion cells and critical raw materials such as lithium, cobalt, and nickel continues acting as a meaningful constraint on the India Battery Market. Through our market analysis, we observed that limited domestic mineral reserves and underdeveloped cell manufacturing capacity are forcing manufacturers to rely substantially on imports from China and other supplying nations. This dependence exposes the domestic battery industry to currency fluctuations, geopolitical supply disruptions, and elevated input costs, creating pricing pressure and procurement uncertainty across the broader battery value chain.
Growth Opportunity:
How Is Development of Domestic Battery Manufacturing Under PLI Schemes Unlocking Opportunities in the India Battery Market?
Through NMSC’s assessment, we found that government-backed Production Linked Incentive schemes are creating significant long-term opportunities for domestic battery cell manufacturing and value chain localization across India. These programs are attracting substantial capital investment from domestic and international players seeking to establish gigafactories and cell assembly facilities. Growing technology transfer partnerships, backward integration into raw material processing, and expanding recycling infrastructure are further strengthening India’s position toward reduced import dependence and a self-reliant, globally competitive battery manufacturing ecosystem over the long term.
SWOT Analysis of the India Battery Market

India’s battery market is supported by expanding domestic manufacturing capacity, strong government incentives, and rising electric vehicle adoption. However, dependence on imported lithium and other critical materials creates supply chain challenges. Growing demand for energy storage presents significant opportunities, while raw material price volatility and increasing global competition remain key market risks.
How Is the India Battery Market Segmented in This Report, and What Are the Key Insights from the Segmentation Analysis?
By Battery Type
How Is Battery Type Segmentation Reflecting Demand Trends in the India Battery Market?
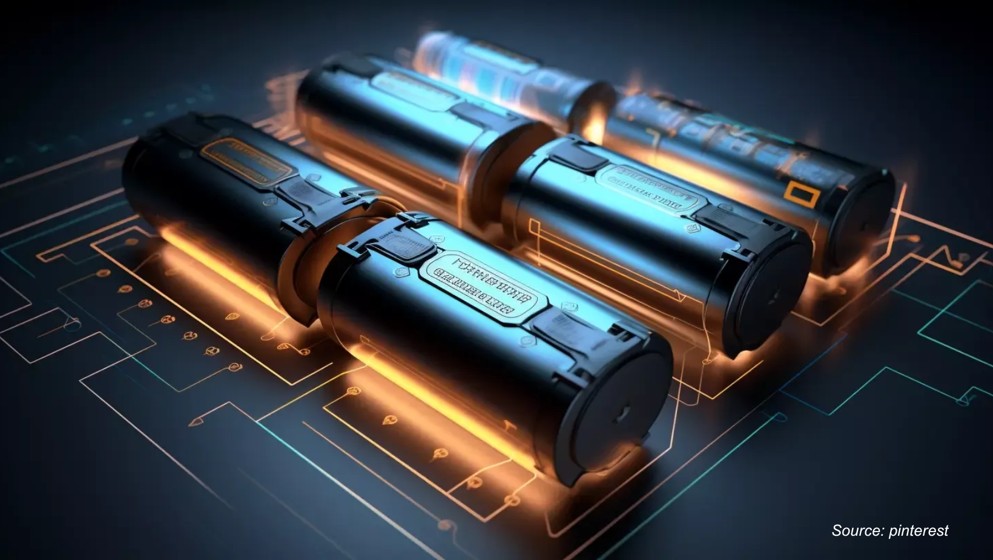
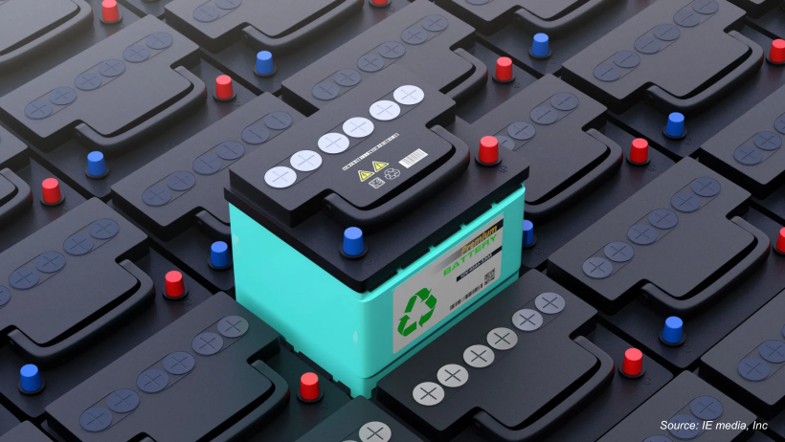
Based on battery type, the India Battery Market is segmented into Primary Batteries, including Alkaline, Zinc-Carbon, Lithium Primary, and Other Primary Batteries, and Secondary Batteries, including Lead-Acid, Nickel-Based, Lithium-ion, Sodium-Ion, Flow, and Other Secondary Batteries.
Based on our analysis, we observed that secondary batteries, particularly lithium-ion variants, dominate the India Battery Market, supported by their extensive deployment across electric vehicles, energy storage systems, and consumer electronics. Growing investments in domestic cell manufacturing and battery swapping infrastructure are accelerating lithium-ion adoption across passenger and commercial mobility segments. Lead-acid batteries continue generating steady demand across automotive starting, lighting, and ignition applications and backup power systems, while primary batteries maintain a stable presence in low-power devices, remote controls, and portable electronics where replaceable, non-rechargeable power sources remain preferred.
By Self-Discharge Rate
How Is the Self-Discharge Rate Segmentation Reflecting Demand Trends in the India Battery Market?
Based on self-discharge rate, the India Battery Market is segmented into Low Self-Discharge Rate Batteries, Medium Self-Discharge Rate Batteries, and High Self-Discharge Rate Batteries.
Based on our analysis, we observed that low self-discharge rate batteries dominate the India Battery Market, supported by their widespread use in electric vehicles, energy storage systems, backup power solutions, and critical industrial applications where long-term charge retention is essential. Medium self-discharge rate batteries maintain strong demand across consumer electronics, power tools, and portable devices that require a balance between performance and cost efficiency. High self-discharge rate batteries continue serving niche applications requiring rapid power delivery and frequent cycling, while accounting for a comparatively smaller share of overall market demand.
Key Segments
By Battery Type
-
Primary Batteries (Non-rechargeable)
-
Alkaline
-
Zinc-Carbon
-
Lithium Primary
-
Lithium Manganese Dioxide (Li-MnO2)
-
Lithium Thionyl Chloride (Li-SOCl2)
-
-
Other Primary Batteries
-
-
Secondary Batteries (Rechargeable)
-
Lead-Acid Batteries
-
Flooded
-
VRLA
-
-
Nickel-Based
-
Nickel-Cadmium (NiCd) Batteries
-
Nickel-Metal Hydride (NiMH) Batteries
-
-
Lithium-ion Batteries
-
Lithium Nickel Manganese Cobalt (LI-NMC)
-
Lithium Iron Phosphate (LFP)
-
Lithium Cobalt Oxide (LCO)
-
Lithium Titanate Oxide (LTO)
-
Lithium Manganese Oxide (LMO)
-
Lithium Nickel Cobalt Aluminum Oxide (NCA)
-
-
Sodium-Ion
-
Flow Batteries
-
Other Secondary Batteries
-
By Voltage Type
-
Low Voltage Batteries (1V - 12V)
-
Medium Voltage Batteries (24V - 100V)
-
High Voltage Batteries (200V - 1000V)
By Power Capacity
-
Low Capacity Batteries (Up to 1,000 mAh)
-
Medium Capacity Batteries (1,000 mAh to 10,000 mAh)
-
High Capacity Batteries (10,000 mAh to 100,000 mAh)
-
Ultra High Capacity Batteries (More than 100,000 mAh)
By Self-Discharge Rate
-
Low Self-Discharge Rate Batteries
-
Medium Self-Discharge Rate Batteries
-
High Self-Discharge Rate Batteries
By Application
-
Automotive
-
ICE Engines
-
Passenger Cars and Motorcycles
-
Commercial Trucks and Buses
-
-
Electric Vehicles
-
E-Bikes & 3-Wheelers
-
Passenger Electric Vehicles
-
Commercial Trucks and Buses
-
Off-Highway Electric Vehicles
-
-
-
Consumer Electronics
-
Portable Computing
-
Mobile Communication
-
Wearables and Hearables
-
Power Tools and Garden Equipment
-
Portable Power Banks
-
-
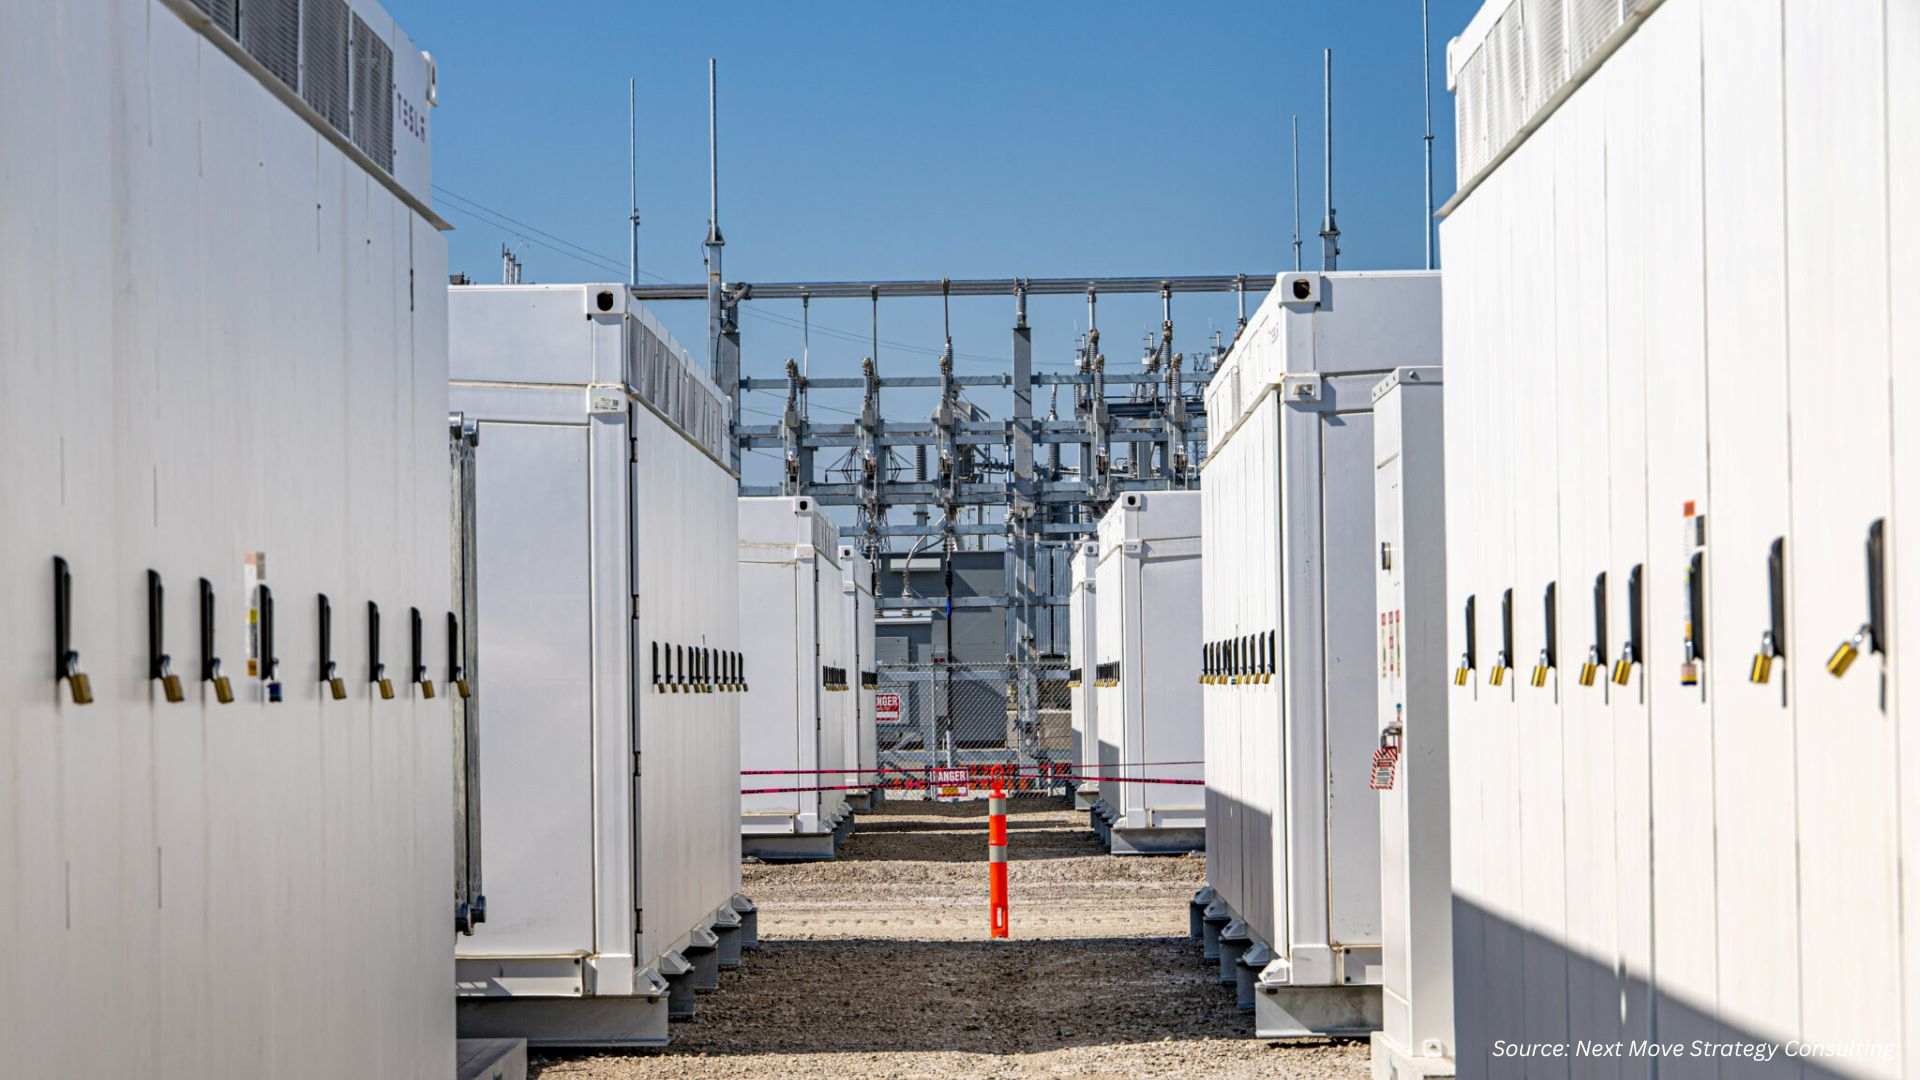
Energy Storage Systems
-
Grid-Scale Storage
-
Commercial and Industrial Storage
-
Residential Storage
-
-
Industrial and Infrastructure
-
Telecom Infrastructure
-
Uninterruptible Power Supply
-
Aerospace and Defense
-
Marine
-
Medical Devices
-
Oil and Gas
-
-
Other Applications
Consumer Behavior Analysis of the India Battery Market

The India battery market consumer journey is shaped by increasing awareness of EV batteries, energy storage systems, and government incentive programs. Buyers evaluate batteries based on performance, charging speed, safety, lifespan, and overall value. Purchase decisions are commonly made through OEMs, dealers, distributors, and online channels. Long-term loyalty is driven by battery reliability, efficiency, durability, and strong warranty and after-sales support.
Competitive Landscape
The India Battery Market is characterized by a highly competitive and rapidly evolving structure, supported by a combination of established domestic manufacturers, international battery cell producers expanding local operations, and emerging companies developing next-generation energy storage solutions. Market competition is intensifying as producers invest in advanced cell chemistries, automated manufacturing processes, recycling capabilities, and strategic partnerships with automakers and energy storage developers. Growing government incentives are attracting additional entrants and encouraging capacity expansion, further diversifying the competitive landscape across automotive, energy storage, and industrial battery segments nationwide.
Strategic Developments:
-
April 2026 - Amara Raja Energy & Mobility Limited announced plans to increase cumulative lithium battery storage deployments in India's telecom sector to 2 GWh by 2026, following installations across more than 50,000 telecom sites nationwide.
-
March 2026 - Exide Industries Limited invested USD 52.5 million into subsidiary Exide Energy Solutions to support its Bengaluru lithium-ion cell manufacturing project, one of India's largest battery-cell investments.
Key Players of the India Battery Market
-
Amara Raja Energy & Mobility Limited
-
HBL Engineering Limited
-
Luminous Power Technologies Private Limited
-
Okaya Power Private Limited
-
Livguard Energy Technologies Private Limited
-
Panasonic Energy India Company Limited
-
Eveready Industries India Limited
-
Duracell India Operations Private Limited
-
Energizer India Private Limited
-
Leoch Batteries India Private Limited
-
V-Guard Industries Limited
-
Exide Industries Limited
-
Microtek International Private Limited
-
Tata AutoComp GY Batteries Private Limited
-
Tesla India Motors and Energy Private Limited
NMSC’s analysis indicates that competitive dynamics in the India Battery Market are increasingly shaped by manufacturing scale, chemistry capabilities, and strategic alignment with automotive and energy storage customers. Key companies including Amara Raja Energy & Mobility Limited, HBL Engineering Limited, Luminous Power Technologies Private Limited, Okaya Power Private Limited, Livguard Energy Technologies Private Limited, Panasonic Energy India Company Limited, Eveready Industries India Limited, Duracell India Operations Private Limited, Energizer India Private Limited, Leoch Batteries India Private Limited, V-Guard Industries Limited, Exide Industries Limited, Microtek International Private Limited, Tata AutoComp GY Batteries Private Limited, and Tesla India Motors and Energy Private Limited are advancing their positions through capacity investment, technology differentiation, and long-term supply agreements with automakers and utilities.
Key Benefits for Stakeholders
Next Move Strategy Consulting (NMSC) presents a comprehensive analysis of the India Battery Market, covering historical developments through 2025 and providing detailed forecasts through 2035. Our study evaluates market performance across key battery types, voltage categories, power capacities, self-discharge rates, and application segments, delivering quantitative outlooks alongside qualitative insights into battery chemistry advancements, domestic manufacturing expansion, and renewable energy integration trends shaping the long-term competitive trajectory of the Indian battery ecosystem and its diverse downstream end-use markets.
Investors and strategic stakeholders benefit from granular insights into domestic battery manufacturing growth, government incentive programs, and technology investment priorities shaping the India Battery Market. Automakers, energy storage developers, consumer electronics manufacturers, and industrial end-users gain access to detailed segmentation analysis spanning battery type, voltage, capacity, self-discharge rate, and application, supporting informed procurement, investment, and strategic decision-making across the rapidly evolving Indian battery value chain and its diverse downstream applications nationwide.
|
Parameters |
Details |
|
Customization Scope |
Free customization (equivalent to up to 80 analyst-working hours) after purchase. |
|
Pricing and Purchase Options |
Avail customized purchase options to meet your exact research needs. |
|
Approach |
In-depth primary and secondary research; proprietary databases; rigorous quality control and validation measures. |
|
Analytical Tools |
Porter’s Five Forces, SWOT, value chain, and Harvey ball analysis to assess competitive intensity, stakeholder roles, and relative impact of key factors. |
Conclusion
The India Battery Market is positioned for strong and sustained growth over the 2025–2035 forecast period, supported by robust government incentives for electric vehicle adoption, expanding renewable energy and grid-scale storage deployments, and growing telecom and data center backup power demand. While heavy reliance on imported lithium-ion cells and raw materials presents a near-term challenge, Production Linked Incentive schemes and expanding domestic manufacturing capacity are expected to reinforce long-term competitiveness. The market’s competitive landscape is evolving toward greater supply chain localization, technological differentiation, and sustainability-focused production nationwide.
")

About the Author
 Mihul Sharma is a research professional with 1 year of experience in business research and market analysis. He has developed a solid foundation in research methodologies, data analysis, and market intelligence, enabling him to identify meaningful insights that support strategic business decisions. With a keen analytical mindset and a commitment to continuous learning, Mihul approaches every project with curiosity, attention to detail, and a results-oriented perspective. He is passionate about expanding his expertise, staying updated with industry trends, and contributing to impactful research initiatives. Beyond work, Mihul enjoys reading about emerging business trends, exploring new technologies, and travelling to discover different cultures and perspectives.
About the Reviewer
 Supradip Baul is an accomplished business consultant and strategist with over a decade of rich experience in market intelligence, strategy, technology, and business transformation. His work has included rigorous qualitative and quantitative analysis across multiple industries, helping clients shape investment decisions and long-term roadmaps. Earlier in his career, he was associated with Gartner, where he contributed to industry-leading reports and market share analyses. He has worked with leading global companies and holds an MBA with a dual specialization in Marketing and Finance.
At Next Move Strategy Consulting, we understand that insightful market research is the cornerstone of successful business decisions. That's why we employ a robust and multifaceted approach, combining various methodologies to deliver the most accurate and actionable data for our clients.

Research Landscape
We navigate the world of research with two primary approaches:
Qualitative Approach
Our qualitative research methodologies involve immersive techniques such as in-depth interviews, focus groups, and observational studies. By engaging directly with individuals and stakeholders, we uncover valuable insights that quantitative data alone may overlook.

Quantitative Research
In tandem with qualitative methodologies, NMSC leverages the power of Quantitative Research to provide a robust foundation of numerical insights. Through systematic data collection and analysis, we quantify patterns, preferences, and market trends, offering a comprehensive view of the business landscape.
Our quantitative research approach employs diverse tools, including surveys, experiments, and statistical modelling. These methodologies enable us to gather data from a large and representative sample, ensuring the statistical significance of our findings. By employing structured questionnaires and standardized data collection methods, we guarantee the reliability and validity of the information we present to our clients.
Quantitative research is particularly effective in measuring the prevalence of trends, assessing market size, and gauging the impact of various factors on consumer behavior. The numerical precision attained through this approach equips our clients with actionable insights, facilitating data-driven decision-making and strategy formulation.


Our Specialized Toolbox for Industry-Specific Market Research
We deploy a specialized arsenal of techniques tailored to meet your unique requirements. Here's a glimpse into our comprehensive toolbox:

Information Procurement
The stage entails acquiring market data or relevant information through various sources and methodologies.


Market Research Approach
We utilize both top-down and bottom-up approaches in market research analysis to achieve a comprehensive understanding of the market dynamics, leveraging the broad perspective of industry trends and macroeconomic factors alongside detailed insights from specific segments and individual companies.

Porters Five Forces Analysis
We conduct Porter's Five Forces analysis to evaluate the competitive landscape of an industry, providing us with insights into factors that affect profitability and strategic positioning.

SWOT Analysis

Forecasting
We utilize a forecasting model to predict future consumption by considering parameters like population, economics, regulations, market competition, drivers, constraints, technology, and pricing. We also employ statistical techniques such as multilinear regression, exponential smoothing, moving average, ARIMA, and Monte Carlo simulations for accurate predictions. In econometric forecasting, we analyzed short-term and long-term event impacts, attributing values based on regulatory frameworks, economic factors, and market events.


 Speak to Our Analyst