LEO Satellite Market Global Industry Analysis and Forecast (2026–2035)

The LEO Satellite Market size was USD 19.40 Billion in 2025, projected to reach USD 98.00 Billion by 2035, growing at a CAGR of 16.39% from 2026 to 2035. Key drivers include the expansion of satellite constellations, increasing defense procurement, and growing adoption of satellite-enabled phone connectivity, with North America leading the global market.

Download Free Sample PDF
Base Year (2025)
$19.40 Billion
Forecast (2035)
$98.00 Billion
CAGR (2026-2035)
16.4%
Top Region
North America

What Is the LEO Satellite Market Size?

The global LEO Satellite Market reached USD 19.40 Billion in 2025 and is estimated at USD 25.00 Billion in 2026. It is forecast to reach USD 98.00 Billion by 2035, growing at a 16.39% CAGR from 2026 to 2035. North America leads with about a 55% share, while satellite services hold about 67% of 2025 revenue.

Our analysis shows that growth rests on three forces: rising subscriber counts, defense funding, and phone connectivity from orbit.

LEO Satellite Market Global Industry Analysis and Forecast (2026–2035) Revenue Forecast

Values in USD Billion

2025 $19.40 Billion
2025
2026 $25.00 Billion
2026
2027 $29.10 Billion
2027
2028 $33.87 Billion
2028
2029 $39.42 Billion
2029
2030 $45.88 Billion
2030
2031 $53.40 Billion
2031
2032 $62.15 Billion
2032
2033 $72.34 Billion
2033
2034 $84.19 Billion
2034
2035 $98.00 Billion
2035

Key Takeaways

By Offering: Satellite services held the largest share with USD 12.95 Billion in 2025 and is projected to reach USD 66.00 Billion by 2035; Satellite manufacturing is the fastest-growing at 17.79% CAGR (2026–2035).

By Application: Broadband and mobile connectivity held the largest share with USD 12.40 Billion in 2025 and is projected to reach USD 70.00 Billion by 2035, and it also grows fastest at 17.26% CAGR (2026–2035).

By End User: Consumer held the largest share with USD 7.60 Billion in 2025 and is projected to reach USD 41.00 Billion by 2035; Government and defense is the fastest-growing at 16.92% CAGR (2026–2035).

Dominant Region: North America dominated with USD 10.60 Billion in 2025, about 55% of global revenue, and is projected at USD 46.00 Billion by 2035.

Fastest-Growing Region: Middle East & Africa is expected to grow at 18.78% CAGR (2026–2035), rising from USD 1.30 Billion in 2025 to USD 8.00 Billion by 2035.

Dominant Country: The U.S. led the market with USD 9.60 Billion in 2025, projected to reach USD 41.00 Billion by 2035.

Fastest-Growing Country: India is the fastest-growing at 24.14% CAGR (2026–2035), from USD 0.20 Billion in 2025 to USD 2.10 Billion in 2035.

The LEO Satellite Market presents an absolute opportunity of USD 73.00 Billion between 2026 and 2035, which signals expanding revenue pools for operators, manufacturers, and data providers.

According to NMSC analysis, spectrum ownership now matters more than satellite count, as the Amazon and Rocket Lab acquisitions of Globalstar and Iridium show.

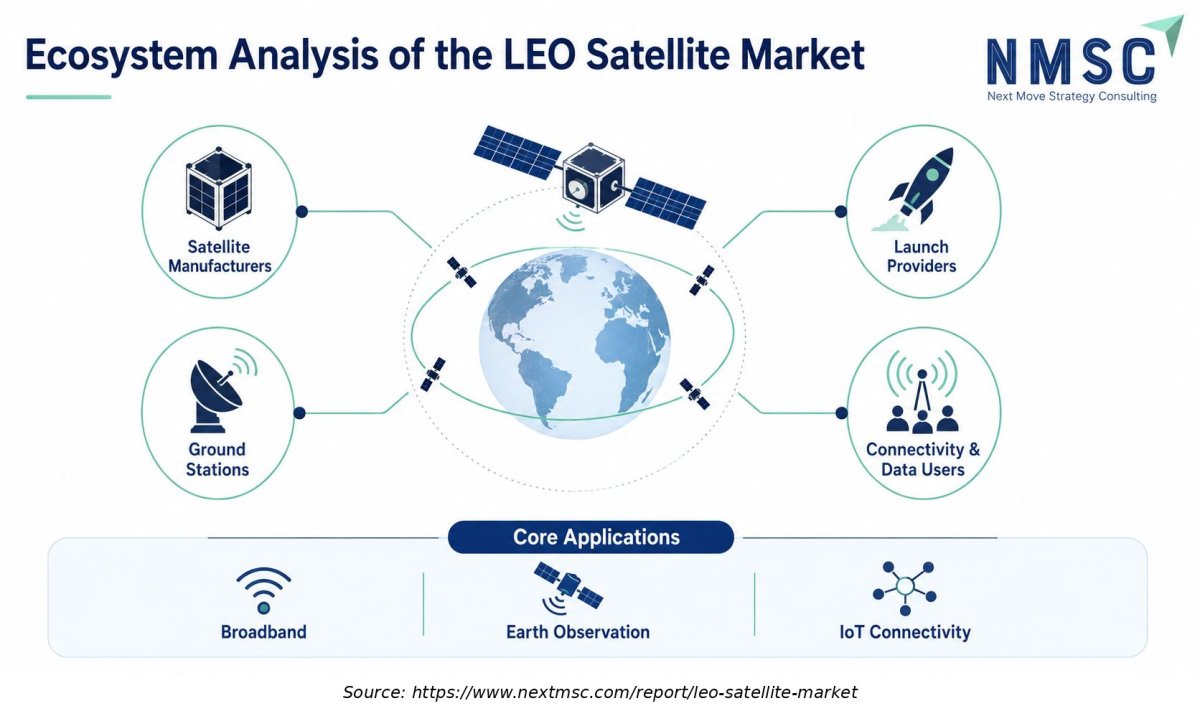
Ecosystem Analysis of the LEO Satellite Industry

The above infographic provides a detailed ecosystem analysis of the Low Earth Orbit (LEO) satellite market, mapping out the interconnected roles of satellite manufacturers, launch providers, ground stations, and data users orbiting the globe. It illustrates how these key players collaborate to enable essential services. Ultimately, the diagram highlights the core applications driving this ecosystem: broadband internet, Earth observation, and IoT connectivity.

What Does the LEO Satellite Market Encompass?

The LEO Satellite Market covers revenue from services delivered by satellites orbiting between 160 and 2,000 kilometers, the ground gear that connects to them, and satellites built for outside customers. It spans satellite internet, mobile links, Earth observation data, IoT connectivity, and defense constellations. Launch services, in-house satellite manufacturing, and GEO or MEO systems are excluded to prevent double counting.

Structural change defines 2025 and 2026. Operators now run thousands of satellites, and regulation shapes the sector as much as technology does. The FCC approved 7,500 additional Gen2 Starlink satellites in January 2026, and the ITU reports that 2.2 billion people remain offline. Governments also fund sovereign networks, including the EU’s IRIS² programme, which advanced in August 2026.

Market Drivers & Dynamics

Interactive Dataset
Connectivity gap and rising subscriber counts driver +4.1% Global 2026–2035
Defense proliferated LEO programs in the US and Europe driver +2.8% North America, Europe 2026–2033
Direct-to-device mobile service launches driver +2.2% Global 2026–2035
Regulatory approvals for larger constellations driver +1.6% North America, Europe 2026–2030
Lower satellite and launch cost per unit driver +1.2% Global 2026–2032
Orbital congestion and collision risk restraint −1.9% Global 2026–2035
Spectrum coordination and landing rights delays restraint −1.5% Asia-Pacific, Middle East & Africa, Latin America 2026–2032
High capital intensity and replenishment cycles restraint −1.1% Global 2026–2035
Terminal affordability in lower-income markets restraint −0.8% Middle East & Africa, Latin America 2026–2030
Source: Next Move Strategy Consulting

Growth Drivers

What Is the Primary Growth Driver in the LEO Satellite Market?

Subscriber growth is the primary driver. SpaceX reported 8.9 million Starlink subscribers at the end of 2025 and 10.3 million by 31 March 2026. Its Connectivity segment earned USD 11.39 Billion in 2025, up 49.8%. ITU data show 2.2 billion people offline, and 58% of rural residents use the internet, compared with 85% in cities. This unserved base sustains demand for broadband from mega constellations.

How Is Public Funding Driving the LEO Satellite Market Growth?

Public programs expand demand and lower entry barriers. The FCC added 7,500 Gen2 Starlink satellites to its authorization in January 2026. The EU advanced IRIS² with an implementation agreement in August 2026, and Airbus began building its satellites a month later. Defense agencies in the United States also fund hundreds of satellites, which supports manufacturers and ground suppliers across the forecast period.

Growth Inhibitors

What Is Restraining the LEO Satellite Market?

Orbital congestion is the main restraint. ESA’s 2026 Space Environment Report warns that low Earth orbit is growing more crowded and that many objects fail to leave busy orbits. More satellites raise collision risk, force avoidance maneuvers, and invite tighter debris rules. Capital intensity adds pressure, because launch services and replacement cycles consume large budgets, and smaller operators face the greatest strain.

What Are the Growth Opportunities?

Can Direct to Device Services Become a Wholesale Revenue Stream for Mobile Operators?

Mobile operators need coverage beyond towers but cannot build constellations. Wholesale access lets them sell coverage plans without owning satellites. Iridium reports more than 2.55 million active subscribers, and AST SpaceMobile gained FCC authorization in April 2026. Mobile satellite services partners that secure spectrum and carrier contracts early can win recurring revenue in this market.

Does Third Party Satellite Manufacturing Offer a Scale Opportunity?

Operators without factories must buy satellites. Eutelsat has ordered 440 replacement satellites, and Telesat is building 225 Lightspeed satellites with MDA Space. Defense agencies add further batches. Manufacturers that standardize buses, payloads, and laser links can cut unit cost and win repeat orders. Rocket Lab and York Space Systems show how public listings now fund such capacity.

Can Earth Observation and IoT Data Become Higher Margin Revenue Streams?

Data buyers pay for insight rather than bandwidth. Planet Labs reported USD 0.31 Billion of revenue for fiscal 2026, and Iridium earned USD 0.87 Billion in 2025 from voice, data, and IoT services. Agriculture, insurance, energy and government users want frequent, verified updates. Providers that bundle analytics with IoT applications such as asset tracking can lift revenue per terminal.

Segmentation Analysis

2025 (USD Billion)
2035 (USD Billion)
Satellite services 2025: $12.95 Billion | 2035: $66.00 Billion
Satellite se
Connectivity services 2025: $11.65 Billion | 2035: $58.50 Billion
Connectivity
Data and analytics services 2025: $1.30 Billion | 2035: $7.50 Billion
Data and ana
Ground segment and user terminals 2025: $1.85 Billion | 2035: $8.00 Billion
Ground segme
User terminals 2025: $1.45 Billion | 2035: $6.30 Billion
User termina
Gateways and network equipment 2025: $0.40 Billion | 2035: $1.70 Billion
Gateways and
Satellite manufacturing 2025: $4.60 Billion | 2035: $24.00 Billion
Satellite ma
Communications satellites 2025: $2.20 Billion | 2035: $11.00 Billion
Communicatio
Earth observation satellites 2025: $0.95 Billion | 2035: $4.00 Billion
Earth observ
Defense tracking and surveillance satellites 2025: $1.45 Billion | 2035: $9.00 Billion
Defense trac
Satellite services $12.95 Billion $66.00 Billion 16.04%
Connectivity services $11.65 Billion $58.50 Billion 15.82%
Data and analytics services $1.30 Billion $7.50 Billion 17.93%
Ground segment and user terminals $1.85 Billion $8.00 Billion 15.42%
User terminals $1.45 Billion $6.30 Billion 15.30%
Gateways and network equipment $0.40 Billion $1.70 Billion 15.91%
Satellite manufacturing $4.60 Billion $24.00 Billion 17.79%
Communications satellites $2.20 Billion $11.00 Billion 16.89%
Earth observation satellites $0.95 Billion $4.00 Billion 16.02%
Defense tracking and surveillance satellites $1.45 Billion $9.00 Billion 19.96%

Which Offering Leads the LEO Satellite Market?

Satellite services lead the offering axis with about 67% of 2025 revenue, led by connectivity services at USD 11.65 billion. Satellite manufacturing is the fastest-growing segment at 17.79% CAGR from 2026 to 2035, as replenishment orders and defense awards lift demand. Planet Labs reported USD 0.31 billion in revenue in fiscal 2026, which shows the rising value of data services.

2025 (USD Billion)
2035 (USD Billion)
Broadband an
Earth observ
IoT and narr
Defense spac
Segment Item 2025 (USD Billion) 2035 (USD Billion) CAGR
Broadband and mobile connectivity $10.0 USD Billion $40.0 USD Billion 18.0%
Earth observation and remote sensing $17.1 USD Billion $51.1 USD Billion 16.0%
IoT and narrowband communications $24.2 USD Billion $62.2 USD Billion 22.0%
Defense space architecture $31.3 USD Billion $73.3 USD Billion 12.0%

Segment-wise data is locked

Unlock complete segment-wise numbers for By Application.

Unlock Full Data
2025 (USD Billion)
2035 (USD Billion)
Consumer
Enterprise
Government a
Segment Item 2025 (USD Billion) 2035 (USD Billion) CAGR
Consumer $10.0 USD Billion $40.0 USD Billion 26.0%
Enterprise $17.1 USD Billion $51.1 USD Billion 16.0%
Government and defense $24.2 USD Billion $62.2 USD Billion 18.0%

Segment-wise data is locked

Unlock complete segment-wise numbers for By End User.

Unlock Full Data

Growth Opportunities

Our analysis shows that three whitespace opportunities offer the clearest return on capital.

Can Direct to Device Services Become a Wholesale Revenue Stream for Mobile Operators?

Mobile operators need coverage beyond towers but cannot build constellations. Wholesale access lets them sell coverage plans without owning satellites. Iridium reports more than 2.55 million active subscribers, and AST SpaceMobile gained FCC authorization in April 2026. Mobile satellite services partners that secure spectrum and carrier contracts early can win recurring revenue in this market.

Does Third Party Satellite Manufacturing Offer a Scale Opportunity?

Operators without factories must buy satellites. Eutelsat has ordered 440 replacement satellites, and Telesat is building 225 Lightspeed satellites with MDA Space. Defense agencies add further batches. Manufacturers that standardize buses, payloads, and laser links can cut unit cost and win repeat orders. Rocket Lab and York Space Systems show how public listings now fund such capacity.

Can Earth Observation and IoT Data Become Higher Margin Revenue Streams?

Data buyers pay for insight rather than bandwidth. Planet Labs reported USD 0.31 Billion of revenue for fiscal 2026, and Iridium earned USD 0.87 Billion in 2025 from voice, data, and IoT services. Agriculture, insurance, energy and government users want frequent, verified updates. Providers that bundle analytics with IoT applications such as asset tracking can lift revenue per terminal.

Regional Outlook

2025 (USD Billion)
2035 (USD Billion)
North Americ
Europe
Asia-Pacific
Middle East
Latin Americ
Region 2025 (USD Billion) 2035 (USD Billion) CAGR (%)
North America $10.0 USD Billion $40.0 USD Billion 9.0%
Europe $17.1 USD Billion $51.1 USD Billion 27.0%
Asia-Pacific $24.2 USD Billion $62.2 USD Billion 25.0%
Middle East & Africa $31.3 USD Billion $73.3 USD Billion 23.0%
Latin America $38.4 USD Billion $84.4 USD Billion 12.0%

Regional data is locked

Unlock complete regional numbers for this market.

Unlock Full Data

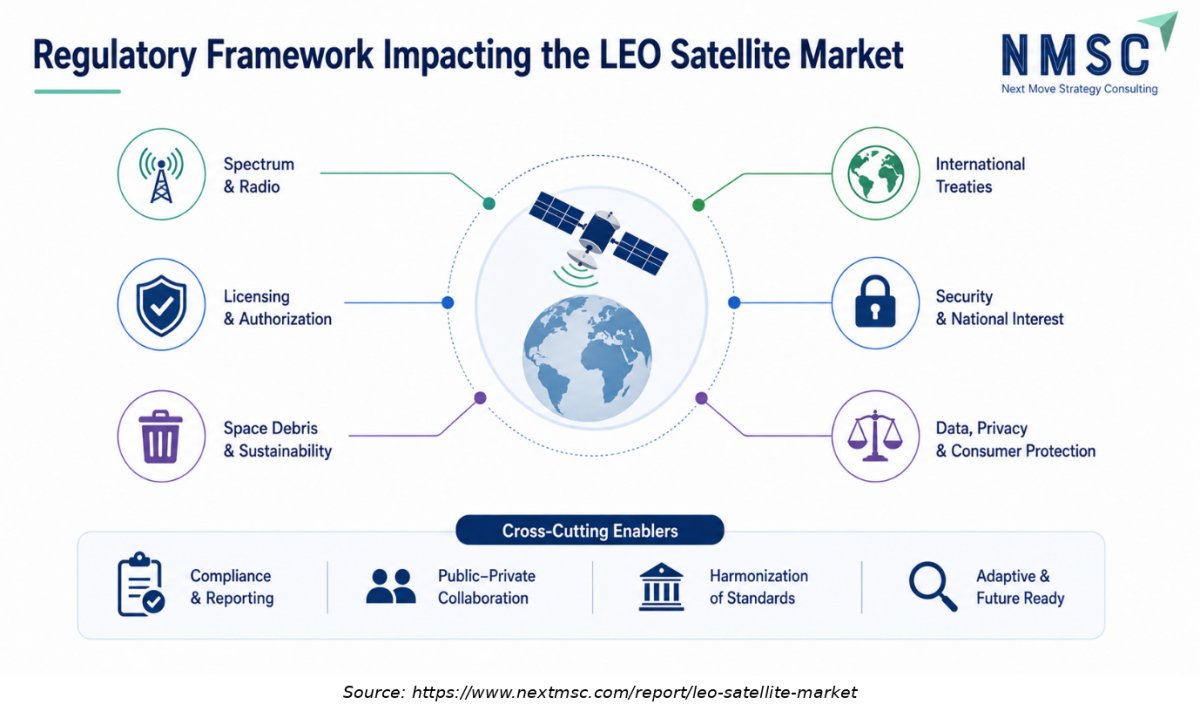
Regulatory Framework Impacting the LEO Satellite Industry

The above infographic outlines the regulatory framework impacting the LEO satellite market, identifying six key areas including spectrum management, international treaties, licensing, and space debris sustainability. It illustrates how these regulations orbit the core industry to ensure security, national interest, and consumer protection. Supported by cross-cutting enablers like public-private collaboration and adaptive standards, the framework aims to harmonize operations. Ultimately, it emphasizes that robust compliance and reporting are essential for the industry's future readiness.

Competitive Landscape

Our assessment indicates that the LEO satellite industry is concentrated at the top and fragmented below, with SpaceX far ahead of every rival.

Dimension Description
Market Structure Highly concentrated at the top. SpaceX’s Connectivity segment earned USD 11.39 Billion in 2025, while most other LEO operators earned less than USD 1.00 billion.
Innovation Focus Direct-to-device service, laser links between satellites, proliferated defense layers, and faster satellite production.
M&A Activity Amazon agreed to buy Globalstar in April 2026, and Rocket Lab agreed to buy Iridium in June 2026, with closings expected in 2027.

How Do Companies Compete in the LEO Satellite Market?

Companies compete on constellation scale, cost per delivered bit, terminal price, and spectrum rights. SpaceX leads with over 9,600 satellites, service in 164 markets, and 10.3 million subscribers by March 2026. Rivals respond with regional focus, government contracts, and wholesale deals. Consumer plans face price pressure, while enterprise and government contracts hold higher value. Geographic expansion depends on landing rights.

Which Competitive Archetypes Dominate the LEO Satellite Market?

Four archetypes shape the field. Vertically integrated operators, led by SpaceX and Amazon, build satellites and sell service. Regional and sovereign operators, including Eutelsat and Telesat, serve governments and enterprises. Specialists such as Iridium, Globalstar and AST SpaceMobile focus on narrowband and mobile links. Merchant manufacturers, including MDA Space, Airbus, Lockheed Martin, Northrop Grumman, L3Harris, Rocket Lab and York Space Systems, supply satellites to others.

What Innovation and Differentiation Strategies Are Companies Pursuing?

Differentiation centers on direct-to-device service, laser links between satellites, larger spacecraft, and faster manufacturing. We observed that operators now pair new satellites with spectrum assets, as the Iridium and Globalstar deals show. Manufacturers differentiate through standard buses and production rates. Data providers such as Planet Labs add analytics to raise revenue per satellite, while defense suppliers compete on cybersecurity and resilience.

What M&A and Partnership Activity Is Shaping the LEO Satellite Market?

Deal activity accelerated in 2026. Amazon agreed in April to acquire Globalstar, and Rocket Lab agreed to acquire Iridium at an enterprise value near USD 8.00 Billion. Partnerships also matter, such as Airbus building satellites for Eutelsat and MDA Space building Lightspeed for Telesat. Both acquisitions remain pending, so the companies stay listed separately in this report until closing.

Key Market Players

Based on research conducted by NMSC, the following 16 companies shape the LEO Satellite Market, ranked by verified LEO scale and relevance.

Space Exploration Technologies Corp. Amazon.com, Inc. Eutelsat Communications S.A. Iridium Communications Inc. Globalstar, Inc. Planet Labs PBC AST SpaceMobile, Inc. Telesat Corporation MDA Space Ltd. Airbus SE Thales S.A. Lockheed Martin Corporation Northrop Grumman Corporation L3Harris Technologies, Inc. Rocket Lab Corporation York Space Systems Inc.

Latest Developments

During our market evaluation, we noticed that 2025–2026 activity centered on consolidation, regulatory approvals and replenishment orders.

Date Event
September 2026 Airbus started developing IRIS² satellites on behalf of Eutelsat. | https://www.airbus.com/en/newsroom/press-releases/2026-09-airbus-starts-the-development-of-iris2-satellites-on-behalf-of-eutelsat
June 2026 Rocket Lab agreed to acquire Iridium at an enterprise value of about USD 8.00 Billion. | https://investors.rocketlabcorp.com
April 2026 Amazon agreed to acquire Globalstar to expand Amazon Leo and device connectivity. | https://www.sec.gov/Archives/edgar/data/1018724/000110465926042880/tm2611746d1_ex99-1.htm
January 2026 The FCC approved 7,500 additional Gen2 Starlink satellites. | https://docs.fcc.gov/public/attachments/DOC-417881A1.pdf

Expert Insights

Nilesh Desai

Nilesh Desai

Director, Space Applications Centre | Indian Space Research Organisation (ISRO)

"It is high time that India goes for its own LEO constellation, whether for civilian or for strategic sector."

Analyst Interpretation

The statement highlights the strategic importance of developing domestic LEO satellite infrastructure to support broadband connectivity and national communications requirements. Government interest in sovereign satellite capabilities can create opportunities for satellite manufacturers, launch-service providers, ground-system developers and communications technology suppliers. Civilian applications include broadband access in underserved areas, while strategic requirements include secure communications and connectivity for remote operations. Such initiatives also support domestic space-sector capabilities and investment in satellite technology.

Investment Opportunities

Where Are Capital Inflows Concentrating in the LEO Satellite Market?

Capital is flowing to scaled operators and defense-linked manufacturers. SpaceX’s S-1 showed Connectivity capital expenditure of USD 4.18 Billion for 2025. Amazon agreed to acquire Globalstar, and Rocket Lab agreed to acquire Iridium in a transaction implying an enterprise value of USD 8.00 Billion. These transactions suggest that investors may value recurring service revenue and spectrum assets, alongside constellation scale.

How Is Infrastructure Investment Shaping Market Capacity?

Infrastructure spending covers satellites, gateways, terminals, and factories. SpaceX’s Space segment spent USD 3.83 Billion on capital projects in 2025, which supports launch cadence for deployment. Eutelsat’s 440-satellite order and Telesat’s 225-satellite Lightspeed program add manufacturing demand. Ground infrastructure is a growing line, since each constellation needs gateways and terminals in every served country.

What ESG Considerations Are Influencing Market Investment?

Environmental and governance factors increasingly shape funding. ESA’s 2026 Space Environment Report highlights crowding in low Earth orbit, so investors favor operators with credible deorbit plans and collision avoidance systems. Social benefits include connecting the 2.2 billion people offline, as the ITU reported. Governance matters in sovereign networks such as IRIS², where public oversight and security rules affect supplier selection.

Key Benefits for Stakeholders

How Does This Report Benefit Industry Leaders and Telecom Operators?

Operators and telecom executives gain a reconciled market size of USD 19.40 Billion for 2025 and a forecast of USD 98.00 Billion for 2035. The report maps demand by offering, application, end user, and region, which supports partnership choices, wholesale pricing, and coverage planning. Country-level insights across 15 markets show where licensing and terminal prices shape adoption.

How Does This Report Benefit Investors and Financial Analysts?

Investors and analysts gain a transparent split of revenue between services, terminals and manufacturing, plus CAGR by segment, region and country. The assessment of the Amazon and Rocket Lab deals clarifies how consolidation affects valuation. Profiles of 16 verified companies help screen exposure to consumer broadband, defense and data services across the forecast period.

How Does This Report Benefit Satellite Manufacturers and Technology Vendors?

Manufacturers and technology vendors gain visibility into replenishment cycles, defense awards and constellation orders. The analysis shows which satellite types and terminals grow fastest, supporting capacity planning and product design. Defense buyers that expand each reconnaissance satellite program also create demand for secure payloads, and the regional analysis helps vendors prioritize export markets.

Key Market Segments Evaluated

By Offering

  • Satellite services 
    • Connectivity services
    • Data and analytics services
  • Ground segment and user terminals 
    • User terminals
    • Gateways and network equipment
  • Satellite manufacturing 
    • Communications satellites
    • Earth observation satellites
    • Defense tracking and surveillance satellites

By Application

  • Broadband and mobile connectivity
  • Earth observation and remote sensing
  • IoT and narrowband communications
  • Defense space architecture

By End User

  • Consumer
  • Enterprise
  • Government and defense

By Region

  • North America 
    • U.S.
    • Canada
    • Mexico
  • Europe 
    • UK
    • Germany
    • France
    • Italy
    • Spain
    • Sweden
    • Denmark
    • Finland
    • Netherlands
    • Rest of Europe
  • Asia-Pacific 
    • China
    • India
    • Japan
    • South Korea
    • Taiwan
    • Indonesia
    • Vietnam
    • Australia
    • Philippines
    • Malaysia
    • Rest of APAC
  • Middle East & Africa 
    • Saudi Arabia
    • UAE
    • Egypt
    • Israel
    • Turkey
    • Nigeria
    • South Africa
    • Rest of MEA
  • Latin America 
    • Brazil
    • Argentina
    • Chile
    • Colombia
    • Rest of LATAM

Conclusion & Recommendations

What Is the Long-Term Outlook for the LEO Satellite Market?

The LEO Satellite Market is forecast to grow from USD 25.00 Billion in 2026 to USD 98.00 Billion in 2035, a 16.39% CAGR. Services remain the largest offering, while manufacturing grows fastest. Subscriber growth, defense programs, and direct-to-device links sustain demand. Growth rates ease as markets mature, yet absolute additions stay large each year.

What Strategic Positioning Recommendations Does NMSC Offer?

Operators should secure spectrum and wholesale partners early, and manufacturers should standardize satellite buses to lower unit cost. Terminal makers should target price points suited to lower-income regions. Defense suppliers should align with proliferated architectures such as the Space Development Agency layers. Data providers should bundle analytics to lift revenue per satellite, and every group should plan for operator consolidation.

What Is the Investment Attractiveness of the LEO Satellite Market?

Investment attractiveness is high, supported by the USD 73.00 Billion opportunity between 2026 and 2035. Recurring service revenue, government contracts and spectrum assets support valuations. Risks include capital intensity and orbital congestion. We found that balanced exposure across services, terminals and manufacturing lowers concentration risk against any single operator, and that long contract backlogs at manufacturers add visibility to earnings.

What Are the Market Shifts and Key Risks in the LEO Satellite Market?

Key shifts include consolidation among operators, direct-to-device services and sovereign constellations that favor domestic suppliers. Risks include orbital debris, spectrum disputes, launch constraints, and price pressure in consumer broadband. ESA’s 2026 report signals closer scrutiny of orbital behavior, and the pending Globalstar and Iridium acquisitions still need regulatory clearance before expected 2027 closings.

What Are the Primary Growth Pathways Through 2035?

Primary pathways include wholesale mobile deals, replenishment orders, defense layers, and data analytics. Middle East & Africa grows fastest among regions at 18.78% CAGR, and India leads countries at 24.14% CAGR. Stakeholders that align capacity with these pathways can capture share through 2035 as satellite services remain the base of the LEO Satellite Market.

FAQs

Sources & References

1.

SpaceX, Form S-1 registration statement (SEC)

sec.gov
2.

SpaceX, Form 10-Q for June 30, 2026 (SEC)

sec.gov
3.

Amazon.com, Inc., Form 8-K, Globalstar acquisition (SEC)

sec.gov
4.

Eutelsat Communications, Full Year 2025–26 Results

eutelsat.com
5.

Airbus, press release on IRIS² satellites for Eutelsat

airbus.com
6.

Rocket Lab Corporation, investor relations

investors.rocketlabcorp.com
7.

Iridium Communications Inc., investor relations

investor.iridium.com
8.

Globalstar, Inc., corporate website

globalstar.com
9.

Planet Labs PBC, corporate website

planet.com
10.

AST SpaceMobile, Inc., corporate website

ast-science.com
11.

Telesat Corporation, corporate website

telesat.com
12.

MDA Space Ltd., Form 6-K (SEC)

sec.gov
13.

York Space Systems Inc., Form 8-K (SEC)

sec.gov
14.

Lockheed Martin Corporation, corporate website

lockheedmartin.com
15.

Northrop Grumman Corporation, corporate website

northropgrumman.com
16.

L3Harris Technologies, Inc., corporate website

l3harris.com
17.

Thales Group, corporate website

thalesgroup.com
18.

Space Development Agency, official website

sda.mil
19.

Federal Communications Commission, Starlink Gen2 order

docs.fcc.gov
20.

International Telecommunication Union, Facts and Figures 2025

itu.int
21.

European Space Agency, Space Environment Report 2026

sdo.esoc.esa.int
22.

European Space Agency, IRIS² implementation update

resilience.esa.int
23.

Xinhua via Gansu provincial government portal, China internet satellite launch

ydyl.gansu.gov.cn

About the Author

Mayurima Roy

Mayurima Roy

Mayurima Roy is Research Analyst at Next Move Strategy Consulting, where she has spent 4 years working across the firm's full industry coverage rather than a single fixed vertical. Her work centers on structured research, ongoing trend tracking, competitive assessment, and insight-led content development, translating complex market data into clear, decision-ready narratives that support informed client decision-making across diverse global industries, market sectors, and world regions every day.

About the Reviewer

Supradip Baul

Supradip Baul

Supradip Baul is an accomplished business consultant and strategist with over a decade of rich experience in market intelligence, strategy, technology, and business transformation. His work has included rigorous qualitative and quantitative analysis across multiple industries, helping clients shape investment decisions and long-term roadmaps. Earlier in his career, he was associated with Gartner, where he contributed to industry-leading reports and market share analyses. He has worked with leading global companies and holds an MBA with a dual specialization in Marketing and Finance.

Download Free Sample

Amos Chang

AMOS CHANG

Strategy Consultant

Kardex Group

I have bought the intralogistics market reports from NMSC two times so far. Joseph and his team are always very helpful and flexible in responding to any customization requirements on the report. Their expertise in market reports really helps us steer the day-to-day business. I will definitely recommend and come back myself whenever there is a need.

Melanie Samko

MELANIE SAMKO

Director of Marketing

TOSOH BIOSCIENCE, INC.

The information provided by NMSC is incredibly valuable, thank you so much for such a excellent work. I really appreciate it. I will make sure to reference all of it, in my summary document.

Robert Sean Trevino

ROBERT SEAN TREVINO

Sr. Director, Head of Strategic Insights & Analytics

Foundation Medicine

I realized that it was a reliable source of information. These days, there are many people who are looking for authentic data, and this is one of the only sources that can offer them with what they need;

Diana Trejo

DIANA TREJO

Assistant Manager

Sumitomo Corporation de Mexico, S.A. de C.V.

Recently, we purchased a report on the Mexico Data Center Market from Next Move Strategy Consulting. The service has been excellent, with support that is always timely and thoroughly professional. The information provided is interesting, highly useful, and delivered with clarity. I would highly recommend NextMSC for anyone seeking insightful and dependable analysis.

Henri Knyphausen

HENRI KNYPHAUSEN

Partner at Singulier [Ex-BCG]

Singulier

I recently engaged NEXTMSC.com for a commercial due diligence project within the intralogistics sector, and I am pleased to provide a reference based on my experience. In utilizing NEXTMSC.com's services, I found their report to offer valuable insights into market dynamics and key industry players. The initial report provided a solid foundation for our analysis. However, as we were investigating a smaller target in the market, and I had specific customization requests requiring additional research. These requests included detailed information on product portfolios of various players and sub-market sizes, both inclusive and exclusive of certain product categories. NEXTMSC.com demonstrated commendable responsiveness and agility in accommodating these customization requests. Within a timeframe of 1-2 weeks, they delivered a revised report that met our specific needs. Furthermore, they were receptive to my follow-up inquiries, ensuring clarity and understanding of the data provided. The final deliverable significantly contributed to our due diligence efforts. One of NEXTMSC.com's notable strengths lies in their qualitative research capabilities. However, for future engagements, I would recommend the inclusion of a quantified market model in Excel format. Such a model would offer the ability to conduct in-depth analyses and explore various market segments, including country-specific data and subcomponent breakdowns. Based on my positive experience, I would not hesitate to work with NEXTMSC.com again. Their responsiveness, willingness to accommodate customization requests, and commitment to delivering actionable insights make them a reliable partner for commercial research projects.

Custom Market Research Services

We will customize the research for you if the listed report does not fully match your requirements.

Get 30% Free Customization

Select License

This website uses cookies to ensure you get the best experience on our website. Learn more

✖