Micro-Mobility Market Size, Share, and Trends Analysis by Vehicle Type (E-Scooters, E-Bikes, Mopeds and Electric Mopeds, and Bicycles), Business Model (Shared Rental Services and Personal Ownership), Application (Urban Commuting, Last-Mile Connectivity, Food and Goods Delivery, and Recreational and Leisure), and Region — Global Industry Report and Forecast, 2026–2035
Industry: Automotive & Transportation | Publishing Date: August 13, 2026 | Last Updated: August 13, 2026 | No of Pages: N/A | No. of Tables: N/A | No. of Figures: N/A | Format: PDF | Report Code: AT5695
What Is the Micro-Mobility Market Size?
The global Micro-Mobility Market size reached USD 42.0 Billion in 2025 and is estimated at USD 48.5 Billion in 2026, forecast to reach USD 142.0 Billion by 2035 at a CAGR of 12.68% between 2026 and 2035. Asia-Pacific leads with an approximate 48% share, while E-Bikes dominate the vehicle-type segment at approximately 47% share in 2025.
We observed that shared micromobility operators are consolidating into fewer, larger platforms with improving unit economics, a shift that is pulling shared rental revenue ahead of the broader market even as personal ownership of e-bikes and mopeds remains the larger overall revenue base.
|
Key Takeaways |
|
By Vehicle Type: E-Bikes held the largest share, expanding from USD 19.74 billion in 2025 to USD 71.00 billion by 2035; Mopeds and Electric Mopeds is the fastest-growing sub-segment at 16.08% CAGR from 2026–2035. |
|
By Business Model: Personal Ownership held the largest share, expanding from USD 27.72 billion in 2025 to USD 85.20 billion by 2035; Shared Rental Services is the fastest-growing sub-segment at 14.73% CAGR from 2026–2035. |
|
By Application: Urban Commuting held the largest share, expanding from USD 20.16 billion in 2025 to USD 62.48 billion by 2035; Food and Goods Delivery is the fastest-growing sub-segment at 15.51% CAGR from 2026–2035. |
|
Dominant Region: Asia-Pacific dominated with approximately 48% revenue share in 2025. |
|
Fastest-Growing Region: Latin America is expected to register the highest CAGR of 16.34% during 2026–2035. |
|
Dominant Country: China led the market, anchored by concentrated e-bike and e-moped manufacturing and consumer adoption. |
|
Fastest-Growing Country: India is the fastest-growing country, supported by rapidly expanding shared and personal electric two-wheeler adoption. |
The market presents an absolute investment opportunity of approximately USD 93.5 Billion between 2026 and 2035, calculated as the difference between the 2035 forecast of USD 142.0 Billion and the 2026 base of USD 48.5 Billion, positioning shared fleet operators and e-bike manufacturers as a high-conviction category for urban mobility investors.
According to NMSC analysis, the segment's improving fundamentals stem from operator consolidation that has replaced years of unit-economics losses with positive free cash flow among leading shared mobility platforms, a shift that is drawing renewed institutional capital into the sector ahead of expected public listings.
What Does the Micro-Mobility Market Encompass?
The Micro-Mobility Market covers electric scooters, electric bicycles, electric mopeds, and shared bicycles used for short urban trips, sold either through personal ownership channels or shared rental platforms operated in partnership with municipalities. We observed that the market has evolved from a fragmented, loss-making shared-scooter category into a consolidated set of scaled operators achieving positive free cash flow, alongside a much larger and more mature personal e-bike and e-moped ownership market concentrated in Asia.
Our findings suggest that municipal permitting frameworks, which increasingly favor a small number of licensed operators per city over open competition, are directly reshaping competitive dynamics within the shared rental segment. Technology adoption trends toward next-generation vehicle hardware with improved battery range and swappable batteries are further extending vehicle lifecycle economics for both shared fleet operators and personal ownership manufacturers.
|
Parameter |
Details |
|
Market Size in 2025 |
USD 42.0 Billion |
|
Market Size in 2026 |
USD 48.5 Billion |
|
Revenue Forecast in 2035 |
USD 142.0 Billion |
|
Growth Rate |
CAGR of 12.68% from 2026 to 2035 |
|
Analysis Period |
2025–2035 |
|
Base Year Considered |
2025 |
|
Forecast Period |
2026–2035 |
|
Market Size Estimation |
Revenue (USD Billion) |
|
Companies Profiled |
20 |
|
Countries Covered |
38 |
|
Market Share |
Available for Top 10 Companies |
Key Emerging Trends
Based on research conducted by NMSC, we found that four structural trends are redefining how micro-mobility operators and manufacturers compete, consolidate, and expand through 2035.
How Is Operator Consolidation Transforming Shared Mobility Economics?
We found that operator consolidation is transforming shared micromobility from a fragmented, loss-making category into a smaller set of scaled, cash-generative platforms. Lime's 2025 financial results, reporting USD 886.7 million in revenue with positive free cash flow of USD 104 million, and the merger of Tier and Dott into a single European operator serving more than 400 cities across 21 countries, both exemplify how consolidation is directly improving unit economics across the sector.
What Role Does Municipal Permitting Play in Competitive Structure?
Our assessment indicates that municipal permitting frameworks are reshaping competitive structure by limiting the number of licensed operators per city, favoring platforms with proven safety records and city partnership experience. Lime reported winning more than 90% of competitive permits it pursued in top-tier cities in 2024, illustrating how permit performance has become a primary determinant of geographic market access.
How Are Stakeholders Responding to Public Market Access?
We observed that leading shared mobility operators are pursuing public listings to access growth capital following years of private funding, with Lime filing for a Nasdaq initial public offering in 2026 following its S-1 registration. This stakeholder response reflects improving investor confidence in the sector's unit economics after a period of post-pandemic consolidation and operator exits.
Why Is Delivery Application Adoption Gaining Traction Beyond Passenger Trips?
During our market evaluation, we noticed that electric mopeds and cargo-capable e-bikes are gaining traction in food and goods delivery applications distinct from passenger commuting use cases. This traction reflects delivery platform operators' need for vehicles that combine urban maneuverability with cargo capacity, expanding micro-mobility demand into a commercial logistics context beyond individual rider trips.
Growth Drivers & Restraints
Growth Catalyst & Risk Assessment Matrix
|
Factors |
Type |
(+/−) % Impact on CAGR |
Geographic Relevance |
Impact Timeline |
|
Rising urban congestion driving short-trip mode shift |
Driver |
+3.6% |
Asia-Pacific, Europe |
2026–2035 |
|
Improving shared operator unit economics and consolidation |
Driver |
+2.8% |
North America, Europe |
2026–2032 |
|
Expanding personal e-bike and e-moped adoption in Asia |
Driver |
+2.3% |
Asia-Pacific |
2026–2035 |
|
Growth of delivery platform demand for cargo-capable vehicles |
Driver |
+1.6% |
Global |
2026–2033 |
|
Renewed institutional capital access via public listings |
Driver |
+1.1% |
North America, Europe |
2026–2030 |
|
Municipal permitting caps limiting operator market entry |
Restraint |
−1.4% |
North America, Europe |
2026–2032 |
|
High fleet maintenance and battery replacement costs |
Restraint |
−1.1% |
Global |
2026–2035 |
|
Rider safety and sidewalk regulation compliance costs |
Restraint |
−0.8% |
North America, Europe |
2026–2031 |
|
Vehicle vandalism and theft affecting fleet economics |
Restraint |
−0.5% |
Global |
2026–2030 |
What Is the Primary Growth Driver of the Micro-Mobility Market?
The primary growth driver is improving shared operator unit economics combined with rapid personal e-bike and e-moped adoption across Asia-Pacific. Lime reported serving 19 million riders across 230 cities in 29 countries in 2025, up from prior years, with revenue growth of 29% year-over-year, evidencing sustained enterprise-scale demand for shared micro-mobility even as the broader personal ownership segment continues to dominate total market revenue.
How Is Operator Consolidation Driving the Micro-Mobility Market Growth?
Our analysis shows that operator consolidation is directly driving market growth, with the merged Tier-Dott entity now serving more than 400 cities across 21 countries in Europe and the Middle East following its 2024 merger completion. This scaled operating model has delivered more than 60 million euros in annual cost savings, according to company disclosures, directly improving the profitability profile that is now attracting renewed institutional investment across the sector.
What Is Restraining the Micro-Mobility Market?
We found that the primary restraint is municipal permitting caps that limit the number of licensed operators per city, constraining new entrant market access even as underlying rider demand continues to grow. Industry-derived estimates suggest that high fleet maintenance and battery replacement costs also continue to pressure shared operator margins despite recent improvements in overall unit economics.
Segmentation Analysis
Segment Sizing: By Vehicle Type
|
Segment |
2025 (USD Bn) |
2035 (USD Bn) |
CAGR% (2026–2035) |
|
E-Scooters |
10.92 |
31.24 |
10.61% |
|
E-Bikes |
19.74 |
71.00 |
13.46% |
|
Mopeds and Electric Mopeds |
5.46 |
24.14 |
16.08% |
|
Bicycles |
5.88 |
15.62 |
9.70% |
|
Total |
42.00 |
142.00 |
12.68% |
Which Vehicle Type Segment Dominates the Micro-Mobility Market?
E-Bikes lead with USD 19.74 Billion in 2025, expanding to USD 71.00 Billion by 2035, reflecting their dominant position across both personal ownership and shared fleet deployments given their versatility for longer urban and suburban electric two-wheeler trips. Mopeds and Electric Mopeds are the fastest-growing vehicle type at a 16.08% CAGR, driven by rising demand from delivery platforms requiring higher cargo capacity and longer range than standard e-bikes or e-scooters provide.
Segment Sizing: By Business Model
|
Segment |
2025 (USD Bn) |
2035 (USD Bn) |
CAGR% (2026–2035) |
|
Shared Rental Services |
14.28 |
56.80 |
14.73% |
|
Personal Ownership |
27.72 |
85.20 |
11.49% |
|
Total |
42.00 |
142.00 |
12.68% |
Which Business Model Dominates and Which Is Fastest-Growing in the Micro-Mobility Market?
Personal Ownership dominates at USD 27.72 Billion in 2025, growing to USD 85.20 Billion by 2035, reflecting the much larger scale of consumer e-bike and e-moped purchases across Asia-Pacific relative to shared fleet deployments. Shared Rental Services is the fastest-growing business model at a 14.73% CAGR, as consolidated operators with improving unit economics expand geographic coverage into new cities and countries at a faster pace than the more mature personal ownership segment.
Segment Sizing: By Application
|
Segment |
2025 (USD Bn) |
2035 (USD Bn) |
CAGR% (2026–2035) |
|
Urban Commuting |
20.16 |
62.48 |
11.59% |
|
Last-Mile Connectivity |
10.08 |
35.50 |
13.19% |
|
Food and Goods Delivery |
6.72 |
28.40 |
15.51% |
|
Recreational and Leisure |
5.04 |
15.62 |
11.59% |
|
Total |
42.00 |
142.00 |
12.68% |
Which Application Leads and Which Grows Fastest in the Micro-Mobility Market?
Urban Commuting leads application demand at USD 20.16 Billion in 2025, reflecting the core use case underpinning both personal ownership and shared rental revenue across dense metropolitan markets. Food and Goods Delivery is the fastest-growing application at a 15.51% CAGR, as delivery platform operators increasingly deploy dedicated moped and cargo e-bike fleets distinct from consumer passenger trips.
Growth Opportunities
Our analysis shows that three whitespace opportunities stand out for operators and manufacturers positioning ahead of 2035 demand.
Can Multi-City Permit Consolidation Unlock Scale Advantages for Leading Operators?
Operators with proven safety and city-partnership track records can capture a disproportionate share of new municipal permits as cities continue reducing the number of licensed operators per market, benefiting the Shared Rental Services segment as consolidation concentrates share among fewer, larger platforms.
Does Cargo E-Bike and Moped Development Create Value for Delivery Platforms?
Manufacturers developing purpose-built cargo e-bikes and delivery mopeds can capture rising demand from food and goods delivery platforms seeking vehicles optimized for payload capacity and range, benefiting the Mopeds and Electric Mopeds vehicle type and Food and Goods Delivery application segments.
Can Swappable Battery Networks Expand Personal E-Bike Adoption in Emerging Markets?
Manufacturers that build swappable battery infrastructure alongside personal e-bike and e-moped sales can capture rising demand in emerging markets where home charging access remains limited, benefiting the Personal Ownership business model and E-Bikes vehicle type segments as battery-swap networks scale.
PESTEL Analysis of the Micro-Mobility Industry
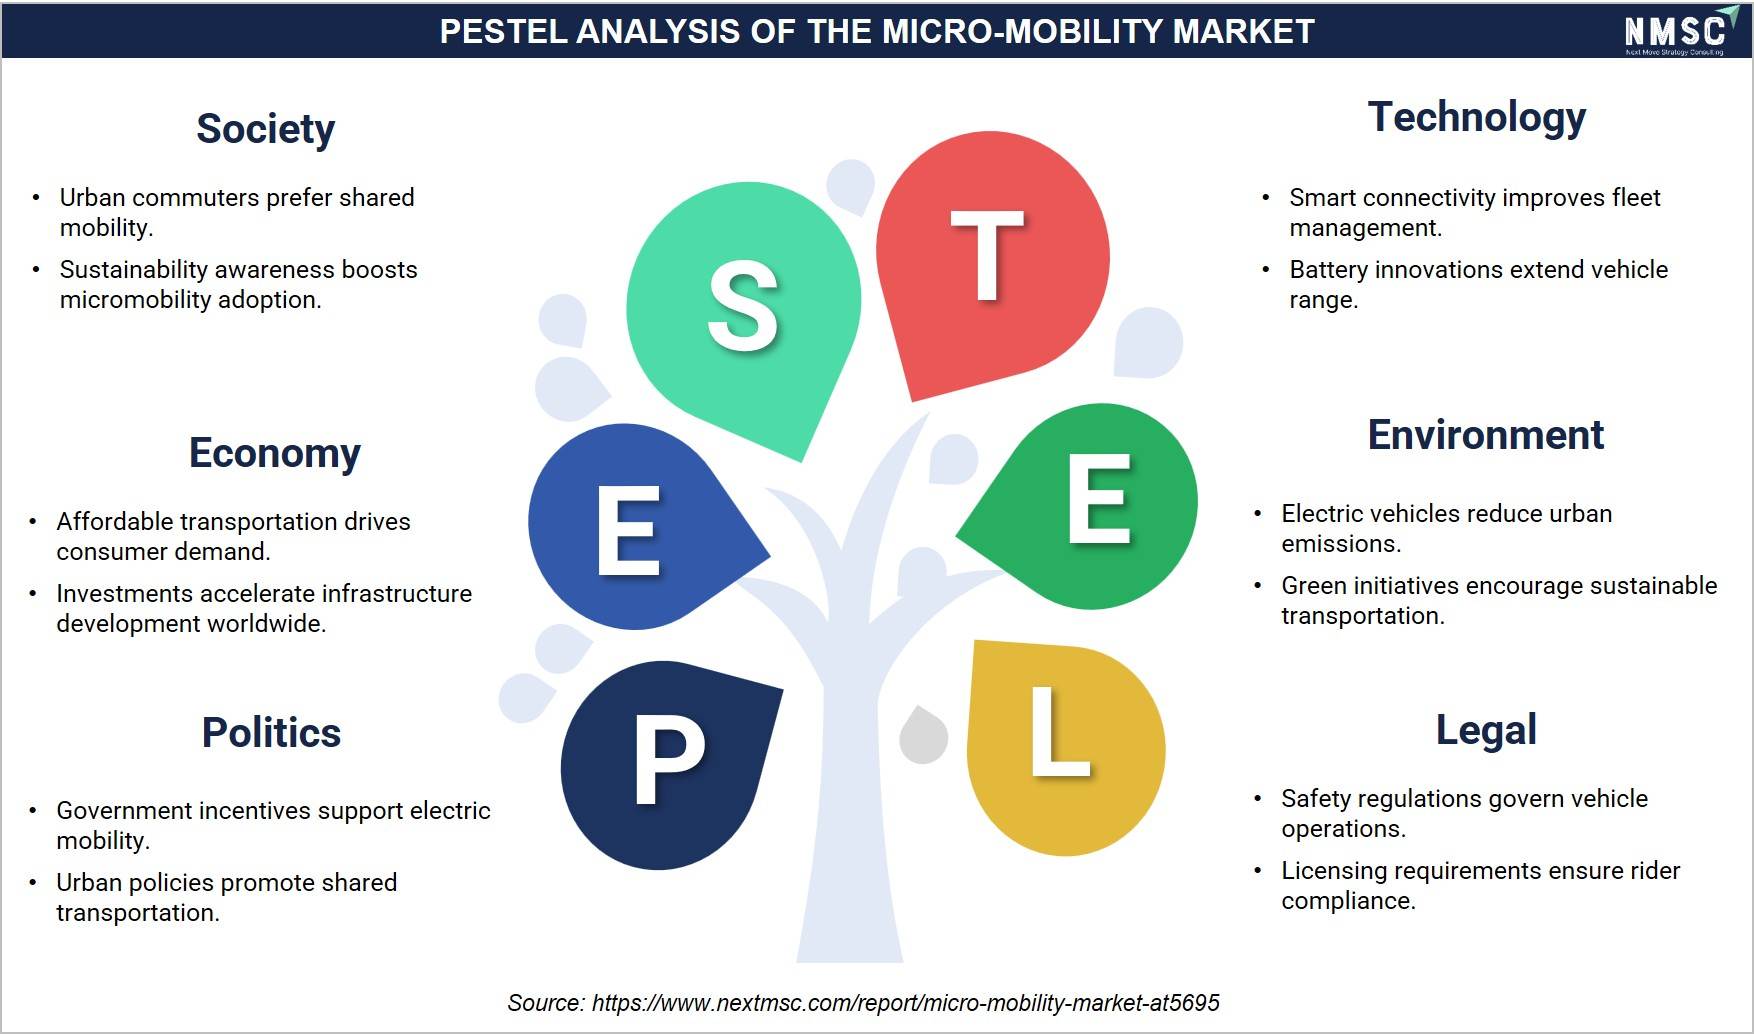
The above infographic presents a PESTEL analysis of the micro-mobility market, wherein government incentives and urban policies are encouraging electric and shared transportation adoption. Growing consumer preference for sustainable and affordable mobility is shaping social acceptance, while battery innovations and smart connectivity are improving vehicle range and fleet management efficiency. Environmental benefits, including reduced emissions and green initiatives, are further driving demand. These developments are supported by safety regulations and operational compliance standards. Looking ahead, we observed that continued policy support and technological advancements will remain central to shaping the market's growth trajectory across urban transportation ecosystems.
Regional Outlook
|
Region |
2025 (USD Bn) |
2035 (USD Bn) |
CAGR% (2026–2035) |
Key Driver |
|
Asia-Pacific |
20.16 |
71.00 |
13.19% |
Concentrated e-bike and e-moped manufacturing and consumer adoption |
|
Europe |
10.08 |
29.82 |
11.02% |
Consolidated shared operator scale following Tier-Dott merger |
|
North America |
7.56 |
22.72 |
11.21% |
Improving shared operator unit economics and municipal permit wins |
|
Latin America |
2.52 |
11.36 |
16.34% |
Expanding urban delivery platform and personal e-moped demand |
|
Middle East & Africa |
1.68 |
7.10 |
15.51% |
Growing urban mobility infrastructure investment |
|
Total |
42.00 |
142.00 |
12.68% |
|
Asia-Pacific Micro-Mobility Market
Asia-Pacific holds the largest regional share, supported by concentrated e-bike and e-moped manufacturing capacity across China and rapidly expanding consumer adoption. We observed that domestic manufacturers including Yadea, NIU, and Aima Technology are scaling production fastest in this region, reflecting integrated manufacturing capability that gives regional players a structural cost advantage in both domestic and export markets.
Europe Micro-Mobility Market
Europe's market benefits from consolidated shared operator scale following the 2024 merger of Tier and Dott into a single entity now serving over 400 cities across 21 countries. Our findings suggest that municipal permitting frameworks favoring fewer, larger operators are accelerating market concentration, with Voi Technology and Bolt maintaining strong regional positions alongside the merged Dott platform.
North America Micro-Mobility Market
North America's market is shaped by improving shared operator unit economics, with Lime reporting positive free cash flow and pursuing a 2026 public listing following strong 2025 financial results. We found that municipal permit competition remains intense in this region, with operators increasingly differentiating on safety record and city partnership depth rather than price alone.
Middle East & Africa Micro-Mobility Market
The Middle East & Africa region remains an early-stage market, with the UAE and Saudi Arabia leading urban mobility infrastructure investment tied to broader smart city development programs. Industry-derived estimates suggest regional growth will track broader urban infrastructure investment rather than micro-mobility-specific regulatory mandates, given the comparatively nascent shared fleet deployment environment in the region.
Latin America Micro-Mobility Market
Latin America is the fastest-growing region at a 16.34% CAGR, led by Brazil's expanding urban delivery platform demand and personal electric moped adoption. We observed that Argentina's urban transportation sector offers latent demand for shared and personal micro-mobility vehicles as delivery platforms increasingly favor electric two-wheelers over conventional motorcycles.
U.S. Micro-Mobility Market
Based on our estimates, the U.S. market was valued at approximately USD 5.29 Billion in 2025 and is projected to reach USD 15.90 Billion by 2035 at a CAGR near 11.2%. Demand structure is anchored by consolidated shared operator scale and municipal permit wins, with high technology penetration and strong competitive intensity between Lime, Bird Global, and Lyft.
Canada Micro-Mobility Market
The market in Canada was estimated at around USD 0.76 Billion in 2025, forecast to reach USD 2.27 Billion by 2035 at roughly 11.2% CAGR. Canada's demand structure closely mirrors U.S. shared operator adoption patterns, with growing municipal partnership programs supporting steady technology penetration and moderate competitive intensity.
UK Micro-Mobility Market
As per our estimate, the UK market stood near USD 1.51 Billion in 2025 and is expected to reach USD 4.35 Billion by 2035 at approximately 10.9% CAGR. Strong municipal shared scheme adoption and growing e-bike personal ownership support demand, with regulatory influence centered on local council licensing rather than binding national mandates.
Germany Micro-Mobility Market
According to our analysis, Germany's market was valued at about USD 1.71 Billion in 2025, projected to reach USD 5.06 Billion by 2035 at a CAGR of nearly 11.3%. Germany's demand structure benefits from strong personal e-bike ownership culture and Dott's concentrated regional operations, supporting high technology penetration across shared and personal segments.
France Micro-Mobility Market
Based on our estimates```html , France's market reached approximately USD 1.11 Billion in 2025 and is forecast to grow to USD 3.28 Billion by 2035 at around 11.3% CAGR. Demand is supported by growing municipal shared scheme adoption and Dott's origins as a Brussels-founded operator with deep regional presence, with moderate competitive intensity among established operators.
China Micro-Mobility Market
The market in China was valued at nearly USD 9.68 Billion in 2025 and is projected to reach USD 35.50 Billion by 2035 at approximately 13.8% CAGR. China's dominance reflects its unmatched e-bike and e-moped manufacturing scale, with Yadea and Aima Technology competing intensely alongside regional players for domestic and export market share.
India Micro-Mobility Market
As per our estimate, India's market was close to USD 2.42 Billion in 2025, expected to reach USD 10.65 Billion by 2035 at roughly 16.0% CAGR, the fastest among covered countries. Rapidly expanding shared and personal electric two-wheeler adoption is driving demand, with Yulu Bikes scaling shared fleet operations, though technology penetration remains moderate relative to established Asia-Pacific peers.
Japan Micro-Mobility Market
According to our analysis, Japan's market stood at about USD 1.61 Billion in 2025 and is forecast to reach USD 5.68 Billion by 2035 at approximately 13.4% CAGR. Japan's demand structure benefits from dense urban centers and growing shared mobility pilot programs, supporting rising technology penetration despite historically conservative regulatory approaches to shared vehicles.
South Korea Micro-Mobility Market
Based on our estimates, South Korea's market was valued at USD 1.01 Billion in 2025, projected to reach USD 3.90 Billion by 2035 at around 14.4% CAGR. Strong urban shared scheme adoption and growing domestic e-bike manufacturing support increasing technology adoption within a competitively intense metropolitan market.
Australia Micro-Mobility Market
As per our estimate, Australia's market reached approximately USD 0.60 Billion in 2025 and is expected to grow to USD 1.99 Billion by 2035 at roughly 12.7% CAGR. Australia's demand structure benefits from growing shared scheme adoption in major cities, positioning the country as a steady adopter of consolidated shared operator platforms.
UAE Micro-Mobility Market
Based on our estimates, the UAE market was valued at about USD 0.34 Billion in 2025 and is forecast to reach USD 1.42 Billion by 2035 at approximately 15.4% CAGR. Growing government-backed urban mobility infrastructure investment supports the UAE's emerging role as a regional shared mobility hub.
Saudi Arabia Micro-Mobility Market
According to our analysis, Saudi Arabia's market stood at around USD 0.34 Billion in 2025, projected to reach USD 1.42 Billion by 2035 at around 15.4% CAGR. Vision 2030-linked urban development initiatives are supporting early-stage investment in shared micro-mobility infrastructure across major cities.
South Africa Micro-Mobility Market
As per our estimate, South Africa's market was close to USD 0.17 Billion in 2025 and is expected to reach USD 0.64 Billion by 2035 at roughly 14.1% CAGR. A growing urban delivery sector gives South Africa the strongest technology penetration in the MEA region, supporting a strategic outlook centered on electric moped adoption among delivery platforms.
Brazil Micro-Mobility Market
Based on our estimates, Brazil's market reached approximately USD 1.26 Billion in 2025 and is projected to reach USD 5.68 Billion by 2035 at around 16.3% CAGR. Rapid urban delivery platform expansion and growing personal electric moped adoption are driving demand structure, with strategic investment appeal strengthening as regional operators scale.
Argentina Micro-Mobility Market
According to our analysis, Argentina's market was valued at about USD 0.38 Billion in 2025, forecast to reach USD 1.70 Billion by 2035 at approximately 16.2% CAGR. A growing urban transportation sector offers rising demand for shared and personal micro-mobility vehicles, though competitive intensity remains moderate given the still-developing formal shared fleet infrastructure relative to Brazil.
Competitive Landscape
Our assessment indicates that the competitive landscape spans consolidated shared mobility platforms, diversified electric two-wheeler manufacturers, and traditional bicycle brands extending into e-bikes, each competing on fleet scale, manufacturing cost, and municipal partnership depth.
|
Key Takeaways |
|
Market Structure: Fragmented; top 10 companies hold a meaningful but not dominant share of Market Share, reflecting a mix of shared mobility platforms and diversified electric two-wheeler manufacturers |
|
Innovation Focus: Swappable battery infrastructure, cargo-capable delivery vehicles, next-generation fleet hardware, and improved unit economics through operational consolidation |
|
M&A Activity: Selective consolidation among shared mobility operators, exemplified by the Tier-Dott merger, alongside organic manufacturing capacity growth among electric two-wheeler producers |
How Do Companies Compete in the Micro-Mobility Market?
Companies compete primarily on fleet scale and geographic coverage for shared operators, manufacturing cost and distribution reach for personal ownership manufacturers, and depth of municipal partnership relationships that determine permit access. Our findings suggest that scaled shared operators hold a structural advantage over smaller regional competitors, since permit competition increasingly favors platforms with proven multi-city operational track records.
Which Competitive Archetypes Dominate the Micro-Mobility Market?
Consolidated shared mobility platforms such as Lime and the merged Dott entity dominate through multi-city fleet scale and municipal relationship depth, while diversified electric two-wheeler manufacturers including Yadea and NIU Technologies compete through manufacturing cost advantage and personal ownership distribution reach. Traditional bicycle brands such as Trek and Giant differentiate through premium e-bike positioning underserved by mass-market shared fleet vehicles.
What Innovation and Differentiation Strategies Are Companies Pursuing?
We observed that leading companies are investing in swappable battery infrastructure and cargo-capable vehicle designs to extend addressable use cases beyond passenger commuting into delivery applications. Differentiation increasingly rests on operational efficiency and unit economics, since investors and municipal partners alike now evaluate operators on demonstrated profitability rather than growth metrics alone.
What M&A and Partnership Activity Is Shaping the Micro-Mobility Market?
Recent activity favors targeted consolidation among shared operators, exemplified by the 2024 merger of Tier and Dott into a single European platform and Lime's exclusive integration partnership with Uber, contributing approximately 14% of its 2025 revenue. Our analysis shows that such structures let operators achieve scale-driven cost savings and platform distribution without the operational complexity of maintaining separate competing brands.
Key Market Players
Based on research conducted by NMSC, the following companies represent the validated set of leading participants across shared micro-mobility operations and electric two-wheeler manufacturing.
-
Neutron Holdings, Inc.
-
Dott B.V.
-
Voi Technology AB
-
Bolt Technology OÜ
-
Beam Mobility Holdings Pte. Ltd.
-
Segway-Ninebot (Beijing) Technology Co., Ltd.
-
Yadea Group Holdings Ltd.
-
NIU Technologies
-
Aima Technology Group Co., Ltd.
-
Rad Power Bikes, Inc.
-
Trek Bicycle Corporation
-
Giant Manufacturing Co., Ltd.
-
Yulu Bikes Pvt. Ltd.
-
Lyft, Inc.
-
Micro Mobility Systems AG
-
Bird Global, Inc.
-
Zhejiang Luyuan Electric Vehicle Co., Ltd.
-
Bounce Infinity
-
Grab Holdings Limited
-
Cityscoot SAS
Latest Developments
We found that recent corporate activity reflects continued operator consolidation, improving financial performance, and pursuit of public capital markets access even as the overall competitive landscape remains fragmented among manufacturers.
|
Date |
Event |
|
August 2026 |
Indian electric scooter manufacturer River Mobility secured USD 120 million in Series C funding led by Elev8 Venture Partners and Claypond Capital. The company used the capital to expand its Karnataka manufacturing facility, establish a new production plant, and accelerate the rollout of additional premium electric scooter models. The investment reflects growing investor confidence in the micro-mobility ecosystem |
Consumer Behavior Analysis of the Micro-Mobility Industry
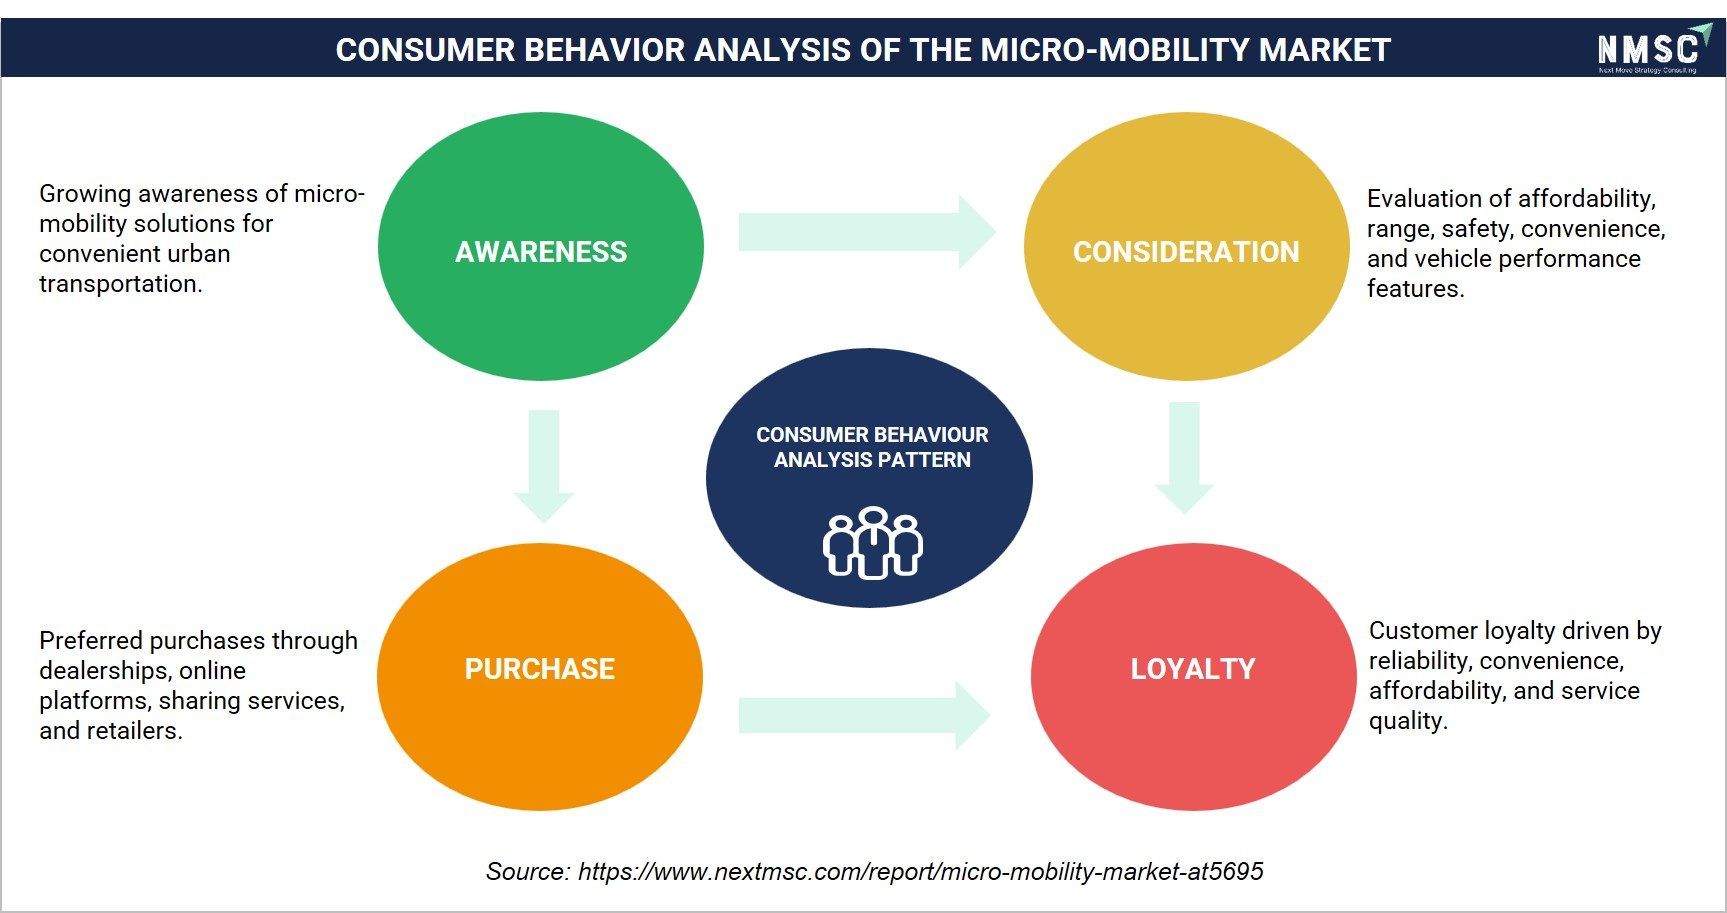
The above infographic presents a consumer behavior analysis of the micro-mobility market, mapping the journey from awareness to loyalty. Awareness is driven by growing demand for convenient urban transportation, leading consumers to evaluate affordability, range, safety, and performance before purchasing through dealerships, online platforms, and sharing services. Loyalty is reinforced by reliability, convenience, and service quality. Looking ahead, we observed that continued focus on affordability and user experience will remain key to sustaining long-term customer engagement across the market.
Investment Opportunities
Where Are Capital Inflows Concentrating in the Micro-Mobility Market?
Capital is concentrating in scaled shared mobility platforms pursuing public listings, reflected in Lime's 2026 Nasdaq IPO filing following a year of record revenue and positive free cash flow. Dott's November 2025 Nordic Bond issuance of 85 million euros further signals sustained institutional capital access for consolidated operators with demonstrated post-merger cost savings.
How Is Infrastructure Investment Shaping Long-Term Capacity?
Our findings suggest that infrastructure investment is shifting toward next-generation fleet hardware and swappable battery systems that extend vehicle lifecycle and reduce operating costs per ride. This shift favors operators and manufacturers with existing fleet renewal programs that can be scaled across new city launches without full operational redesign.
What ESG Considerations Are Influencing Investment Decisions?
Environmental, Social, and Governance considerations in this market center on urban emissions reduction and equitable transportation access, given micro-mobility's role as a lower-carbon alternative to short car trips. We found that investors increasingly favor operators demonstrating measurable car-trip displacement and emissions avoidance data as a proxy for durable, policy-aligned growth.
Key Benefits for Stakeholders
How Does This Report Benefit Industry Leaders?
Industry leaders gain segment-level revenue forecasts and CAGR benchmarks across vehicle type, business model, and application axes, enabling fleet-investment and manufacturing decisions grounded in the same 2025–2035 figures used consistently throughout this analysis. Our findings on regional growth differentials further support market-entry and municipal partnership decisions.
How Does This Report Benefit Investors and Financial Analysts?
Investors and financial analysts gain a reconciled market-sizing model, competitive-landscape assessment, and named-company development tracking that supports valuation and capital-allocation decisions. The report's Growth Catalyst & Risk Assessment Matrix quantifies driver and restraint impact on CAGR, aiding scenario analysis for portfolio positioning ahead of expected public listings.
How Does This Report Benefit Technology Vendors and Product Teams?
Technology vendors and product teams gain visibility into which vehicle-type and application segments, such as Mopeds and Electric Mopeds and Food and Goods Delivery, are growing fastest, informing where to prioritize product development and go-to-market focus through 2035.
Key Market Segments
By Vehicle Type
-
E-scooters
-
E-bikes
-
Mopeds and electric mopeds
-
Bicycles
By Business Model
-
Shared rental services
-
Personal ownership
By Application
-
Urban commuting
-
Last-mile connectivity
-
Food and goods delivery
-
Recreational and leisure
By Region
-
North America: U.S., Canada, Mexico
-
Europe: UK, Germany, France, Italy, Spain, Sweden, Denmark, Finland, Netherlands, Rest of Europe
-
Asia-Pacific: China, India, Japan, South Korea, Taiwan, Indonesia, Vietnam,```html Philippines, Malaysia, Rest of APAC
-
Middle East & Africa: Saudi Arabia, UAE, Egypt, Israel, Turkey, Nigeria, South Africa, Rest of MEA
-
Latin America: Brazil, Argentina, Chile, Colombia, Rest of LATAM
Conclusion & Recommendations
What Is the Long-Term Outlook for the Micro-Mobility Market?
The long-term outlook remains strongly positive, with the market expanding from USD 48.5 Billion in 2026 to USD 142.0 Billion by 2035 at a 12.68% CAGR, driven by operator consolidation and expanding Asia-Pacific personal ownership adoption. We observed that this growth trajectory is underpinned by improving unit economics rather than speculative expansion, supporting sustained capital investment across both shared and personal ownership segments.
What Strategic Positioning Do We Recommend?
Our assessment indicates that operators should prioritize municipal permit relationship depth and cargo-capable vehicle development to capture the fastest-growing Shared Rental Services and Food and Goods Delivery segments. Manufacturers without established swappable battery infrastructure should pursue accelerated development rather than delayed investment given rising demand in emerging markets with limited home charging access.
How Attractive Is the Market for Investment?
Investment attractiveness is high in Latin America and Asia-Pacific given superior CAGR profiles of 16.34% and 13.19% respectively, while Europe offers durable consolidation-driven growth following the Tier-Dott merger. We found that shared rental and delivery-application revenue streams offer stronger near-term growth profiles than the more mature urban commuting and recreational segments alone.
What Are the Key Market Shifts and Risks?
Key risks include municipal permitting caps that constrain new entrant market access despite strong underlying rider demand, alongside persistent high fleet maintenance and battery replacement costs for shared operators. Our analysis shows that operators unable to sustain positive unit economics risk losing municipal permit renewals to better-capitalized competitors as cities continue favoring fewer, larger licensed platforms.
What Are the Primary Growth Pathways Through 2035?
Primary growth pathways include continued shared operator consolidation, deeper cargo-capable vehicle development for delivery platforms, and swappable battery network expansion supporting personal ownership growth in emerging markets. We observed that companies combining all three pathways are best positioned to capture a disproportionate share of the USD 93.5 Billion absolute opportunity created between 2026 and 2035.
About the Author
 Mayurima Roy
— Mayurima Roy is Research Analyst at Next Move Strategy Consulting, where she has spent 4 years working across the firm's full industry coverage rather than a single fixed vertical. Her work centers on structured research, ongoing trend tracking, competitive assessment, and insight-led content development, translating complex market data into clear, decision-ready narratives that support informed client decision-making across diverse global industries, market sectors, and world regions every day.
Mayurima Roy
— Mayurima Roy is Research Analyst at Next Move Strategy Consulting, where she has spent 4 years working across the firm's full industry coverage rather than a single fixed vertical. Her work centers on structured research, ongoing trend tracking, competitive assessment, and insight-led content development, translating complex market data into clear, decision-ready narratives that support informed client decision-making across diverse global industries, market sectors, and world regions every day.
About the Reviewer
 Supradip Baul
— Supradip Baul is an accomplished business consultant and strategist with over a decade of rich experience in market intelligence, strategy, technology, and business transformation. His work has included rigorous qualitative and quantitative analysis across multiple industries, helping clients shape investment decisions and long-term roadmaps. Earlier in his career, he was associated with Gartner, where he contributed to industry-leading reports and market share analyses. He has worked with leading global companies and holds an MBA with a dual specialization in Marketing and Finance.
Supradip Baul
— Supradip Baul is an accomplished business consultant and strategist with over a decade of rich experience in market intelligence, strategy, technology, and business transformation. His work has included rigorous qualitative and quantitative analysis across multiple industries, helping clients shape investment decisions and long-term roadmaps. Earlier in his career, he was associated with Gartner, where he contributed to industry-leading reports and market share analyses. He has worked with leading global companies and holds an MBA with a dual specialization in Marketing and Finance.
At Next Move Strategy Consulting, we understand that insightful market research is the cornerstone of successful business decisions. That's why we employ a robust and multifaceted approach, combining various methodologies to deliver the most accurate and actionable data for our clients.

Research Landscape
We navigate the world of research with two primary approaches:
Qualitative Approach
Our qualitative research methodologies involve immersive techniques such as in-depth interviews, focus groups, and observational studies. By engaging directly with individuals and stakeholders, we uncover valuable insights that quantitative data alone may overlook.

Quantitative Research
In tandem with qualitative methodologies, NMSC leverages the power of Quantitative Research to provide a robust foundation of numerical insights. Through systematic data collection and analysis, we quantify patterns, preferences, and market trends, offering a comprehensive view of the business landscape.
Our quantitative research approach employs diverse tools, including surveys, experiments, and statistical modelling. These methodologies enable us to gather data from a large and representative sample, ensuring the statistical significance of our findings. By employing structured questionnaires and standardized data collection methods, we guarantee the reliability and validity of the information we present to our clients.
Quantitative research is particularly effective in measuring the prevalence of trends, assessing market size, and gauging the impact of various factors on consumer behavior. The numerical precision attained through this approach equips our clients with actionable insights, facilitating data-driven decision-making and strategy formulation.


Our Specialized Toolbox for Industry-Specific Market Research
We deploy a specialized arsenal of techniques tailored to meet your unique requirements. Here's a glimpse into our comprehensive toolbox:

Information Procurement
The stage entails acquiring market data or relevant information through various sources and methodologies.


Market Research Approach
We utilize both top-down and bottom-up approaches in market research analysis to achieve a comprehensive understanding of the market dynamics, leveraging the broad perspective of industry trends and macroeconomic factors alongside detailed insights from specific segments and individual companies.

Porters Five Forces Analysis
We conduct Porter's Five Forces analysis to evaluate the competitive landscape of an industry, providing us with insights into factors that affect profitability and strategic positioning.

SWOT Analysis

Forecasting
We utilize a forecasting model to predict future consumption by considering parameters like population, economics, regulations, market competition, drivers, constraints, technology, and pricing. We also employ statistical techniques such as multilinear regression, exponential smoothing, moving average, ARIMA, and Monte Carlo simulations for accurate predictions. In econometric forecasting, we analyzed short-term and long-term event impacts, attributing values based on regulatory frameworks, economic factors, and market events.





 Speak to Our Analyst