Nanomaterials Market Global Industry Analysis and Forecast (2026-2035)

Nanomaterials Market size was USD 19.85 billion in 2025, projected to reach USD 59.48 billion by 2035, growing at a CAGR of 11.6% from 2026 to 2035. Key drivers include rising battery electrode demand for conductive nanomaterial additives, expanding semiconductor packaging and electronics miniaturization, and growing graphene and carbon nanotube commercial-scale production, with Asia-Pacific leading the market.
Download Free Sample PDF
Base Year (2025)
$19.85 Billion
Forecast (2035)
$59.48 Billion
CAGR (2026-2035)
11.6%
Top Region
Asia-Pacific

What Is the Nanomaterials Market Size?

The global nanomaterials market size was valued at USD 19.85 billion in 2025 and is estimated at USD 22.15 billion in 2026, forecast to reach USD 59.48 billion by 2035, expanding at a 11.6% CAGR between 2026 and 2035. Asia-Pacific leads with approximately 42% share, while Inorganic Nanomaterials dominates all other offering categories with approximately 36% share.

We observed that growth is broad-based across every segmentation axis, with carbon-based nanomaterials and bottom-up synthesis techniques gaining the most pronounced structural momentum through 2035.

Nanomaterials Market Global Industry Analysis and Forecast (2026-2035) Revenue Forecast

Values in USD Billion

2025 $19.85 Billion
2025
2026 $22.15 Billion
2026
2027 $24.72 Billion
2027
2028 $27.59 Billion
2028
2029 $30.79 Billion
2029
2030 $34.36 Billion
2030
2031 $38.34 Billion
2031
2032 $42.79 Billion
2032
2033 $47.76 Billion
2033
2034 $53.30 Billion
2034
2035 $59.48 Billion
2035

Key Takeaways

By Offering: Inorganic Nanomaterials held the largest share of approximately 36% (USD 7.15 Billion) in 2025; Carbon-Based Nanomaterials is the fastest-growing sub-segment at 13.2% CAGR from 2026–2035.

By Technology: Bottom-up Synthesis held the largest share of approximately 63% (USD 12.51 Billion) in 2025; Bottom-up Synthesis is the fastest-growing sub-segment at 12.4% CAGR from 2026–2035.

By Product Form: Dispersion and Suspension held the largest share of approximately 38% (USD 7.54 Billion) in 2025; Masterbatch and Concentrate is the fastest-growing sub-segment at 15.4% CAGR from 2026–2035.

By End Use Industry: Electronics and Semiconductors held the largest share of approximately 24% (USD 4.76 Billion) in 2025; Energy and Storage is the fastest-growing sub-segment at 14.6% CAGR from 2026–2035.

By Buyer Type: Industrial End User held the largest share of approximately 42% (USD 8.34 Billion) in 2025; Healthcare Provider is the fastest-growing sub-segment at 15.2% CAGR from 2026–2035.

By Sales Channel: Direct Sales held the largest share of approximately 44% (USD 8.73 Billion) in 2025; E-Commerce is the fastest-growing sub-segment at 17.8% CAGR from 2026–2035.

Dominant Region: Asia-Pacific dominated with approximately 42% revenue share (USD 8.34 Billion) in 2025.

Fastest-Growing Region: Asia-Pacific is expected to register the highest CAGR of 13.1% during 2026–2035.

Dominant Country: U.S. led with approximately USD 3.82 Billion in 2025.

Fastest-Growing Country: India is the fastest-growing country at approximately 17.7% CAGR from 2026–2035.

Market Opportunity: The nanomaterials market is expected to create an absolute dollar opportunity of USD 37.33 billion between 2026 and 2035, presenting significant investment potential across the carbon-based material, battery-grade material, and semiconductor supply chain.

According to NMSC analysis, electronics and battery manufacturers are increasingly consolidating nanomaterial sourcing with vendors offering validated production-scale purity and consistent particle-size distribution, a shift that favors established chemical and materials science majors over early-stage specialty producers as commercial-scale qualification requirements expand through 2035.

What Does the Nanomaterials Market Encompass?

The nanomaterials market encompasses carbon-based, inorganic, and polymer and bio-based materials engineered at the nanoscale for use across electronics, healthcare, energy storage, and industrial applications. Our assessment indicates that the scope spans carbon nanotubes, graphene, metal and metal oxide nanoparticles, quantum dots, and nanocellulose supplied as dry powder, dispersion, and masterbatch product forms to OEMs, industrial end users, research institutions, and government buyers across 38 countries covered in this report.
The category has evolved from laboratory-scale research materials into commercially scaled industrial inputs, driven by rising battery electrode and semiconductor packaging demand requiring nanoscale material precision. Regulatory frameworks such as the U.S. Environmental Protection Agency's Toxic Substances Control Act nanomaterial reporting requirements and the European Union's REACH nanomaterial registration obligations shape production and handling requirements across developed markets. We observed that technology adoption is shifting toward bottom-up synthesis techniques such as chemical vapor deposition that improve yield consistency at commercial scale, a trend NMSC's analysis indicates is reshaping production capacity investment across the nanomaterials market.

Market Drivers & Dynamics

Interactive Dataset
Rising battery electrode demand for conductive nanomaterial additives driver +3.2% Asia-Pacific, Europe, North America 2026–2035
Expanding semiconductor packaging and electronics miniaturization driver +2.7% Asia-Pacific, North America 2026–2035
Growth of graphene and carbon nanotube commercial-scale production driver +2.1% Global 2026–2035
Rising nanomedicine and drug-delivery research investment driver +1.6% North America, Europe 2026–2035
Expanding sustainable packaging demand for nanocellulose materials driver +1.2% Europe, North America 2026–2032
Growth of government nanotechnology research funding in emerging economies driver +0.9% Asia-Pacific, Middle East & Africa 2026–2032
Nanomaterial toxicity and environmental health regulatory uncertainty restraint -1.5% Europe, North America 2026–2032
High production cost for high-purity nanomaterial synthesis restraint -1.0% Global 2026–2030
Standardization gaps across nanomaterial characterization protocols restraint -0.6% Global 2026–2030
Source: Next Move Strategy Consulting

Growth Drivers

What Is the Primary Growth Driver of the Nanomaterials Market?

Rising battery electrode demand for conductive nanomaterial additives is the primary driver of the market. The U.S. Department of Energy continues to fund battery manufacturing capacity expansion under its domestic battery supply chain programs, sustaining demand for conductive carbon nanotube and graphene additives. We observed that this funding continuity, combined with expanding electric vehicle production, continues to anchor baseline consumption of carbon-based nanomaterials across battery electrode manufacturing.

How Is Semiconductor Miniaturization Driving Nanomaterials Market Growth?

Expanding semiconductor packaging and electronics miniaturization is accelerating growth toward high-purity nanoparticle and quantum dot adoption across Asia-Pacific and North America. We observed that OCSiAl Group and Cabot Corporation continued expanding production capacity throughout 2025 and 2026 to meet rising conductive additive and specialty material demand from electronics manufacturers. Our assessment indicates that this capacity expansion, combined with rising semiconductor packaging complexity, continues to sustain demand growth across the nanomaterials market.

Growth Inhibitors

What Is Restraining Nanomaterials Market Expansion?

Nanomaterial toxicity and environmental health regulatory uncertainty restrain deployment velocity across the supply chain, as regulatory agencies continue developing nanomaterial-specific safety and reporting frameworks. We found that the European Union's REACH nanomaterial registration requirements extend product development timelines for manufacturers introducing new nanomaterial formulations. Smaller producers face particular exposure, as limited regulatory affairs resources reduce their ability to navigate multi-jurisdictional nanomaterial compliance compared with larger, diversified chemical manufacturers.

Segmentation Analysis

2025 (USD Billion)
2035 (USD Billion)
Inorganic Nanomaterials 2025: $7.15 Billion | 2035: $19.03 Billion
Inorganic Na
Carbon-Based Nanomaterials 2025: $5.96 Billion | 2035: $20.22 Billion
Carbon-Based
Polymer and Bio-Based Nanomaterials 2025: $4.37 Billion | 2035: $14.28 Billion
Polymer and
Hybrid and Multi-Phase Nanomaterials 2025: $1.59 Billion | 2035: $4.16 Billion
Hybrid and M
Other Nanomaterials 2025: $0.79 Billion | 2035: $1.78 Billion
Other Nanoma
Inorganic Nanomaterials $7.15 Billion $19.03 Billion 10.1%
Carbon-Based Nanomaterials $5.96 Billion $20.22 Billion 13.2%
Polymer and Bio-Based Nanomaterials $4.37 Billion $14.28 Billion 12.7%
Hybrid and Multi-Phase Nanomaterials $1.59 Billion $4.16 Billion 10.0%
Other Nanomaterials $0.79 Billion $1.78 Billion 8.1%

Which Offering Dominates the Nanomaterials Market?

Inorganic Nanomaterials led the market with USD 7.15 billion in 2025, supported by broad metal oxide nanoparticle demand across catalysis, coatings, and electronics applications. We observed that Carbon-Based Nanomaterials is the fastest-growing offering category, expanding at a 13.2% CAGR from 2026 to 2035, as battery electrode and composite manufacturers scale carbon nanotube and graphene procurement to meet rising conductive-additive specifications.

2025 (USD Billion)
2035 (USD Billion)
Top-down syn
Lithography
Other top-do
Bottom-up sy
Self-assembl
Segment Item 2025 (USD Billion) 2035 (USD Billion) CAGR
Top-down synthesis $10.0 USD Billion $40.0 USD Billion 25.0%
Lithography $17.1 USD Billion $51.1 USD Billion 11.0%
Other top-down synthesis $24.2 USD Billion $62.2 USD Billion 25.0%
Bottom-up synthesis $31.3 USD Billion $73.3 USD Billion 11.0%
Self-assembly $38.4 USD Billion $84.4 USD Billion 16.0%

Segment-wise data is locked

Unlock complete segment-wise numbers for By Technology.

Unlock Full Data

Which Technology Leads Nanomaterials Market Production?

Bottom-up Synthesis remained the leading production technology within the market, reaching USD 12.51 billion in 2025 on the strength of superior yield consistency for chemical vapor deposition and sol-gel processing techniques. Our findings suggest that Bottom-up Synthesis is also the fastest-growing technology category, registering a 12.4% CAGR from 2026 to 2035, as manufacturers increasingly favor graphene and carbon nanotube production methods that scale more cost-effectively than top-down lithographic approaches.

2025 (USD Billion)
2035 (USD Billion)
Dry powder
Dispersion a
Masterbatch
Other produc
Segment Item 2025 (USD Billion) 2035 (USD Billion) CAGR
Dry powder $10.0 USD Billion $40.0 USD Billion 27.0%
Dispersion and suspension $17.1 USD Billion $51.1 USD Billion 9.0%
Masterbatch and concentrate $24.2 USD Billion $62.2 USD Billion 19.0%
Other product forms $31.3 USD Billion $73.3 USD Billion 17.0%

Segment-wise data is locked

Unlock complete segment-wise numbers for By Product Form.

Unlock Full Data
2025 (USD Billion)
2035 (USD Billion)
Electronics
Healthcare a
Energy and s
Automotive a
Aerospace an
Segment Item 2025 (USD Billion) 2035 (USD Billion) CAGR
Electronics and semiconductors $10.0 USD Billion $40.0 USD Billion 14.0%
Healthcare and life sciences $17.1 USD Billion $51.1 USD Billion 24.0%
Energy and storage $24.2 USD Billion $62.2 USD Billion 22.0%
Automotive and mobility $31.3 USD Billion $73.3 USD Billion 12.0%
Aerospace and defense $38.4 USD Billion $84.4 USD Billion 27.0%

Segment-wise data is locked

Unlock complete segment-wise numbers for By End Use Industry.

Unlock Full Data

Which End Use Industry Leads Nanomaterials Industry Demand?

Electronics and Semiconductors remained the leading end use industry within the market, valued at USD 4.76 billion in 2025 on sustained demand for nanoscale materials in chip packaging and display manufacturing. Based on research conducted by NMSC, we found that Energy and Storage is the fastest-growing end use industry, registering a 14.6% CAGR from 2026 to 2035, as battery manufacturers scale conductive nanomaterial additive procurement to support expanding electric vehicle and grid storage production.

2025 (USD Billion)
2035 (USD Billion)
OEM
Industrial e
Research ins
Government
Healthcare p
Segment Item 2025 (USD Billion) 2035 (USD Billion) CAGR
OEM $10.0 USD Billion $40.0 USD Billion 24.0%
Industrial end user $17.1 USD Billion $51.1 USD Billion 22.0%
Research institution $24.2 USD Billion $62.2 USD Billion 20.0%
Government $31.3 USD Billion $73.3 USD Billion 22.0%
Healthcare provider $38.4 USD Billion $84.4 USD Billion 13.0%

Segment-wise data is locked

Unlock complete segment-wise numbers for By Buyer Type.

Unlock Full Data
2025 (USD Billion)
2035 (USD Billion)
Direct sales
Distributor
E-commerce
Project-base
Other sales
Segment Item 2025 (USD Billion) 2035 (USD Billion) CAGR
Direct sales $10.0 USD Billion $40.0 USD Billion 23.0%
Distributor $17.1 USD Billion $51.1 USD Billion 9.0%
E-commerce $24.2 USD Billion $62.2 USD Billion 19.0%
Project-based sales $31.3 USD Billion $73.3 USD Billion 13.0%
Other sales channels $38.4 USD Billion $84.4 USD Billion 10.0%

Segment-wise data is locked

Unlock complete segment-wise numbers for By Sales Channel.

Unlock Full Data

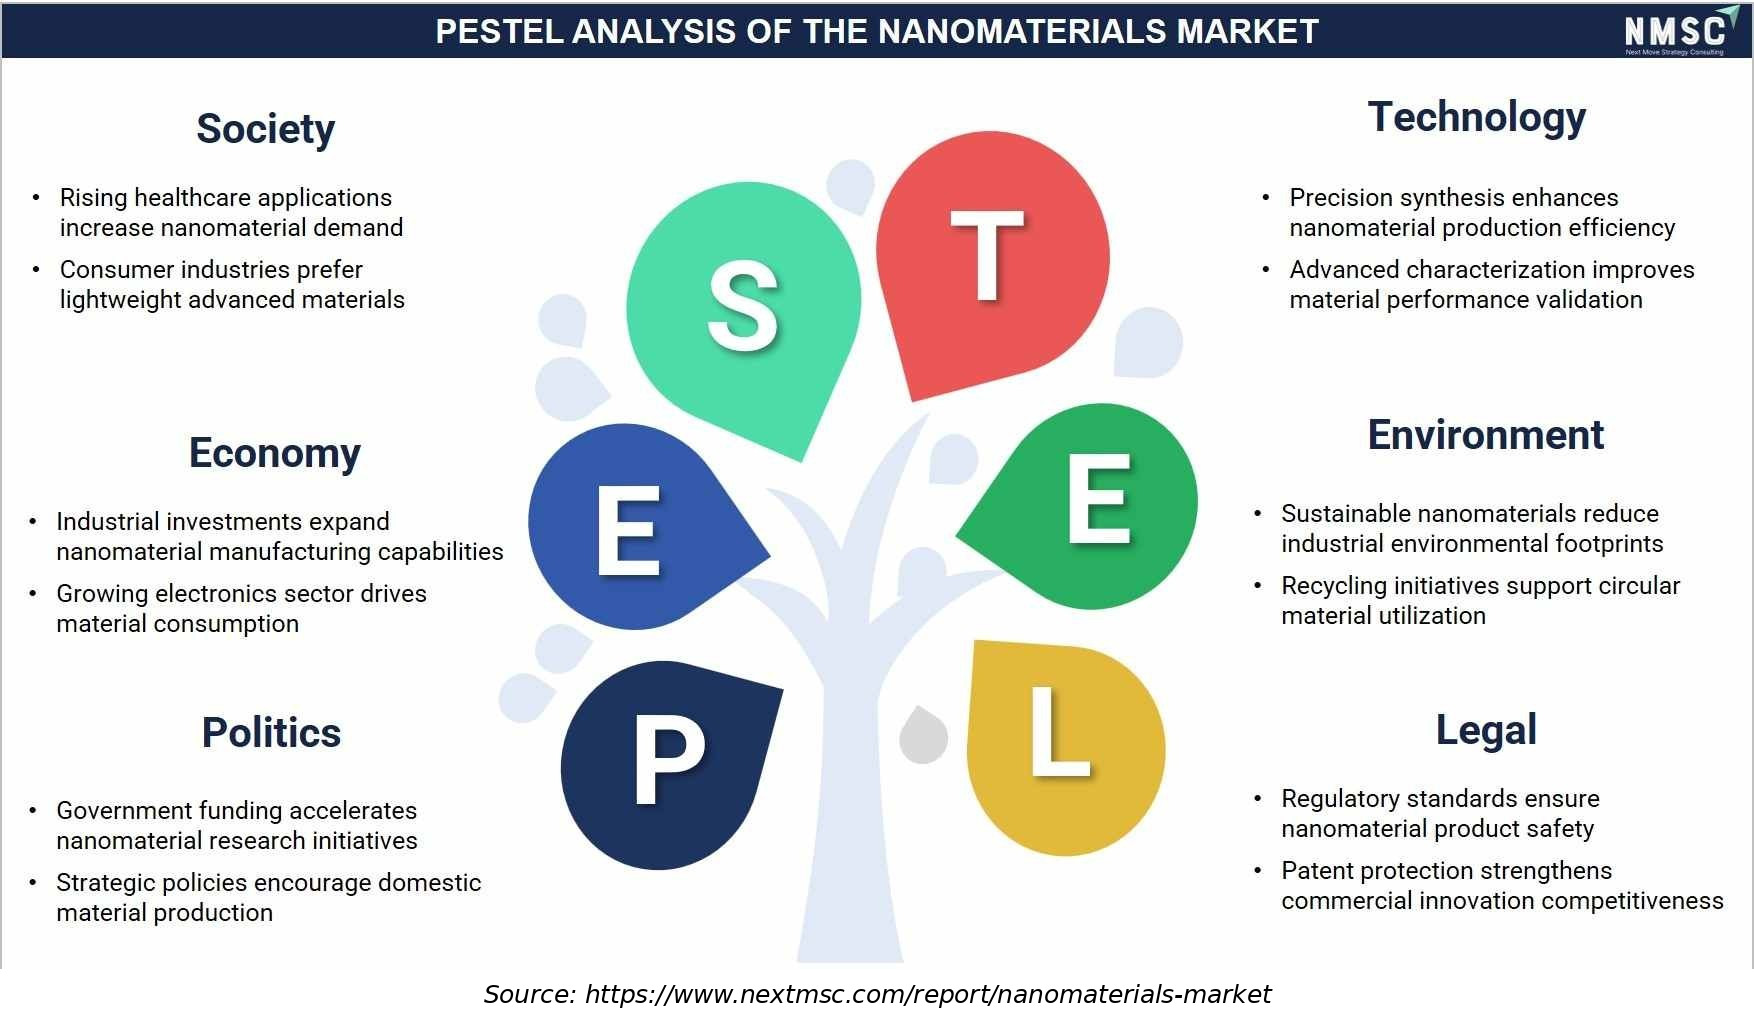
PESTEL Analysis of the Nanomaterials Market

PESTEL Analysis of the Nanomaterials Market
The above PESTEL analysis maps the key macro-environmental factors, such as political, economic, social, technological, environmental, and legal, shaping the nanomaterials industry. From our analysis, we observed that political stability and government funding support research and innovation, while economic factors influence investment and commercialization costs. Social acceptance and technological advancements drive innovation, whereas environmental regulations promote sustainable nanomaterial applications. Legal frameworks, including safety standards and compliance requirements, ensure responsible development and consumer protection, reflecting a comprehensive PESTEL landscape across the nanomaterials market.

Growth Opportunities

Our analysis shows that three forward-looking opportunities stand out for stakeholders positioning within the nanomaterials market over the 2026-2035 forecast period.

How Can Battery-Grade Carbon Nanotube Producers Unlock Value in Electric Vehicles?

Battery-grade single-walled carbon nanotube production presents a whitespace opportunity for vendors serving electric vehicle battery manufacturers seeking improved electrode conductivity at lower additive loading. Suppliers that scale consistent, high-purity production capacity stand to capture long-term supply contracts as battery manufacturers qualify conductive additive suppliers for multi-year production programs.

Where Do Nanocellulose Packaging Materials Create New Demand?

Nanocellulose-based barrier and reinforcement materials represent an underpenetrated opportunity for vendors offering biodegradable alternatives to petroleum-derived packaging films. Manufacturers expanding nanocellulose production capacity for sustainable packaging applications, alongside vendors serving energy storage material supply chains, can capture share from conventional plastic film producers as brand owners face mounting sustainability procurement requirements.

How Can Quantum Dot Producers Benefit from Cadmium-Free Display Demand?

Cadmium-free quantum dot producers stand to benefit from expanding premium display and lighting manufacturer demand for heavy-metal-restricted formulations. Early movers that validate indium phosphide and other cadmium-free quantum dot chemistries at commercial scale can differentiate with display manufacturers pursuing regulatory-compliant, high-color-accuracy product lines across premium television and monitor segments.

Regional Outlook

2025 (USD Billion)
2035 (USD Billion)
Asia-Pacific
North Americ
Europe
Middle East
Latin Americ
Region 2025 (USD Billion) 2035 (USD Billion) CAGR (%)
Asia-Pacific $10.0 USD Billion $40.0 USD Billion 9.0%
North America $17.1 USD Billion $51.1 USD Billion 27.0%
Europe $24.2 USD Billion $62.2 USD Billion 25.0%
Middle East & Africa $31.3 USD Billion $73.3 USD Billion 23.0%
Latin America $38.4 USD Billion $84.4 USD Billion 12.0%

Regional data is locked

Unlock complete regional numbers for this market.

Unlock Full Data

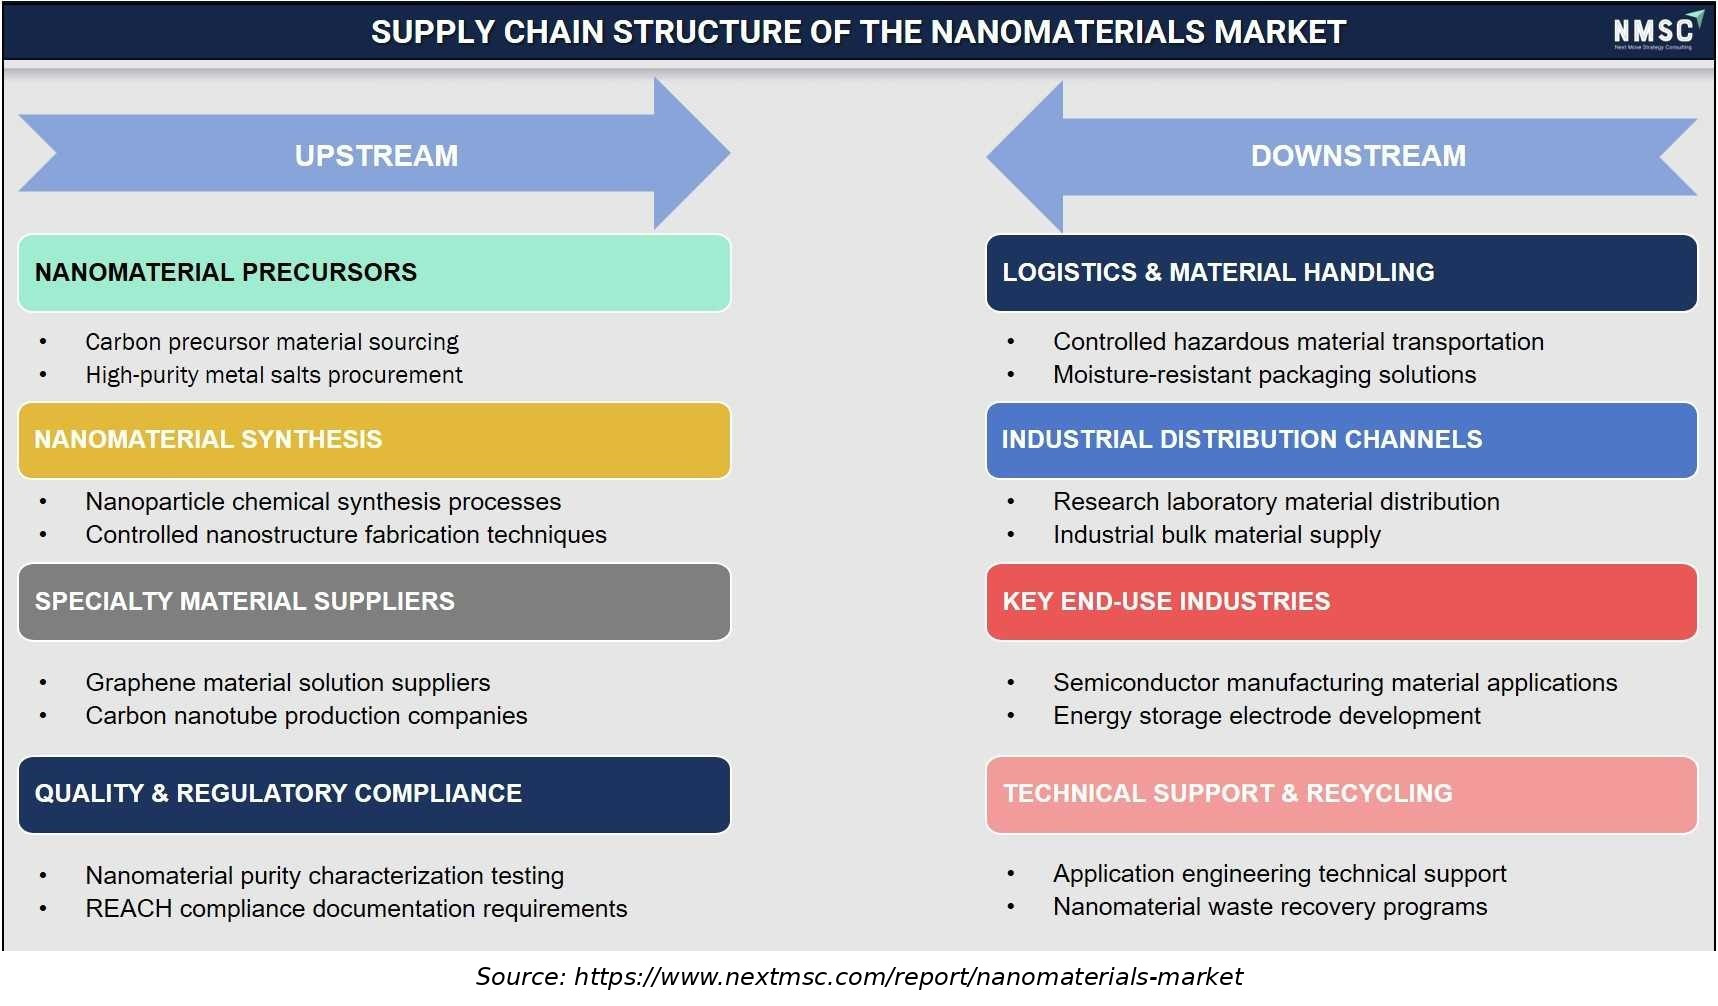
Supply Chain Structure of the Nanomaterials Industry

Supply Chain Structure of the Nanomaterials Industry
The above supply chain analysis maps the key operational stages, such as upstream and downstream, shaping the nanomaterials industry. From our analysis, we observed that upstream activities include carbon precursor sourcing, high-purity metal salts, nanoparticle chemical synthesis, controlled nanostructure fabrication, graphene solution suppliers, carbon nanotube producers, and REACH compliance, while downstream activities encompass hazardous material transportation, moisture-resistant packaging, research laboratory distribution, industrial bulk supply, semiconductor manufacturing, energy storage applications, and technical support, reflecting a well-integrated supply chain across the market.

Competitive Landscape

We observed that the nanomaterials industry features a moderately fragmented competitive landscape, with diversified chemical majors competing alongside specialized nanomaterial producers focused on carbon-based and quantum dot material categories across the industry.

Dimension Description
Market Structure Moderately fragmented; the top companies profiled in this report collectively account for a significant share of global nanomaterials market revenue, while diversified chemical majors dominate inorganic and polymer nanomaterial supply and specialized producers lead carbon-based and quantum dot categories.
Innovation Focus Single-walled carbon nanotube capacity expansion, graphene commercialization, and cadmium-free quantum dot formulation dominate current innovation pipelines across leading vendors.
M&A Activity Selective capacity expansion and strategic partnership activity, as diversified chemical groups invest in specialty nanomaterial production capacity to serve expanding battery and electronics end markets.

How Do Companies Compete in the Nanomaterials Market?

Companies compete primarily on production purity, particle-size consistency, and manufacturing scale across the industry. Diversified chemical majors such as BASF SE and Evonik Industries AG leverage established production infrastructure to serve broad industrial customer bases, while specialized producers such as OCSiAl Group and First Graphene Ltd. compete on carbon-based nanomaterial purity and battery-grade qualification credentials.

Which Competitive Archetypes Dominate the Nanomaterials Industry?

Two archetypes dominate the market: diversified chemical majors offering broad nanomaterial portfolios integrated within larger specialty chemical businesses, and specialized carbon-based and quantum dot producers focused on single-category manufacturing excellence. Arkema S.A. and Wacker Chemie AG exemplify the diversified chemical archetype, while OCSiAl Group and Nanoco Group plc exemplify the specialized archetype serving battery and display manufacturers directly.

How Are Companies Differentiating Through Innovation in Nanomaterials?

Innovation and differentiation strategy increasingly center on production-scale purity and application-specific qualification. OCSiAl Group's battery-grade single-walled carbon nanotube capacity expansion and First Graphene Ltd.'s PureGRAPH industrial partnership program both target validated, commercial-scale supply reliability. Our analysis shows that vendors unable to demonstrate consistent, characterized nanomaterial quality risk exclusion from battery and semiconductor procurement shortlists in North America and Asia-Pacific.

What M&A and Expansion Activity Is Shaping the Nanomaterials Industry?

Capacity expansion and strategic partnership activity continue to shape competitive positioning within the industry. OCSiAl Group's continued investment in Luxembourg and Serbian production facilities illustrates how specialty carbon nanomaterial producers scale to meet battery manufacturer demand, while diversified chemical majors including LG Chem, Ltd. and Resonac Holdings Corporation continue expanding nanomaterial production capacity to serve growing electronics and energy storage end markets.

Key Market Players

Our assessment indicates that the following 20 companies are actively shaping product innovation, capacity expansion, and go-to-market strategy within the global nanomaterials market.

OCSiAl Group Arkema S.A. Cabot Corporation Evonik Industries AG Wacker Chemie AG LG Chem, Ltd. NanoXplore Inc. Resonac Holdings Corporation First Graphene Ltd. Nanocyl SA Haydale plc Nanoco Group plc Zeon Corporation Advanced Nano Products Co., Ltd. Thomas Swan & Co. Ltd. Raymor Industries Inc. BNNT, LLC BASF SE DuPont de Nemours, Inc. Solésence, Inc.

Latest Developments

We found that recent developments within the nanomaterials industry are concentrated on carbon-based nanomaterial capacity expansion and quantum dot commercialization, reflecting the industry's broader shift toward battery- and electronics-grade material supply.

Date Event
November 2025 OCSiAl launched development of a graphene nanotube production center in Differdange, Luxembourg, supported by a USD 300 million investment, a 3.63-hectare site, and plans to create more than 300 jobs.

Expert Insights

Landon Mertz

CEO | Cerion Nanomaterials

"“Nanomaterials are a general-purpose technology, a technology that can be implemented across the entire economy throughout a wide range of industries.”"

Analyst Interpretation

The statement highlights the broad applicability of nanomaterials across diverse industries and their potential to serve as an enabling technology for multiple high-value applications. Nanomaterials are increasingly being explored in sectors such as electronics, healthcare, ceramics, energy, coatings, and advanced manufacturing because their unique nanoscale properties can enhance material performance. The cross-industry demand supports expanding commercialization opportunities while increasing the need for scalable, application-specific nanomaterial production.

Investment Opportunities

What Capital Inflows Are Targeting the Nanomaterials Industry?

Capital inflows into the nanomaterials market are increasingly directed toward battery-grade carbon nanotube and graphene production capacity. We observed that OCSiAl Group continues to invest in expanding its European single-walled carbon nanotube manufacturing footprint to meet rising electric vehicle battery demand. Investors favor producers demonstrating validated commercial-scale purity and consistent supply reliability, viewing successful battery-manufacturer qualification as a proxy for long-term contract retention.

How Is Infrastructure Investment Supporting Nanomaterials Deployment?

Infrastructure investment is expanding production capacity for carbon-based and inorganic nanomaterials across Asia-Pacific and North America to serve rising lithium-ion battery electrode demand. Our findings suggest that manufacturers are investing in bottom-up synthesis production lines to improve yield consistency, supporting the purity and particle-size specifications increasingly required by semiconductor and battery electrode manufacturers.

What ESG Considerations Are Shaping Nanomaterials Investment Decisions?

Environmental, social, and governance considerations are central to investment decisions across the industry, with nanomaterial worker-safety protocols and environmental release monitoring as key governance criteria. The U.S. Environmental Protection Agency's Toxic Substances Control Act nanomaterial reporting requirements continue to inform vendor disclosure practices. We found that investors increasingly favor producers with transparent occupational-safety data and validated environmental-release monitoring, treating both as governance indicators alongside standard labor and manufacturing compliance.

Key Benefits for Stakeholders

How Does This Report Benefit Enterprise and Industry Leaders?

Enterprise and industry leaders gain access to validated segmentation, competitive benchmarking, and regional demand forecasts that support sourcing and product-portfolio decisions across the nanomaterials industry. Our analysis shows that detailed offering, technology, and end-use breakdowns help procurement teams align vendor selection with purity and characterization requirements while identifying underserved application segments for portfolio expansion.

How Does This Report Benefit Investors and Financial Analysts?

Investors and financial analysts benefit from consistent, single-point market size and CAGR estimates that support valuation and capital-allocation decisions across the nanomaterials market supply chain. We observed that the report's regional and segment-level growth differentials help identify which producers and distributors are best positioned to capture above-market growth in Asia-Pacific and carbon-based material categories through 2035.

How Does This Report Benefit Technology Vendors and Product Teams?

Technology vendors and product teams gain insight into emerging production requirements, including bottom-up synthesis scale-up, battery-grade purity specifications, and cadmium-free quantum dot formulation, that are reshaping the industry. Our findings suggest that this analysis helps R&D teams prioritize development roadmaps around consistent characterization and commercial-scale qualification increasingly required by battery and electronics manufacturer procurement processes.

Key Market Segments Evaluated

By Offering

  • Carbon-based nanomaterials 
    • Carbon nanotubes
    • Graphene and other 2D materials
    • Fullerenes
    • Carbon nanofibers
    • Other carbon-based nanomaterials
  • Inorganic nanomaterials 
    • Metal nanoparticles
    • Metal oxide nanoparticles
    • Quantum dots
    • Silica and silicate nanomaterials
    • Other inorganic nanomaterials
  • Polymer and bio-based nanomaterials 
    • Polymer nanoparticles
    • Lipid nanoparticles
    • Nanocellulose
    • Dendrimers
    • Other polymer and bio-based nanomaterials
  • Hybrid and multi-phase nanomaterials
  • Other nanomaterials

By Technology

  • Top-down synthesis 
    • Lithography
    • Other top-down synthesis
  • Bottom-up synthesis 
    • Self-assembly
    • Sol-gel processing
    • Electrospinning
    • Chemical vapor deposition
    • Other bottom-up synthesis

By Product Form

  • Dry powder
  • Dispersion and suspension
  • Masterbatch and concentrate
  • Other product forms

By End Use Industry

  • Electronics and semiconductors
  • Healthcare and life sciences
  • Energy and storage
  • Automotive and mobility
  • Aerospace and defense
  • Chemicals and materials
  • Food and packaging
  • Environment and water
  • Research and academia
  • Other end use industries

By Buyer Type

  • OEM
  • Industrial end user
  • Research institution
  • Government
  • Healthcare provider
  • Other buyer types

By Sales Channel

  • Direct sales
  • Distributor
  • E-commerce
  • Project-based sales
  • Other sales channels

By Region

  • North America 
    • U.S.
    • Canada
    • Mexico
  • Europe 
    • UK
    • Germany
    • France
    • Italy
    • Spain
    • Sweden
    • Denmark
    • Finland
    • Netherlands
    • Rest of Europe
  • Asia-Pacific 
    • China
    • India
    • Japan
    • South Korea
    • Taiwan
    • Indonesia
    • Vietnam
    • Australia
    • Philippines
    • Malaysia
    • Rest of APAC
  • Middle East & Africa 
    • Saudi Arabia
    • UAE
    • Egypt
    • Israel
    • Turkey
    • Nigeria
    • South Africa
    • Rest of MEA
  • Latin America 
    • Brazil
    • Argentina
    • Chile
    • Colombia
    • Rest of LATAM

Conclusion & Recommendations

The long-term outlook for the market remains strongly positive, with global revenue projected to expand from USD 19.85 billion in 2025 to USD 59.48 billion by 2035 at a 11.6% CAGR. We observed that sustained battery electrode demand, semiconductor miniaturization, and graphene commercialization will continue underpinning growth across offering and end-use categories through the forecast period.

What Strategic Positioning Should Nanomaterials Vendors Pursue?

Vendors should prioritize battery-grade purity and characterization consistency while pursuing bottom-up synthesis capacity expansion to secure long-term battery and electronics manufacturer contracts. Our assessment indicates that vendors investing early in carbon-based nanomaterial production and cadmium-free quantum dot formulation will be best positioned to capture premium pricing within the nanomaterials market.

How Attractive Is the Nanomaterials Industry for New Investment?

The nanomaterials industry presents an attractive investment case, supported by a USD 37.33 billion absolute dollar opportunity between 2026 and 2035 and above-average growth in Asia-Pacific and energy and storage categories. We found that investment attractiveness is highest for vendors combining validated production-scale purity with diversified application portfolios, positioning them to serve both cost-sensitive industrial and premium electronics and battery segments simultaneously.

What Market Shifts and Key Risks Should Stakeholders Monitor?

Stakeholders should monitor nanomaterial toxicity and environmental health regulatory uncertainty, high production costs for high-purity synthesis, and standardization gaps across characterization protocols as key risks to the nanomaterials market. Our analysis shows that vendors unable to demonstrate regulatory-compliant safety data risk losing contracts to competitors with certified environmental and occupational-safety credentials, particularly within Europe's increasingly regulated REACH compliance environment.

What Are the Key Growth Pathways for the Nanomaterials Industry?

Key growth pathways include expanding battery-grade carbon-based nanomaterial capacity, scaling graphene and quantum dot commercialization, and deepening penetration into energy storage and sustainable packaging channels. NMSC's analysis indicates that vendors pursuing these pathways while maintaining cost competitiveness in established inorganic nanomaterial categories will be best positioned to capture the nanomaterials industry projected growth through 2035.

Delivered Customizations

We have successfully delivered the following deep-dive customizations:

Client Request Customization Delivered Value Adds
Historical Market & Sales Analysis
  • Historical revenue and shipment-volume analysis of nanomaterials by offering, product form, and end use industry.
  • Identifies fast-growing nanomaterial categories and sets investment and capacity priorities.
Import–Export Trade Assessment
  • Country-wise import and export analysis of nanomaterial categories and product forms using customs trade data.
  • Reveals sourcing dependencies, trade flow shifts, and export-led market entry opportunities.
Company-Level Product Share Analysis
  • Producer-level share analysis across nanomaterial types and product forms based on disclosed portfolios and segment reporting.
  • Shows competitor portfolio strengths and white-space opportunities for product positioning.
End-Use Adoption and Specification Mapping
  • Mapping of nanomaterial adoption by end use industry and application, covering technology route, product form, and performance function.
  • Prioritizes high-potential industries and target applications for commercial focus.
Buyer Type and Sales Channel Analysis
  • Demand breakdown by buyer type (OEMs, formulators, research institutions) and sales channel (direct, distributors, online), with channel structure by region.
  • Guides go-to-market design, distributor partnerships, and customer targeting.
Regulatory and Safety Compliance Impact Assessment
  • Review of nanomaterial regulations (REACH, TSCA, and Asia-Pacific frameworks) and their effect on product forms, technologies, and end use industries.
  • Anticipates compliance costs and market access barriers to support regional entry and product strategy.

FAQs

About the Author

Mayurima Roy

Mayurima Roy

Mayurima Roy is Research Analyst at Next Move Strategy Consulting, where she has spent 4 years working across the firm's full industry coverage rather than a single fixed vertical. Her work centers on structured research, ongoing trend tracking, competitive assessment, and insight-led content development, translating complex market data into clear, decision-ready narratives that support informed client decision-making across diverse global industries, market sectors, and world regions every day.

About the Reviewer

Supradip Baul

Supradip Baul

Supradip Baul is an accomplished business consultant and strategist with over a decade of rich experience in market intelligence, strategy, technology, and business transformation. His work has included rigorous qualitative and quantitative analysis across multiple industries, helping clients shape investment decisions and long-term roadmaps. Earlier in his career, he was associated with Gartner, where he contributed to industry-leading reports and market share analyses. He has worked with leading global companies and holds an MBA with a dual specialization in Marketing and Finance.

Download Free Sample

Gaurav Jaiswal

GAURAV JAISWAL

Founder & CEO

Yano Charge Private Limited

The EV Charging market research report provided by the NextMSC was exceptionally detailed and insightful. It offered a comprehensive analysis that proved to be a game-changer for our strategic planning. Truly a testament to the NextMSC’s expertise and thoroughness in EV market landscape & analysis.

Henri Knyphausen

HENRI KNYPHAUSEN

Partner at Singulier [Ex-BCG]

Singulier

I recently engaged NEXTMSC.com for a commercial due diligence project within the intralogistics sector, and I am pleased to provide a reference based on my experience. In utilizing NEXTMSC.com's services, I found their report to offer valuable insights into market dynamics and key industry players. The initial report provided a solid foundation for our analysis. However, as we were investigating a smaller target in the market, and I had specific customization requests requiring additional research. These requests included detailed information on product portfolios of various players and sub-market sizes, both inclusive and exclusive of certain product categories. NEXTMSC.com demonstrated commendable responsiveness and agility in accommodating these customization requests. Within a timeframe of 1-2 weeks, they delivered a revised report that met our specific needs. Furthermore, they were receptive to my follow-up inquiries, ensuring clarity and understanding of the data provided. The final deliverable significantly contributed to our due diligence efforts. One of NEXTMSC.com's notable strengths lies in their qualitative research capabilities. However, for future engagements, I would recommend the inclusion of a quantified market model in Excel format. Such a model would offer the ability to conduct in-depth analyses and explore various market segments, including country-specific data and subcomponent breakdowns. Based on my positive experience, I would not hesitate to work with NEXTMSC.com again. Their responsiveness, willingness to accommodate customization requests, and commitment to delivering actionable insights make them a reliable partner for commercial research projects.

Amos Chang

AMOS CHANG

Strategy Consultant

Kardex Group

I have bought the intralogistics market reports from NMSC two times so far. Joseph and his team are always very helpful and flexible in responding to any customization requirements on the report. Their expertise in market reports really helps us steer the day-to-day business. I will definitely recommend and come back myself whenever there is a need.

Semih Kavaklioglu

SEMIH KAVAKLIOGLU

Co-Founder & Sales Manager

Decortie

I work a lot in the marketing industry and I know that research is an essential part of any campaign. I have used Market research reports for my own products and I found them to be very informative and well-researched. The team here produces insightful reports for a good price

Rishabh Jogani

RISHABH JOGANI

Strategy Analyst

Accenture Japan

We are incredibly impressed with the market report on the real estate market in India provided by Next Move Strategy Consulting. The report was thorough, insightful, and well-structured, offering deep analysis and actionable recommendations. It not only captured the current trends and dynamics but also provided a forward-looking perspective that has been invaluable for our strategic planning. Their team demonstrated exceptional professionalism, attention to detail, and a profound understanding of the industry. The data-driven insights and clarity of presentation exceeded our expectations, making complex market trends easy to understand. We highly recommend Next Move Strategy Consulting to anyone looking for reliable and comprehensive market research services. Their expertise has given us the confidence to navigate the complexities of the Indian real estate market with clarity and foresight.

Custom Market Research Services

We will customize the research for you if the listed report does not fully match your requirements.

Get 30% Free Customization

Select License

This website uses cookies to ensure you get the best experience on our website. Learn more

✖