Nanotechnology Tools Instrument Market

The nanotechnology tools instrument market size was USD 8.73 Bn in 2025, and is projected to reach USD 21.26 Bn by 2035 at a 9.31% CAGR from 2026 to 2035.

Download Free Sample PDF
Base Year (2025)
$8.73 Billion
Forecast (2035)
$21.26 Billion
CAGR (2026-2035)
9.3%
Top Region
North America

What does the Nanotechnology Tools Instrument Market Encompass?

The Nanotechnology Tools Instrument Market encompasses microscopy and imaging systems, characterization instruments, lithography and patterning tools, manipulation and assembly equipment, and process control and deposition systems used to image, measure, and manufacture materials at the nanoscale. We observed that the scope spans semiconductor manufacturing equipment applications alongside advanced materials research, life sciences, and quantum computing use cases, evolving from standalone research-grade instruments into cleanroom-integrated, in-line production metrology systems.
Regulatory frameworks such as the U.S. Export Administration Regulations governing advanced semiconductor equipment and the International Organization for Standardization's nanotechnology characterization standards shape export compliance and measurement protocol requirements across covered territories. Our assessment indicates that technology adoption is shifting toward AI-assisted image analysis and automated defect classification, with manufacturers increasingly bundling software and licensing capability into core instrument sales to support high-throughput semiconductor fabrication workflows.

Market Drivers & Dynamics

Interactive Dataset
Rising advanced node semiconductor fabrication investment driver +2.8% Asia-Pacific, North America 2026-2035
Growing quantum computing and advanced materials research funding driver +2.1% North America, Europe 2026-2035
Expansion of semiconductor foundry capacity in Asia-Pacific driver +2.4% Asia-Pacific 2026-2033
Rising life sciences nanocharacterization research demand driver +1.6% North America, Europe 2026-2032
Growth of AI-assisted metrology and defect classification adoption driver +1.3% Global 2026-2032
High capital costs limiting instrument access for smaller laboratories restraint -1.7% Global 2026-2030
Export control restrictions on advanced semiconductor equipment restraint -1.4% Asia-Pacific, Middle East & Africa 2026-2031
Shortage of specialized technicians for advanced instrument operation restraint -1.1% Global 2026-2030
Long instrument replacement cycles limiting unit volume growth restraint -0.8% Global 2026-2030
Source: Next Move Strategy Consulting

Growth Drivers

What Is the Primary Growth Driver for the Nanotechnology Tools Instrument Market?

The primary growth driver is rising advanced node semiconductor fabrication investment, as chipmakers scale production of increasingly miniaturized transistor architectures requiring nanoscale characterization and lithography tools. We observed that the U.S. Department of Commerce has documented sustained growth in domestic semiconductor manufacturing capital investment since 2024, reinforcing demand for advanced metrology and patterning instrumentation across new fabrication facilities.

How Is Quantum Computing Research Funding Driving Market Growth?

Quantum computing research funding is driving market growth as national laboratories and universities scale qubit fabrication and characterization programs requiring specialized cryogenic and ultra-high-vacuum instrumentation. Based on research conducted by NMSC, we found that expanding quantum computing research infrastructure investment is increasing demand for nanomanipulation and characterization tools capable of operating at cryogenic temperatures for superconducting and spin-based qubit development.

Growth Inhibitors

What Is Restraining the Nanotechnology Tools Instrument Market?

High capital costs limiting instrument access for smaller laboratories restrain broader adoption, as advanced electron microscopy and lithography systems require substantial upfront investment beyond the budget capacity of many academic and mid-sized industrial buyers. The U.S. National Science Foundation has documented persistent equipment funding gaps for smaller research institutions since 2024, complicating access to state-of-the-art instrumentation. Our analysis shows that shared-use facility models and contract testing organizations are gradually easing this constraint for capital-constrained buyers.

Segmentation Analysis

2025 (USD Billion)
2035 (USD Billion)
Microscopy and Imaging 2025: $2.97 Billion | 2035: $6.59 Billion
Microscopy a
Characterization Instruments 2025: $1.92 Billion | 2035: $4.25 Billion
Characteriza
Lithography and Patterning 2025: $1.57 Billion | 2035: $4.68 Billion
Lithography
Manipulation and Assembly 2025: $1.05 Billion | 2035: $2.13 Billion
Manipulation
Process Control and Deposition Systems 2025: $1.22 Billion | 2035: $3.61 Billion
Process Cont
Microscopy and Imaging $2.97 Billion $6.59 Billion 8.2%
Characterization Instruments $1.92 Billion $4.25 Billion 8.1%
Lithography and Patterning $1.57 Billion $4.68 Billion 11.8%
Manipulation and Assembly $1.05 Billion $2.13 Billion 7.2%
Process Control and Deposition Systems $1.22 Billion $3.61 Billion 11.6%

Which Offering Dominates the Nanotechnology Tools Instrument Market?

Microscopy and Imaging dominates the offering axis, contributing USD 2.97 billion in 2025 and projected to reach USD 6.59 billion by 2035. We found that electron and atomic force microscopy systems remain the largest revenue contributor given their foundational role across nanomaterials characterization workflows, while Lithography and Patterning grows fastest as advanced node semiconductor fabrication scales patterning tool demand.

2025 (USD Billion)
2035 (USD Billion)
Benchtop and
Standalone H
Cleanroom-In
In-Line Proc
Other System
Segment Item 2025 (USD Billion) 2035 (USD Billion) CAGR
Benchtop and Desktop Systems $10.0 USD Billion $40.0 USD Billion 22.0%
Standalone High-Resolution Suites $17.1 USD Billion $51.1 USD Billion 24.0%
Cleanroom-Integrated Modules $24.2 USD Billion $62.2 USD Billion 22.0%
In-Line Process Measurement Tools $31.3 USD Billion $73.3 USD Billion 16.0%
Other System Architectures $38.4 USD Billion $84.4 USD Billion 27.0%

Segment-wise data is locked

Unlock complete segment-wise numbers for By System Architecture.

Unlock Full Data
2025 (USD Billion)
2035 (USD Billion)
Capital Equi
Maintenance
Consumables
Software and
Other Revenu
Segment Item 2025 (USD Billion) 2035 (USD Billion) CAGR
Capital Equipment Sales $10.0 USD Billion $40.0 USD Billion 15.0%
Maintenance and Service Contracts $17.1 USD Billion $51.1 USD Billion 21.0%
Consumables and Probes $24.2 USD Billion $62.2 USD Billion 23.0%
Software and Licensing $31.3 USD Billion $73.3 USD Billion 21.0%
Other Revenue Streams $38.4 USD Billion $84.4 USD Billion 22.0%

Segment-wise data is locked

Unlock complete segment-wise numbers for By Revenue Stream.

Unlock Full Data
2025 (USD Billion)
2035 (USD Billion)
Semiconducto
Academic Res
Industrial M
Government R
Contract Tes
Segment Item 2025 (USD Billion) 2035 (USD Billion) CAGR
Semiconductor Foundry $10.0 USD Billion $40.0 USD Billion 22.0%
Academic Research Laboratory $17.1 USD Billion $51.1 USD Billion 12.0%
Industrial Metrology Laboratory $24.2 USD Billion $62.2 USD Billion 14.0%
Government Research Facility $31.3 USD Billion $73.3 USD Billion 12.0%
Contract Testing Organization $38.4 USD Billion $84.4 USD Billion 15.0%

Segment-wise data is locked

Unlock complete segment-wise numbers for By Buyer Type.

Unlock Full Data

Which Buyer Type Is Growing Fastest?

Semiconductor Foundry remains the largest buyer type at USD 2.62 billion in 2025, while Contract Testing Organization is the fastest-growing at a 12.1% CAGR through 2035. Our findings suggest that expanding outsourced failure analysis and materials testing demand is driving smaller and mid-sized manufacturers toward contract testing providers rather than internal instrument ownership, accelerating this buyer category's growth relative to direct foundry procurement.

2025 (USD Billion)
2035 (USD Billion)
Semiconducto
Advanced Mat
Life Science
Quantum Comp
Forensics an
Segment Item 2025 (USD Billion) 2035 (USD Billion) CAGR
Semiconductor Fabrication $10.0 USD Billion $40.0 USD Billion 20.0%
Advanced Materials Research $17.1 USD Billion $51.1 USD Billion 18.0%
Life Sciences and Biotech $24.2 USD Billion $62.2 USD Billion 12.0%
Quantum Computing $31.3 USD Billion $73.3 USD Billion 22.0%
Forensics and Failure Analysis $38.4 USD Billion $84.4 USD Billion 25.0%

Segment-wise data is locked

Unlock complete segment-wise numbers for By End Use Industry.

Unlock Full Data

Why Does Quantum Computing Grow Fastest Among End-Use Industries?

Semiconductor Fabrication leads with USD 3.14 billion in 2025, reflecting the broad instrument base required across wafer processing and inspection workflows. We observed that Quantum Computing is the fastest-growing end-use industry at a 14.8% CAGR through 2035, as expanding quantum computing research infrastructure investment drives specialized demand for cryogenic characterization and nanomanipulation tools supporting qubit fabrication programs.

2025 (USD Billion)
2035 (USD Billion)
Direct Sales
Distributor
E-Commerce
Project-Base
Other Distri
Segment Item 2025 (USD Billion) 2035 (USD Billion) CAGR
Direct Sales $10.0 USD Billion $40.0 USD Billion 25.0%
Distributor $17.1 USD Billion $51.1 USD Billion 19.0%
E-Commerce $24.2 USD Billion $62.2 USD Billion 25.0%
Project-Based Sales $31.3 USD Billion $73.3 USD Billion 19.0%
Other Distribution Channels $38.4 USD Billion $84.4 USD Billion 20.0%

Segment-wise data is locked

Unlock complete segment-wise numbers for By Distribution Channel.

Unlock Full Data
2025 (USD Billion)
2035 (USD Billion)
North Americ
Canada
Mexico
Europe: UK
Germany
Segment Item 2025 (USD Billion) 2035 (USD Billion) CAGR
North America: U.S. $10.0 USD Billion $40.0 USD Billion 23.0%
Canada $17.1 USD Billion $51.1 USD Billion 21.0%
Mexico $24.2 USD Billion $62.2 USD Billion 27.0%
Europe: UK $31.3 USD Billion $73.3 USD Billion 17.0%
Germany $38.4 USD Billion $84.4 USD Billion 26.0%

Segment-wise data is locked

Unlock complete segment-wise numbers for By Region.

Unlock Full Data

Ecosystem Analysis of the Nanotechnology Tools Instrument Market

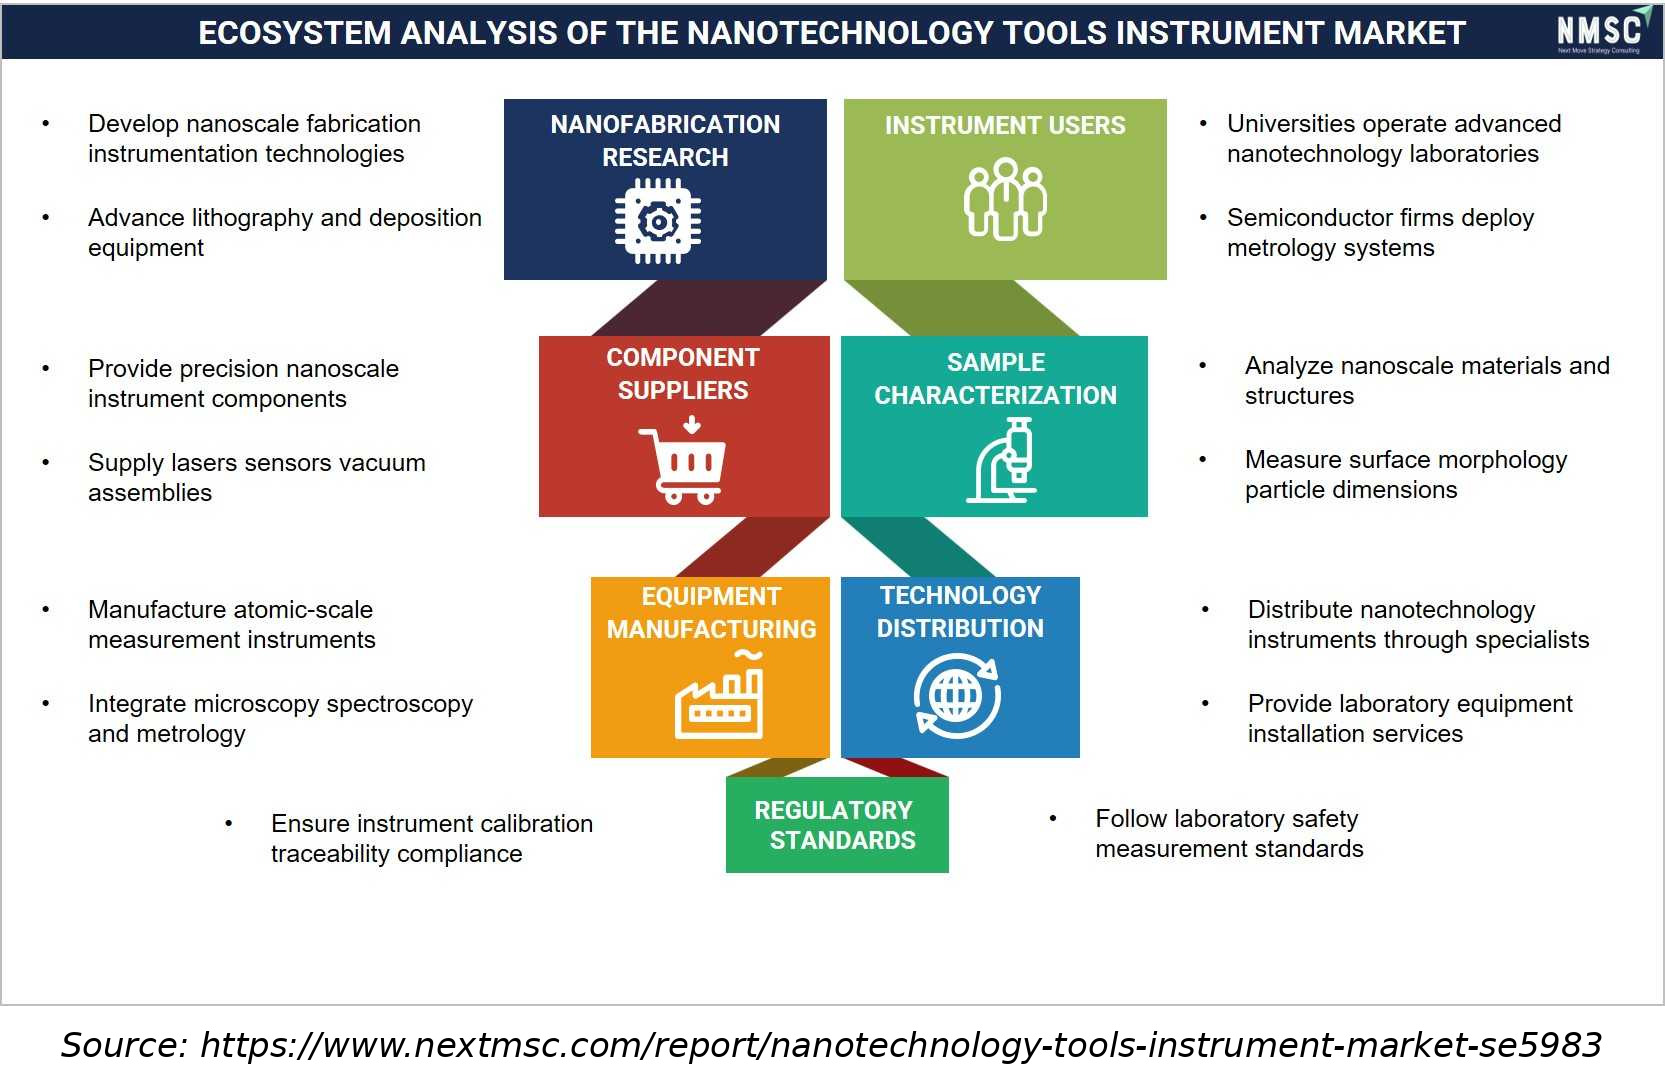
The above ecosystem analysis maps the key operational components, such as nanofabrication research, component suppliers, equipment manufacturing, sample characterization, technology distribution, regulatory standards, and instrument users, shaping the nanotechnology tools instrument market. From our analysis, we observed that nanofabrication research and component suppliers drive technological advancements, while equipment manufacturing and sample characterization ensure precision and reliability. Technology distribution and regulatory standards maintain market accessibility and compliance, whereas instrument users represent key end-users across the market ecosystem.

Growth Opportunities

Beyond the core drivers outlined above, three forward-looking whitespace opportunities stand out for stakeholders positioning within the nanotechnology tools instrument market over the 2026-2035 forecast period.

Can Cryogenic Instrumentation Unlock Value for Quantum Computing Researchers?

Cryogenic characterization and manipulation instrumentation presents a whitespace opportunity for suppliers serving expanding qubit fabrication research programs. Manufacturers that advance ultra-low-temperature nanomanipulation systems stand to capture recurring capital equipment and service contract revenue as national laboratories and universities scale quantum computing infrastructure investment.

Where Does Contract Testing Organization Growth Create New Demand?

Contract testing organizations represent an underpenetrated opportunity as smaller semiconductor and materials manufacturers increasingly outsource failure analysis and characterization work rather than owning capital-intensive instruments. Suppliers such as Park Systems Corp. and Horiba, Ltd. that expand service-oriented analytical instrumentation partnerships can capture recurring demand from testing providers scaling capacity.

How Can In-Line Metrology Benefit Advanced Node Fabrication Facilities?

In-line process measurement tools create a mechanism to serve advanced node fabrication facilities requiring real-time yield optimization feedback. This category benefits semiconductor foundries by reducing defect propagation across production runs, directly supporting the fastest-growing Lithography and Patterning and Process Control and Deposition Systems segments through 2035.

Regional Outlook

2025 (USD Billion)
2035 (USD Billion)
North Americ
Europe
Asia-Pacific
Middle East
Latin Americ
Region 2025 (USD Billion) 2035 (USD Billion) CAGR (%)
North America $10.0 USD Billion $40.0 USD Billion 9.0%
Europe $17.1 USD Billion $51.1 USD Billion 27.0%
Asia-Pacific $24.2 USD Billion $62.2 USD Billion 25.0%
Middle East & Africa $31.3 USD Billion $73.3 USD Billion 23.0%
Latin America $38.4 USD Billion $84.4 USD Billion 12.0%

Regional data is locked

Unlock complete regional numbers for this market.

Unlock Full Data

Supply Chain Structure of the Nanotechnology Tools Instrument Market

Supply Chain Structure of the Nanotechnology Tools Instrument Market
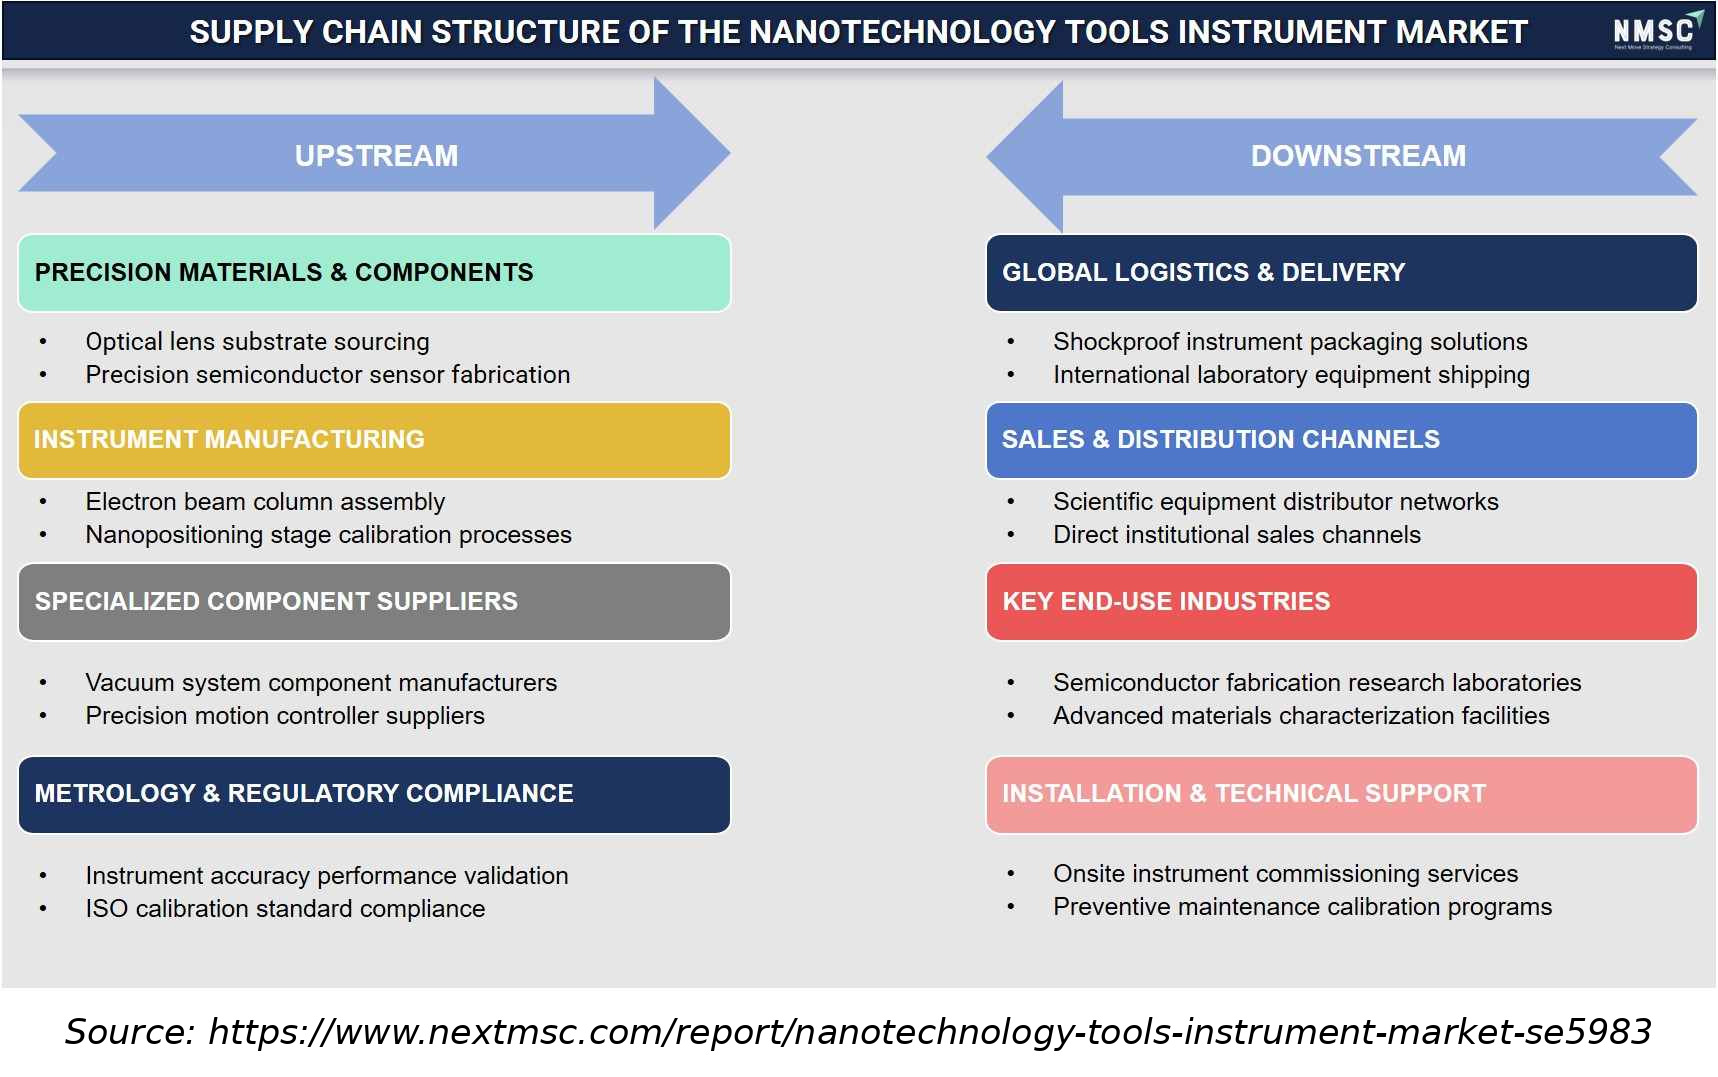
The above supply chain analysis maps the key operational stages, such as upstream and downstream, shaping the nanotechnology tools instrument market. From our analysis, we observed that upstream activities include optical lens substrate sourcing, semiconductor sensor fabrication, electron beam column assembly, nanopositioning stage calibration, vacuum system components, precision motion controllers, and ISO compliance, while downstream activities encompass shockproof packaging, international shipping, scientific equipment distributors, direct institutional sales, semiconductor research labs, materials characterization facilities, and onsite commissioning services, reflecting a well-integrated supply chain across the market.

Competitive Landscape

We observed that the nanotechnology tools instrument market features a moderately consolidated competitive landscape, with diversified scientific instrumentation conglomerates competing alongside specialized nanotechnology-focused manufacturers on portfolio breadth, precision engineering capability, and pricing flexibility.

Dimension Description
Market Structure Moderately consolidated; the top companies profiled in this report collectively account for a significant share of global nanotechnology tools instrument revenue, while numerous specialized manufacturers serve niche microscopy, lithography, and manipulation demand
Innovation Focus AI-assisted image analysis, cryogenic manipulation systems, and in-line process control instrumentation dominate current innovation pipelines across leading manufacturers
M&A Activity Selective consolidation through specialized instrument acquisitions, exemplified by Bruker Corporation's continued integration of acquired characterization and metrology technology platforms

How Do Companies Compete in the Nanotechnology Tools Instrument Market?

Companies compete primarily on portfolio breadth, precision engineering capability, and pricing flexibility across buyer type tiers. We observed that global players such as Thermo Fisher Scientific Inc. and Carl Zeiss AG leverage broad microscopy and characterization portfolios to serve multinational semiconductor and research customers, while specialized manufacturers such as Park Systems Corp. compete on application-specific engineering depth for niche atomic force microscopy demand.

Which Competitive Archetypes Dominate the Nanotechnology Tools Instrument Market?

Two archetypes dominate the market: diversified scientific instrumentation conglomerates offering integrated microscopy, characterization, and lithography capability, and specialized nanotechnology-focused manufacturers concentrated on specific instrument categories. Hitachi High-Tech Corporation exemplifies the diversified archetype through broad semiconductor metrology and microscopy coverage, while Nanosurf AG exemplifies the specialized archetype serving focused atomic force microscopy demand.

How Are Companies Differentiating Through Innovation?

Innovation and differentiation strategy increasingly center on AI-assisted defect classification and wafer probe -integrated in-line metrology capability. Oxford Instruments plc and JEOL Ltd. have both expanded automated image analysis capability to secure semiconductor foundry contracts, while manufacturers unable to demonstrate AI-enabled throughput improvements risk losing specification share to more digitally advanced competitors.

What M&A and Expansion Activity Is Shaping the Market?

Mergers, acquisitions, and geographic expansion continue to consolidate nanotechnology tools instrument capabilities within the industry. Bruker Corporation's ongoing integration of acquired characterization platforms broadened its metrology product coverage, while SUSS MicroTec SE's continued investment in lithography and patterning capacity illustrates how diversified manufacturers pursue geographic expansion and technology breadth across semiconductor and research application segments.

Key Market Players

We observed that the following twenty companies represent the core competitive set shaping instrument innovation, geographic expansion, and pricing strategy across the Nanotechnology Tools Instrument Market.

Thermo Fisher Scientific Inc. Carl Zeiss AG Hitachi High-Tech Corporation JEOL Ltd. Bruker Corporation Oxford Instruments plc Park Systems Corp. Horiba, Ltd. EV Group E. Thallner GmbH Raith GmbH Nanosurf AG Imina Technologies SA Kleindiek Nanotechnik GmbH SUSS MicroTec SE Malvern Panalytical Ltd. NT-MDT Spectrum Instruments Mad City Labs Inc. Anton Paar GmbH NanoMagnetics Instruments Zyvex Labs

Latest Developments

We found that recent product and capacity announcements underscore accelerating manufacturer investment in AI-assisted metrology and advanced lithography capability.

Date Event
May 2026 JEOL India opened the JEOL SOLINITY CENTRE in Bangalore, India, strengthening demonstration, application support, customer training, and technical capabilities for electron microscopy and analytical instruments serving India’s nanotechnology, semiconductor, materials science, and industrial markets.
April 2026 Park Systems opened its new global headquarters in Gwacheon, South Korea, featuring a 27,000-square-meter campus and industrial cleanroom supporting up to 35 industrial-grade nanometrology systems for semiconductor fabrication and advanced packaging applications.
July 2025 Hitachi High-Tech India opened a new office in Bangalore, India, establishing a dedicated center for electron microscopes and analytical instruments while expanding technical services and support for semiconductor, battery manufacturing, and biopharmaceutical customers.

Investment Opportunities

Where Are Capital Inflows Concentrated in the Market?

Capital inflows are concentrated in AI-assisted metrology software developers and cryogenic quantum instrumentation specialists, with strategic acquirers targeting firms offering proprietary image analysis and low-temperature manipulation technology. Our analysis shows that established manufacturers are increasingly funding internal automated defect classification development, reflecting confidence in the segment's 9.31% CAGR through 2035 as a durable, fundamentals-supported growth trajectory.

How Significant Is Infrastructure Investment Supporting Market Growth?

Infrastructure investment supporting semiconductor fabrication and nanotechnology research capacity underpins the market's Lithography and Patterning and Asia-Pacific growth, projected at an 11.8% and 12.3% CAGR, respectively, through 2035. We observed that fabrication capacity expansion across North America and Asia-Pacific is directly enabling faster adoption of next-generation nanotechnology characterization and patterning tools.

What ESG Considerations Are Shaping Investment Decisions?

Environmental, Social, and Governance considerations increasingly factor into manufacturer and investor decisions, as energy-efficient instrument designs directly reduce power consumption for continuous-operation cleanroom and laboratory environments. Our assessment indicates that investors favor manufacturers demonstrating measurable efficiency gains from optimized vacuum and cooling system design, aligning nanotechnology tools instrument adoption with broader corporate sustainability reporting requirements across semiconductor and research customers.

Key Benefits for Stakeholders

How Does This Report Benefit Enterprise and Industry Leaders?

Enterprise and industry leaders gain access to segment-level revenue forecasts across offering, buyer type, and end-use industry axes, enabling informed prioritization of internal instrument investment and vendor selection decisions. Our analysis shows that benchmarking against the 9.31% market CAGR through 2035 helps research and fabrication leaders justify budget allocation relative to peers, while regional data supports procurement and deployment decisions.

How Does This Report Benefit Investors and Financial Analysts?

Investors and financial analysts benefit from reconciled market sizing across twenty companies and thirty-eight countries, supporting due diligence on competitive positioning and growth trajectory. NMSC's analysis indicates that the report's segment-level CAGR data, including the 14.8% growth rate for Quantum Computing end-use demand, helps identify underappreciated growth pockets ahead of broader market recognition.

How Does This Report Benefit Technology Vendors and Product Teams?

Technology vendors and product teams gain visibility into which offerings and buyer types are growing fastest, directly informing product roadmap and go-to-market prioritization. Our findings suggest that the report's competitive landscape and latest developments sections help product teams benchmark feature investment against direct competitors, reducing the risk of misallocating R&D spend toward slower-growing segments.

Key Market Segments Evaluated

By Offering

  • Microscopy and Imaging 
    • AFM
    • SEM
    • TEM
    • STM
    • X-Ray Nanotomography
    • Other Microscopy and Imaging
  • Characterization Instruments 
    • DLS and Zeta Potential
    • NTA
    • BET Surface Area
    • Single Particle ICP-MS
    • Other Characterization Instruments
  • Lithography and Patterning 
    • E-Beam Lithography
    • Nanoimprint Lithography
    • FIB Systems
    • Dip-Pen Lithography
    • Other Lithography and Patterning
  • Manipulation and Assembly 
    • Nanomanipulators
    • Nanoindenters
    • Probe Stations
    • Other Manipulation and Assembly Tools
  • Process Control and Deposition Systems 
    • Nanoscale Deposition Equipment
    • Nanoscale Etching Equipment
    • Inspection Systems
    • Wafer Metrology Systems
    • Other Process Control and Deposition Systems

By System Architecture

  • Benchtop and Desktop Systems
  • Standalone High-Resolution Suites
  • Cleanroom-Integrated Modules
  • In-Line Process Measurement Tools
  • Other System Architectures

By Revenue Stream

  • Capital Equipment Sales
  • Maintenance and Service Contracts
  • Consumables and Probes
  • Software and Licensing
  • Other Revenue Streams

By Buyer Type

  • Semiconductor Foundry
  • Academic Research Laboratory
  • Industrial Metrology Laboratory
  • Government Research Facility
  • Contract Testing Organization
  • Other Buyer Types

By End Use Industry

  • Semiconductor Fabrication
  • Advanced Materials Research
  • Life Sciences and Biotech
  • Quantum Computing
  • Forensics and Failure Analysis
  • Other End Use Industries

By Distribution Channel

  • Direct Sales
  • Distributor
  • E-Commerce
  • Project-Based Sales
  • Other Distribution Channels

By Region

  • North America 
    • U.S.
    • Canada
    • Mexico
  • Europe 
    • UK
    • Germany
    • France
    • Italy
    • Spain
    • Sweden
    • Denmark
    • Finland
    • Netherlands
    • Rest of Europe
  • Asia-Pacific 
    • China
    • India
    • Japan
    • South Korea
    • Taiwan
    • Indonesia
    • Vietnam
    • Australia
    • Philippines
    • Malaysia
    • Rest of APAC
  • Middle East & Africa 
    • Saudi Arabia
    • UAE
    • Egypt
    • Israel
    • Turkey
    • Nigeria
    • South Africa
    • Rest of MEA
  • Latin America 
    • Brazil
    • Argentina
    • Chile
    • Colombia
    • Rest of LATAM

Conclusion & Recommendations

The long-term outlook for the market remains highly positive, with global revenue projected to expand from USD 9.54 billion in 2026 to USD 21.26 billion by 2035 at a 9.31% CAGR. We observed that sustained semiconductor fabrication investment, quantum computing research expansion, and AI-integrated metrology adoption will continue underpinning growth across buyer segments through the forecast period.

What Strategic Positioning Should Manufacturers Pursue?

Manufacturers should prioritize AI-assisted analysis capability while pursuing cryogenic and quantum-specific instrumentation development to secure long-term research and foundry contracts. Our assessment indicates that smaller manufacturers without advanced software integration capability face competitive disadvantage, making strategic alliances with semiconductor foundries an increasingly important positioning lever heading into the later years of the forecast period.

How Attractive Is the Nanotechnology Tools Instrument Market for New Investment?

The nanotechnology tools instrument industry presents a highly attractive investment case, supported by a USD 11.72 billion absolute dollar opportunity between 2026 and 2035 and above-average growth in Asia-Pacific and Lithography and Patterning categories. We found that investment attractiveness is highest for manufacturers combining precision engineering credentials with scaled semiconductor foundry relationships.

What Market Shifts and Key Risks Should Stakeholders Monitor?

Stakeholders should monitor high capital costs limiting smaller laboratory access, export control restrictions on advanced semiconductor equipment, and specialized technician shortages as key factors shaping the nanotechnology tools instrument market. Our analysis shows that manufacturers unable to navigate export compliance requirements risk losing market access in key Asia-Pacific and Middle East & Africa growth regions.

What Are the Key Growth Pathways for the Nanotechnology Tools Instrument Market?

Key growth pathways include expanding Lithography and Patterning and Process Control and Deposition Systems portfolios, scaling quantum-specific cryogenic instrumentation, and deepening penetration into contract testing organization channels. NMSC's analysis indicates that manufacturers pursuing these pathways while maintaining cost competitiveness in standard microscopy categories will be best positioned to capture the market's projected growth through 2035.

FAQs

Market Size & Forecast

Nanotechnology Tools Instrument Market Revenue Forecast

Values in USD Billion

2025 $8.73 Billion
2025
2026 $9.54 Billion
2026
2027 $10.43 Billion
2027
2028 $11.40 Billion
2028
2029 $12.46 Billion
2029
2030 $13.62 Billion
2030
2031 $14.89 Billion
2031
2032 $16.28 Billion
2032
2033 $17.79 Billion
2033
2034 $19.45 Billion
2034
2035 $21.26 Billion
2035

Key Takeaways

By Offering: Microscopy and Imaging held the largest share of approximately 34% (USD 2.97 Billion) in 2025; Lithography and Patterning is the fastest-growing sub-segment at 11.8% CAGR from 2026-2035.

By System Architecture: Standalone High-Resolution Suites held the largest share of approximately 32% (USD 2.79 Billion) in 2025; In-Line Process Measurement Tools is the fastest-growing sub-segment at 11.2% CAGR from 2026-2035.

By Revenue Stream: Capital Equipment Sales held the largest share of approximately 58% (USD 5.06 Billion) in 2025; Software and Licensing is the fastest-growing sub-segment at 14.4% CAGR from 2026-2035.

By Buyer Type: Semiconductor Foundry held the largest share of approximately 30% (USD 2.62 Billion) in 2025; Contract Testing Organization is the fastest-growing sub-segment at 12.1% CAGR from 2026-2035.

By End Use Industry: Semiconductor Fabrication held the largest share of approximately 36% (USD 3.14 Billion) in 2025; Quantum Computing is the fastest-growing sub-segment at 14.8% CAGR from 2026-2035.

By Distribution Channel: Direct Sales held the largest share of approximately 52% (USD 4.54 Billion) in 2025; E-Commerce is the fastest-growing sub-segment at 14.4% CAGR from 2026-2035.

Dominant Region: North America dominated with approximately 36% revenue share (USD 3.14 Billion) in 2025.

Fastest-Growing Region: Asia-Pacific is expected to register the highest CAGR of 12.3% during 2026-2035.

Dominant Country: U.S. led with approximately USD 1.95 Billion in 2025.

Fastest-Growing Country: India is the fastest-growing country at approximately 17.8% CAGR from 2026-2035.

About the Author

Mayurima Roy

Mayurima Roy

Mayurima Roy is Research Analyst at Next Move Strategy Consulting, where she has spent 4 years working across the firm's full industry coverage rather than a single fixed vertical. Her work centers on structured research, ongoing trend tracking, competitive assessment, and insight-led content development, translating complex market data into clear, decision-ready narratives that support informed client decision-making across diverse global industries, market sectors, and world regions every day.

About the Reviewer

Supradip Baul

Supradip Baul

Supradip Baul is an accomplished business consultant and strategist with over a decade of rich experience in market intelligence, strategy, technology, and business transformation. His work has included rigorous qualitative and quantitative analysis across multiple industries, helping clients shape investment decisions and long-term roadmaps. Earlier in his career, he was associated with Gartner, where he contributed to industry-leading reports and market share analyses. He has worked with leading global companies and holds an MBA with a dual specialization in Marketing and Finance.

Download Free Sample

Mohit Agarwal

MOHIT AGARWAL

Chief Manager

DryChem India Pvt. Ltd.

Next Move Strategy Consulting is an amazing team of consultants. We required a market study report for our investors on top priority and the team went above and beyond our expectations to deliver the same with ample supporting data within a short time span enabling us to secure the investments and keep our project timeline maintained. Their professionalism, attention to detail, and timely delivery of actionable recommendations have left a lasting impression on our organization.

Kishu Kanda

KISHU KANDA

Strategy Analyst

Accenture

We purchased the AI Consumer Market Report from this company. Not only did they customize the report to meet our specific requirements, but they also showed great flexibility in accommodating our budget. The report we received fully met our expectations. Additionally, they provided prompt and thorough responses to both our pre-purchase and follow-up questions. We look forward to working with this company again in the future.

Henri Knyphausen

HENRI KNYPHAUSEN

Partner at Singulier [Ex-BCG]

Singulier

I recently engaged NEXTMSC.com for a commercial due diligence project within the intralogistics sector, and I am pleased to provide a reference based on my experience. In utilizing NEXTMSC.com's services, I found their report to offer valuable insights into market dynamics and key industry players. The initial report provided a solid foundation for our analysis. However, as we were investigating a smaller target in the market, and I had specific customization requests requiring additional research. These requests included detailed information on product portfolios of various players and sub-market sizes, both inclusive and exclusive of certain product categories. NEXTMSC.com demonstrated commendable responsiveness and agility in accommodating these customization requests. Within a timeframe of 1-2 weeks, they delivered a revised report that met our specific needs. Furthermore, they were receptive to my follow-up inquiries, ensuring clarity and understanding of the data provided. The final deliverable significantly contributed to our due diligence efforts. One of NEXTMSC.com's notable strengths lies in their qualitative research capabilities. However, for future engagements, I would recommend the inclusion of a quantified market model in Excel format. Such a model would offer the ability to conduct in-depth analyses and explore various market segments, including country-specific data and subcomponent breakdowns. Based on my positive experience, I would not hesitate to work with NEXTMSC.com again. Their responsiveness, willingness to accommodate customization requests, and commitment to delivering actionable insights make them a reliable partner for commercial research projects.

Rishabh Jogani

RISHABH JOGANI

Strategy Analyst

Accenture Japan

We are incredibly impressed with the market report on the real estate market in India provided by Next Move Strategy Consulting. The report was thorough, insightful, and well-structured, offering deep analysis and actionable recommendations. It not only captured the current trends and dynamics but also provided a forward-looking perspective that has been invaluable for our strategic planning. Their team demonstrated exceptional professionalism, attention to detail, and a profound understanding of the industry. The data-driven insights and clarity of presentation exceeded our expectations, making complex market trends easy to understand. We highly recommend Next Move Strategy Consulting to anyone looking for reliable and comprehensive market research services. Their expertise has given us the confidence to navigate the complexities of the Indian real estate market with clarity and foresight.

Semih Kavaklioglu

SEMIH KAVAKLIOGLU

Co-Founder & Sales Manager

Decortie

I work a lot in the marketing industry and I know that research is an essential part of any campaign. I have used Market research reports for my own products and I found them to be very informative and well-researched. The team here produces insightful reports for a good price

Custom Market Research Services

We will customize the research for you if the listed report does not fully match your requirements.

Get 30% Free Customization

Select License

This website uses cookies to ensure you get the best experience on our website. Learn more

✖