Organic Fertilizers Market Global Industry Analysis and Forecast (2026-2035)

Organic Fertilizers Market size was USD 14.5 billion in 2026, projected to reach USD 35.9 billion by 2035, growing at a CAGR of 10.60% from 2026 to 2035. Key drivers include expanding government bio-input subsidy programs, rising demand for chemical-free food, and growing adoption of biofertilizers and plant-based fertilizers, with Asia-Pacific leading the market.
Download Free Sample PDF
Base Year (2025)
$13.20 Billion
Forecast (2035)
$35.90 Billion
CAGR (2026-2035)
10.6%
Top Region
Asia-Pacific

What Is the Organic Fertilizers Market Size?
The global organic fertilizers market size was valued at USD 13.2 billion in 2025 and is estimated at USD 14.5 billion in 2026, forecast to reach USD 35.9 billion by 2035, expanding at a 10.6% CAGR between 2026 and 2035. Asia-Pacific leads with approximately 44% share, while biofertilizers dominate all other product types with approximately 30% share.

We observed that growth is broad-based across every segmentation axis, with plant-based biostimulant adoption and smallholder farmer uptake driving the dominant structural shifts through 2035.

Organic Fertilizers Market Global Industry Analysis and Forecast (2026-2035) Revenue Forecast
Values in USD Billion

2025 $13.20 Billion
2025
2026 $14.50 Billion
2026
2027 $16.04 Billion
2027
2028 $17.74 Billion
2028
2029 $19.62 Billion
2029
2030 $21.70 Billion
2030
2031 $24.00 Billion
2031
2032 $26.54 Billion
2032
2033 $29.35 Billion
2033
2034 $32.46 Billion
2034
2035 $35.90 Billion
2035

Key Takeaways

By Product Type: Biofertilizers held the largest share of approximately 30% (USD 3.96 billion) in 2025; Plant-Based Fertilizers is the fastest-growing sub-segment at 15.0% CAGR from 2026–2035.

By Crop Type: Cereals and Grains held the largest share of approximately 34% (USD 4.49 billion) in 2025; Fruits and Vegetables is the fastest-growing sub-segment at 13.1% CAGR from 2026–2035.

By Form: Dry/Granular held the largest share of approximately 58% (USD 7.66 billion) in 2025; Liquid is the fastest-growing sub-segment at 13.2% CAGR from 2026–2035.

By Application Method: Soil Application held the largest share of approximately 62% (USD 8.18 billion) in 2025; Fertigation is the fastest-growing sub-segment at 14.7% CAGR from 2026–2035.

By Distribution Channel: Retail and Agri-Input Dealers held the largest share of approximately 48% (USD 6.34 billion) in 2025; Online and E-Commerce is the fastest-growing sub-segment at 17.4% CAGR from 2026–2035.

By End User: Commercial Farms held the largest share of approximately 52% (USD 6.86 billion) in 2025; Smallholder and Individual Farmers is the fastest-growing sub-segment at 12.9% CAGR from 2026–2035.

Dominant Region: Asia-Pacific dominated with approximately 44% revenue share (USD 5.81 billion) in 2025.

Fastest-Growing Region: Latin America is expected to register the highest CAGR of 14.3% during 2026–2035.

Dominant Country: China led with approximately USD 1.86 billion in 2025.

Fastest-Growing Country: Brazil is the fastest-growing country at approximately 15.2% CAGR from 2026–2035.

What Does the Organic Fertilizers Market Encompass?
The organic fertilizers market encompasses biofertilizers, manure-based, compost-based, plant-based, animal by-product, and humic and fulvic acid-based crop nutrition products derived from biological, animal, or plant sources rather than synthetic chemical processes. Our assessment indicates that the scope spans dry, liquid, and powder forms applied through soil, foliar, fertigation, and seed treatment methods, distributed through retail dealers, direct sales, cooperatives, and e-commerce channels to commercial farms, smallholder farmers, and home garden users across cereal, fruit and vegetable, and commercial crop applications worldwide.
Regulatory frameworks such as national organic certification standards and government bio-input subsidy programs increasingly shape product registration and farmer adoption incentives across the industry. We observed that technology adoption is shifting from traditional manure and compost applications toward standardized, microbially validated biofertilizer formulations offering more predictable nutrient delivery. Next Move Strategy Consulting's analysis indicates that this structural shift, combined with expanding plant-based biostimulant adoption, is redefining product development priorities across the organic fertilizers market.

SUPPLY CHAIN STRUCTURE OF THE ORGANIC FERTILIZERS MARKET

SUPPLY CHAIN STRUCTURE OF THE ORGANIC FERTILIZERS MARKET
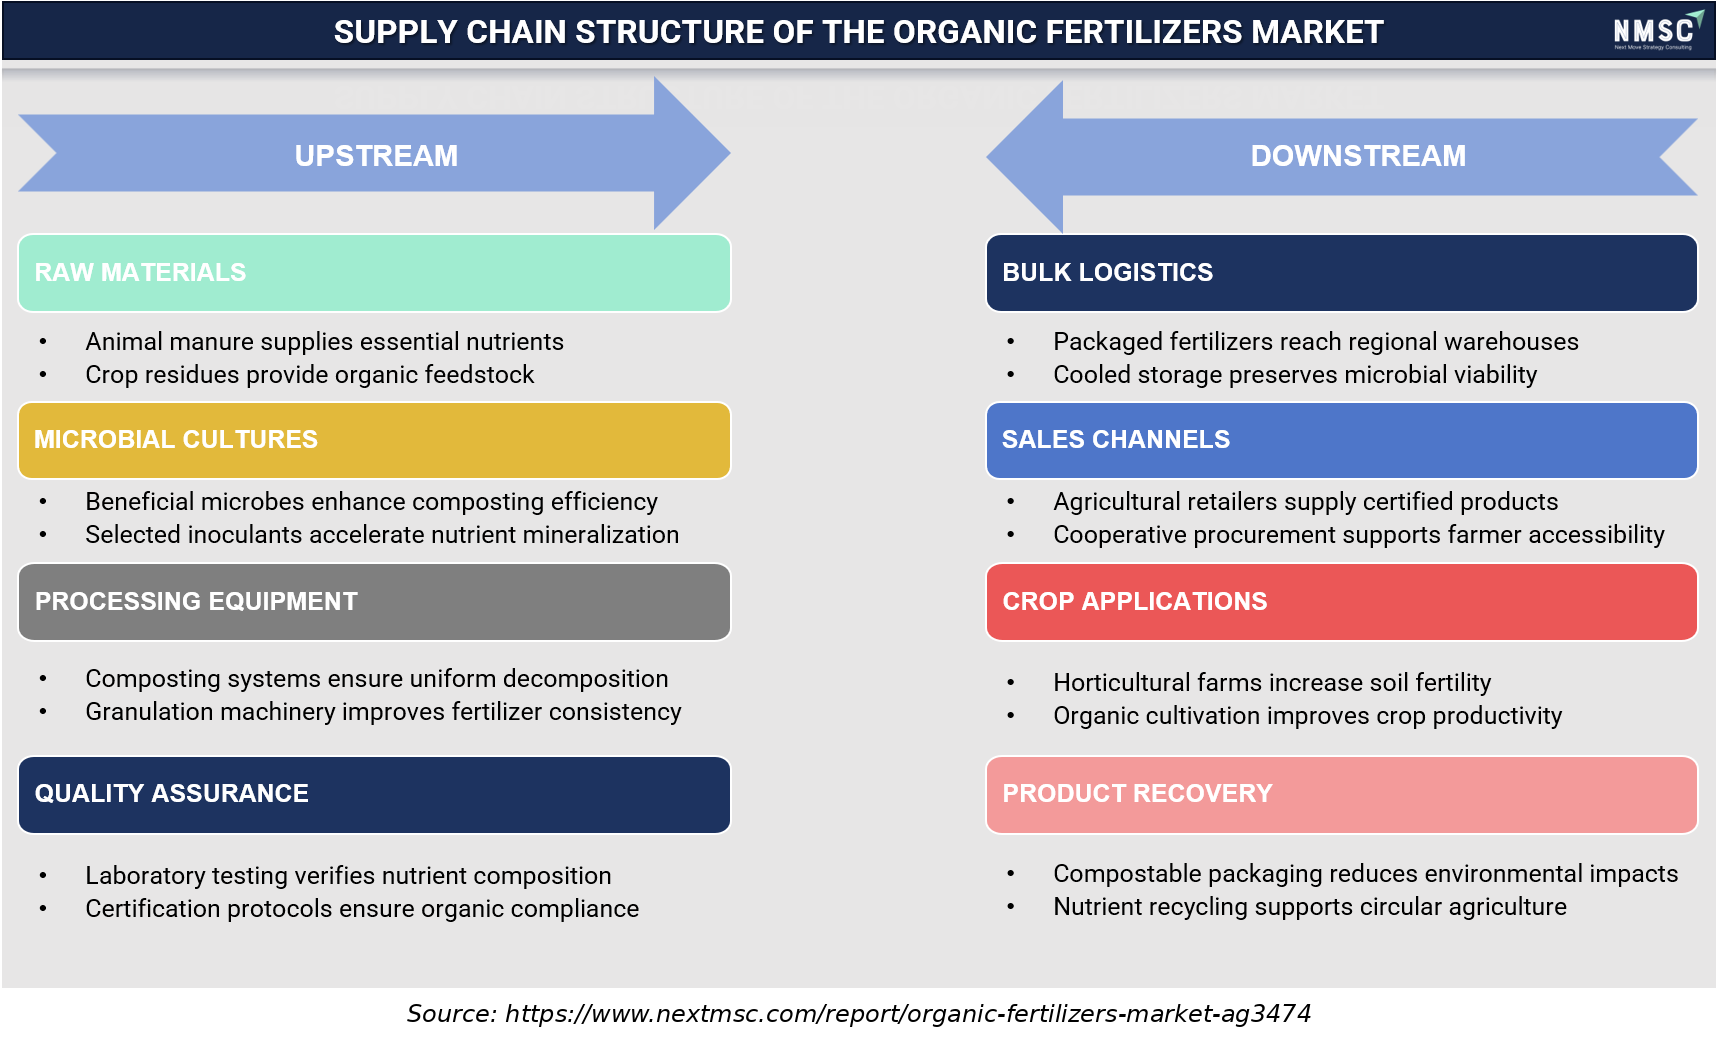
The supply chain of the organic fertilizers market begins with raw materials such as animal manure and crop residues, supported by microbial cultures that improve nutrient mineralization. These inputs are processed using composting and granulation equipment, followed by rigorous quality testing and organic certification. Finished products are distributed through warehouses and retail channels before being applied across agricultural sectors, while compostable packaging and nutrient recycling promote sustainability and a circular agricultural economy.

Market Drivers & Dynamics

Interactive Dataset
Expanding government bio-input subsidy and certification programs driver +2.4% Asia-Pacific, Latin America 2026-2035
Rising consumer demand for chemical-free and residue-free food driver +2.0% Global 2026-2035
Growing certified organic farmland expansion across emerging markets driver +1.6% Latin America, Asia-Pacific 2026-2035
Volatile synthetic fertilizer prices driving substitution toward organic inputs driver +1.2% Global 2026-2035
Expanding plant-based biostimulant and seaweed extract adoption driver +0.8% Europe, North America 2026-2032
Rising soil degradation awareness among commercial farm operators driver +0.6% Global 2026-2032
Slower visible results compared with synthetic fertilizer alternatives restraint -1.0% Global 2026-2035
Limited smallholder farmer awareness of proper application methods restraint -0.7% Asia-Pacific, Latin America 2026-2032
Fragmented regional supply chains constraining consistent product quality restraint -0.5% Latin America, Middle East & Africa 2028-2035
Source: Next Move Strategy Consulting

Growth Drivers

What Is the Primary Growth Driver of the Organic Fertilizers Market?

Expanding government bio-input subsidy and certification programs is the primary driver of the market. Brazil's Ministry of Agriculture continues to administer the ABC+ Plan for low-carbon agriculture, expanding financial incentives for organic and biological crop nutrition adoption among domestic producers. We observed that this policy-driven demand, reinforced by widening price gaps between organic and imported synthetic nutrients, continues to anchor baseline consumption of organic fertilizers across developed and emerging agricultural markets alike.

How Is Consumer Demand for Chemical-Free Food Driving Organic Fertilizers Market Growth?

Rising consumer demand for chemical-free and residue-free food is accelerating farmer adoption of organic and biological crop nutrition inputs. Next Move Strategy Consulting's analysis indicates that this demand-driven shift, combined with expanding certified organic farmland across Latin America and Asia-Pacific, is compressing adoption timelines for biofertilizers and plant-based products among growers pursuing premium export market access and sustainability certification.

Growth Inhibitors

What Is Restraining Organic Fertilizers Market Expansion?

Slower visible results compared with synthetic fertilizer alternatives restrain adoption speed across the industry, particularly among smallholder farmers accustomed to immediate yield response. We found that operators transitioning from synthetic to organic inputs face particular adoption exposure, as extended nutrient release timelines require sustained multi-season commitment compared with the faster, more predictable results associated with conventional chemical fertilizers.

Segmentation Analysis

2025 (USD Billion)
2035 (USD Billion)
Biofertilizers 2025: $3.96 Billion | 2035: $10.48 Billion
Biofertilize
Manure-Based Fertilizers 2025: $3.17 Billion | 2035: $7.73 Billion
Manure-Based
Compost-Based Fertilizers 2025: $2.38 Billion | 2035: $5.99 Billion
Compost-Base
Plant-Based Fertilizers 2025: $1.58 Billion | 2035: $6.12 Billion
Plant-Based
Animal By-Product Fertilizers 2025: $1.19 Billion | 2035: $3.15 Billion
Animal By-Pr
Humic and Fulvic Acid-Based Fertilizers 2025: $0.66 Billion | 2035: $1.85 Billion
Humic and Fu
Other Organic Fertilizers 2025: $0.26 Billion | 2035: $0.59 Billion
Other Organi
Biofertilizers $3.96 Billion $10.48 Billion 10.3%
Manure-Based Fertilizers $3.17 Billion $7.73 Billion 9.3%
Compost-Based Fertilizers $2.38 Billion $5.99 Billion 9.7%
Plant-Based Fertilizers $1.58 Billion $6.12 Billion 15.0%
Animal By-Product Fertilizers $1.19 Billion $3.15 Billion 10.3%
Humic and Fulvic Acid-Based Fertilizers $0.66 Billion $1.85 Billion 11.0%
Other Organic Fertilizers $0.26 Billion $0.59 Billion 8.3%

Which Product Type Dominates the Organic Fertilizers Market?

Biofertilizers led the market with USD 3.96 billion in 2025, supported by strong government subsidy programs promoting nitrogen-fixing and phosphate-solubilizing microbial inoculants across Asia-Pacific agricultural economies. We observed that Plant-Based Fertilizers is the fastest-growing product type, expanding at a 15.0% CAGR from 2026 to 2035, as seaweed-based extracts and biostimulant formulations gain adoption among growers pursuing improved nutrient use efficiency.

2025 (USD Billion)
2035 (USD Billion)
Cereals and
Fruits and V
Commercial C
Oilseeds and
Turf and Orn
Segment Item 2025 (USD Billion) 2035 (USD Billion) CAGR
Cereals and Grains $10.0 USD Billion $40.0 USD Billion 25.0%
Fruits and Vegetables $17.1 USD Billion $51.1 USD Billion 11.0%
Commercial Crops $24.2 USD Billion $62.2 USD Billion 25.0%
Oilseeds and Pulses $31.3 USD Billion $73.3 USD Billion 11.0%
Turf and Ornamental $38.4 USD Billion $84.4 USD Billion 16.0%

Segment-wise data is locked

Unlock complete segment-wise numbers for By Crop Type.

Unlock Full Data

Which Crop Type Leads Organic Fertilizers Market Demand?

Cereals and Grains remained the dominant crop type, valued at USD 4.49 billion in 2025 on the broad global cultivation base of staple grain crops requiring consistent soil fertility management. Our findings suggest that Fruits and Vegetables is the fastest-growing crop type, registering a 13.1% CAGR from 2026 to 2035, as export-oriented growers increasingly adopt organic inputs to meet premium market residue-free certification requirements.

2025 (USD Billion)
2035 (USD Billion)
Category A
Category B
Category C
Category D
Segment Item 2025 (USD Billion) 2035 (USD Billion) CAGR
Category A $10.0 USD Billion $40.0 USD Billion 27.0%
Category B $17.1 USD Billion $51.1 USD Billion 9.0%
Category C $24.2 USD Billion $62.2 USD Billion 19.0%
Category D $31.3 USD Billion $73.3 USD Billion 17.0%

Segment-wise data is locked

Unlock complete segment-wise numbers for By Form.

Unlock Full Data
2025 (USD Billion)
2035 (USD Billion)
Category A
Category B
Category C
Category D
Segment Item 2025 (USD Billion) 2035 (USD Billion) CAGR
Category A $10.0 USD Billion $40.0 USD Billion 14.0%
Category B $17.1 USD Billion $51.1 USD Billion 24.0%
Category C $24.2 USD Billion $62.2 USD Billion 22.0%
Category D $31.3 USD Billion $73.3 USD Billion 12.0%

Segment-wise data is locked

Unlock complete segment-wise numbers for By Application Method.

Unlock Full Data
2025 (USD Billion)
2035 (USD Billion)
Category A
Category B
Category C
Category D
Segment Item 2025 (USD Billion) 2035 (USD Billion) CAGR
Category A $10.0 USD Billion $40.0 USD Billion 24.0%
Category B $17.1 USD Billion $51.1 USD Billion 22.0%
Category C $24.2 USD Billion $62.2 USD Billion 20.0%
Category D $31.3 USD Billion $73.3 USD Billion 22.0%

Segment-wise data is locked

Unlock complete segment-wise numbers for By Distribution Channel.

Unlock Full Data
2025 (USD Billion)
2035 (USD Billion)
Commercial F
Smallholder
Home and Gar
Nurseries an
Segment Item 2025 (USD Billion) 2035 (USD Billion) CAGR
Commercial Farms $10.0 USD Billion $40.0 USD Billion 23.0%
Smallholder and Individual Farmers $17.1 USD Billion $51.1 USD Billion 9.0%
Home and Garden Users $24.2 USD Billion $62.2 USD Billion 19.0%
Nurseries and Landscaping $31.3 USD Billion $73.3 USD Billion 13.0%

Segment-wise data is locked

Unlock complete segment-wise numbers for By End User.

Unlock Full Data

Which End User Is Most Widely Served by Organic Fertilizers?

Commercial Farms remained the dominant end user, reaching USD 6.86 billion in 2025 due to their large-scale procurement volumes and established relationships with agri-input distributors. Based on research conducted by Next Move Strategy Consulting, we found that Smallholder and Individual Farmers is the fastest-growing end user at a 12.9% CAGR from 2026 to 2035, reflecting expanding government subsidy programs improving affordability and access for smaller-scale operators.

Growth Opportunities

Our analysis shows that three forward-looking opportunities stand out for stakeholders positioning within the organic fertilizers market over the 2026-2035 forecast period.

How Can Biogas Digestate Integration Unlock Value for Manure-Based Producers?

Biogas digestate integration presents a whitespace opportunity for manure-based fertilizer producers positioning ahead of expanding biogas plant capacity. Processors that commercialize digestate-based product lines stand to capture cost advantages and improved product consistency as large-scale operators pursue lower input costs compared with conventional raw manure collection and processing.

Where Do Export Crop Traceability Programs Create New Demand?

Export-oriented growers pursuing sustainability certification represent an underpenetrated opportunity for organic fertilizer suppliers offering blockchain-enabled traceability integration. Companies that develop validated input-to-output tracking systems can secure premium contracts with agribusinesses serving certified coffee, soybean, and other export commodities, benefiting from carbon premium payment programs rewarding verified regenerative practices.

How Can Localized Biofertilizer Manufacturing Benefit Regional Producers?

Regional producers pursuing reduced import dependency create an opportunity for suppliers offering localized microbial biofertilizer manufacturing capability. Early movers that establish domestic production facilities can differentiate with government programs favoring local content, benefiting from reduced logistics costs and improved responsiveness to region-specific soil and crop conditions.

REGULATORY FRAMEWORK IMPACTING THE ORGANIC FERTILIZERS MARKET

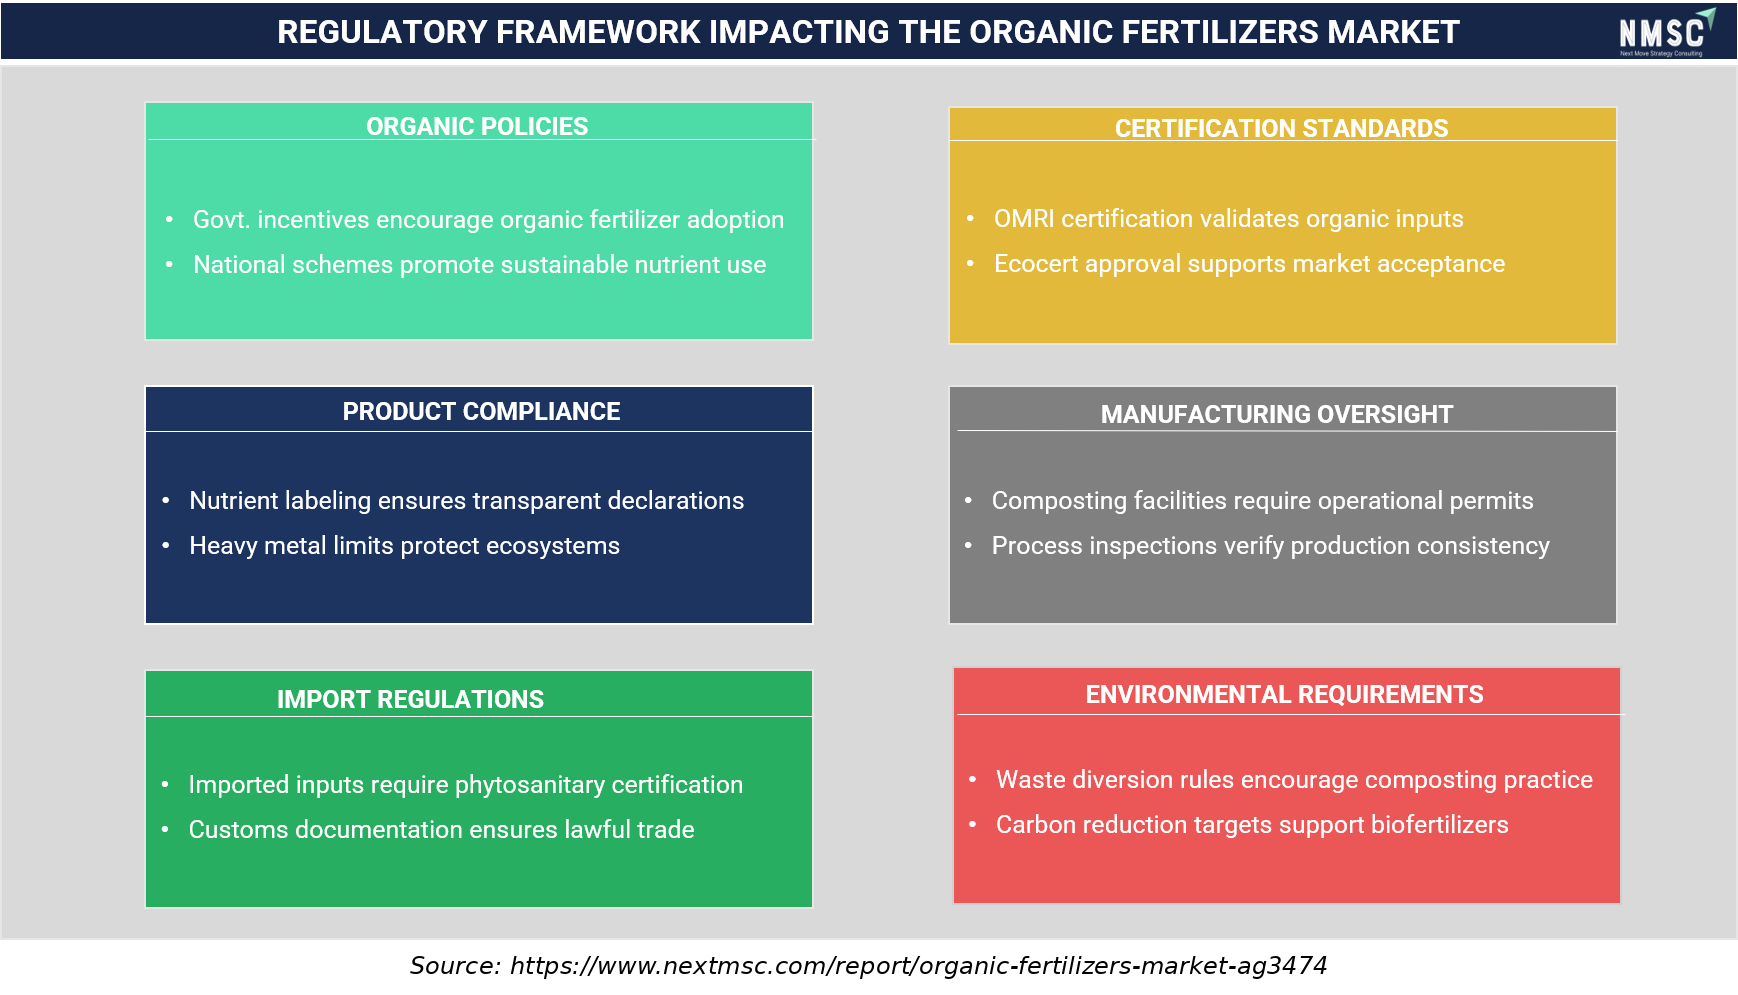
The organic fertilizers market is shaped by regulations that encourage sustainable agriculture, product quality, and environmental protection. Government policies and certification standards such as OMRI and Ecocert promote market credibility, while labeling requirements, heavy metal limits, and manufacturing oversight ensure compliance. Import regulations support safe trade, and environmental measures, including composting and carbon reduction initiatives, further accelerate the adoption of organic fertilizers worldwide.

Regional Outlook

2025 (USD Billion)
2035 (USD Billion)
Asia-Pacific
Europe
North Americ
Latin Americ
Middle East
Region 2025 (USD Billion) 2035 (USD Billion) CAGR (%)
Asia-Pacific $10.0 USD Billion $40.0 USD Billion 9.0%
Europe $17.1 USD Billion $51.1 USD Billion 27.0%
North America $24.2 USD Billion $62.2 USD Billion 25.0%
Latin America $31.3 USD Billion $73.3 USD Billion 23.0%
Middle East & Africa $38.4 USD Billion $84.4 USD Billion 12.0%

Regional data is locked

Unlock complete regional numbers for this market.

Unlock Full Data

Competitive Landscape

We observed that the organic fertilizers market features a highly fragmented competitive landscape, with diversified crop nutrition companies competing alongside specialized biofertilizer and regional manure-based product manufacturers.

Dimension Description
Market Structure Highly fragmented; diversified crop nutrition companies compete alongside specialized biofertilizer developers and regional manure-based and compost product manufacturers, with the top companies together controlling less than a third of total market share.
Innovation Focus Microbial strain development, plant-based biostimulant formulations, and biogas digestate integration dominate current innovation pipelines across leading producers.
M&A Activity Active registration and regional partnership activity exemplified by Rovensa Group's continued expansion of its Vorax biofertilizer across Brazilian export crop segments, reflecting industry-wide movement toward registered, regionally validated biological products.

How Do Companies Compete in the Organic Fertilizers Market?

Companies compete primarily on microbial formulation expertise, regional manufacturing presence, and distribution network reach across the industry. Diversified companies such as Yara International ASA and ICL Group Ltd. leverage extensive agronomic research capability and global distribution to serve commercial farms, while specialized producers such as True Organic Products, Inc. and Sustane Natural Fertilizer, Inc. compete on dedicated organic formulation expertise supplied to targeted crop and regional segments.

Which Competitive Archetypes Dominate the Organic Fertilizers Market?

Two archetypes dominate the market: diversified crop nutrition companies offering organic products alongside broader agricultural input portfolios, and specialized biofertilizer and organic-only producers focused on biological crop nutrition exclusively. Yara International ASA and Coromandel International Limited exemplify the diversified archetype, while Rizobacter Argentina S.A. and Indogulf BioAg LLC exemplify the specialized archetype through dedicated microbial inoculant and biofertilizer expertise.

How Are Companies Differentiating Through Innovation in Organic Fertilizers?

Innovation and differentiation strategy increasingly center on registered, regionally validated biofertilizer products and biogas digestate integration. Rovensa Group's Vorax biofertilizer, which had treated more than 20 million hectares in Brazil since its 2019 launch, illustrates how registered, field-validated products build agribusiness customer confidence. Our analysis shows that producers unable to demonstrate credible regional registration and field validation risk losing large commercial farm contracts to competitors with proven, regulator-approved formulations.

What M&A and Expansion Activity Is Shaping the Organic Fertilizers Market?

Regional registration activity and production capacity expansion continue to shape competitive dynamics within the industry. Rovensa Group's continued expansion of Vorax biofertilizer distribution across Brazilian export crop segments illustrates how European biosolutions companies are deepening Latin American market presence, while domestic Brazilian producers including Adubasul Fertilizantes continue expanding manure-based and digestate product capacity to serve the region's rapidly growing certified organic farmland base.

Key Market Players

Our assessment indicates that the following 20 companies are actively shaping product innovation, regional manufacturing capacity, and distribution strategy within the global organic fertilizers market.

Yara International ASA ICL Group Ltd. Coromandel International Limited Novonesis A/S Koppert B.V. Lallemand Inc. Rizobacter Argentina S.A. Rovensa Group T. Stanes and Company Limited Sigma AgriScience LLC Italpollina S.p.A. Biolchim S.p.A. Acadian Seaplants Limited True Organic Products, Inc. Sustane Natural Fertilizer, Inc. Bio Huma Netics, Inc. Indogulf BioAg LLC Indian Farmers Fertiliser Cooperative Limited (IFFCO) National Fertilizers Limited Adubasul Fertilizantes

Latest Developments

We found that recent product registrations and capacity investments within the organic fertilizers market are concentrated on Latin American biofertilizer and regional manufacturing expansion.

Date Event
April 2025 ICL Growing Solutions announced the acquisition of Lavie Bio, a microbiome-based agricultural solutions company. The acquisition strengthens ICL's biological crop nutrition portfolio by adding microbial technologies, a microbial bank, AI-driven discovery capabilities, and biostimulant development programs for sustainable agriculture.
November 2024 Yara North America launched the YaraAmplix biostimulant portfolio across the U.S. and Canada. The portfolio is designed to improve nutrient uptake, enhance crop resilience, support soil health, and complement fertilizer programs using naturally derived biostimulants. Yara also announced investment in a new biostimulant manufacturing and formulation facility.

Investment Opportunities

What Capital Inflows Are Targeting the Organic Fertilizers Market?

Capital inflows into the organic fertilizers market are increasingly directed toward regional biofertilizer manufacturing capacity and product registration. Government agricultural ministries continue to fund incentive programs, as seen in Brazil's ABC+ Plan supporting low-carbon agriculture adoption. We observed that investors favor producers demonstrating credible regional registration and field validation, viewing hectares treated as a proxy for long-term commercial farm customer retention.

How Is Infrastructure Investment Supporting Organic Fertilizers Deployment?

Infrastructure investment is expanding biogas digestate processing and regional manufacturing capacity across producers to support rising manure-based and biofertilizer demand. Our findings suggest that Brazilian processors are investing in digestate integration facilities to improve product consistency while lowering input costs compared with conventional manure collection, supporting the reliability increasingly demanded by large-scale certified export crop growers.

What ESG Considerations Are Shaping Organic Fertilizers Investment Decisions?

Environmental, social, and governance considerations are central to investment decisions across the industry, with soil health and carbon sequestration as key criteria. Blockchain-enabled traceability programs continue to inform buyer standards around verified regenerative farming practices. We found that investors increasingly favor producers enabling measurable carbon premium payments for growers, treating traceability and soil-regenerative outcomes as governance indicators alongside product registration compliance.

Key Benefits for Stakeholders

How Does This Report Benefit Enterprise and Industry Leaders?

Enterprise and industry leaders gain access to validated segmentation, competitive benchmarking, and regional demand forecasts that support product-portfolio decisions across the organic fertilizers industry. Our analysis shows that detailed product type, crop type, and end user breakdowns help research and distribution teams align formulation specifications with regional regulatory and farmer adoption requirements while identifying underserved end-use segments for portfolio expansion.

How Does This Report Benefit Investors and Financial Analysts?

Investors and financial analysts benefit from consistent, single-point market size and CAGR estimates that support valuation and capital-allocation decisions across the organic fertilizers market supply chain. We observed that the report's regional and segment-level growth differentials help identify which producers and product categories are best positioned to capture above-market growth in Plant-Based Fertilizers and Latin America categories through 2035.

How Does This Report Benefit Technology Vendors and Product Teams?

Technology vendors and product teams gain insight into emerging design requirements, including microbial strain development, biogas digestate integration, and blockchain traceability, that are reshaping the industry. Our findings suggest that this analysis helps research and development teams prioritize roadmaps around regional registration and field validation increasingly required by commercial farm and government subsidy program procurement processes.

Key Market Segments Evaluated

By Product Type

  • Biofertilizers 
    • Nitrogen-Fixing Biofertilizers
    • Phosphate-Solubilizing Biofertilizers
    • Potash-Mobilizing Biofertilizers
    • Other Biofertilizers
  • Manure-Based Fertilizers 
    • Animal Manure
    • Poultry Litter
    • Green Manure
  • Compost-Based Fertilizers 
    • Vermicompost
    • Municipal Solid Waste Compost
    • Farm Yard Manure Compost
  • Plant-Based Fertilizers 
    • Oilseed Cakes
    • Seaweed-Based Extracts
    • Plant Residue-Based Fertilizers
  • Animal By-Product Fertilizers 
    • Fish Emulsion
    • Bone Meal
    • Blood Meal
  • Humic and Fulvic Acid-Based Fertilizers
  • Other Organic Fertilizers

By Crop Type

  • Cereals and Grains
  • Fruits and Vegetables
  • Oilseeds and Pulses
  • Commercial Crops
  • Turf and Ornamental
  • Other Crop Types

By Form

  • Dry/Granular
  • Liquid
  • Powder

By Application Method

  • Soil Application
  • Foliar Application
  • Fertigation
  • Seed Treatment

By Distribution Channel

  • Direct Sales
  • Retail and Agri-Input Dealers
  • Online and E-Commerce
  • Cooperative Societies

By End User

  • Commercial Farms
  • Smallholder and Individual Farmers
  • Home and Garden Users
  • Nurseries and Landscaping

By Region

  • North America 
    • U.S.
    • Canada
    • Mexico
  • Europe 
    • UK
    • Germany
    • France
    • Italy
    • Spain
    • Sweden
    • Denmark
    • Finland
    • Netherlands
    • Rest of Europe
  • Asia-Pacific 
    • China
    • India
    • Japan
    • South Korea
    • Taiwan
    • Indonesia
    • Vietnam
    • Australia
    • Philippines
    • Malaysia
    • Rest of APAC
  • Middle East & Africa 
    • Saudi Arabia
    • UAE
    • Egypt
    • Israel
    • Turkey
    • Nigeria
    • South Africa
    • Rest of MEA
  • Latin America 
    • Brazil
    • Argentina
    • Chile
    • Colombia
    • Rest of LATAM

Conclusion & Recommendations

The long-term outlook for the market remains positive, with global revenue projected to expand from USD 13.2 billion in 2025 to USD 35.9 billion by 2035 at a 10.6% CAGR. We observed that sustained government bio-input subsidy programs, rising consumer demand for chemical-free food, and expanding certified organic farmland will continue underpinning demand across cereal, fruit and vegetable, and commercial crop segments through the forecast period.

What Strategic Positioning Should Organic Fertilizers Producers Pursue?

Producers should prioritize regional registration and field validation capability while pursuing biogas digestate integration to secure long-term commercial farm and government program contracts. Next Move Strategy Consulting's assessment indicates that companies investing early in plant-based biostimulants and localized manufacturing capacity will be best positioned to capture premium positioning within the organic fertilizers market.

How Attractive Is the Organic Fertilizers Market for New Investment?

The organic fertilizers industry presents an attractive investment case, supported by a USD 21.4 billion absolute dollar opportunity between 2026 and 2035 and above-average growth in Latin America and Plant-Based Fertilizers categories. We found that investment attractiveness is highest for producers combining established distribution reach with proven regional registration capability, positioning them to serve both large commercial farms and government-subsidized smallholder segments simultaneously.

What Market Shifts and Key Risks Should Stakeholders Monitor?

Stakeholders should monitor slower visible results compared with synthetic alternatives, limited smallholder farmer awareness, and fragmented regional supply chains as key risks to the organic fertilizers market. Our analysis shows that producers unable to demonstrate credible farmer education and consistent product quality risk losing adoption momentum to competitors with proven field validation and extension support programs.

What Are the Key Growth Pathways for the Organic Fertilizers Market?

Key growth pathways include expanding registered biofertilizer adoption across export crop segments, scaling biogas digestate integration for manure-based products, and deepening penetration into Latin American and Asia-Pacific smallholder farmer segments. Next Move Strategy Consulting's analysis indicates that producers pursuing these pathways while maintaining regional registration discipline will be best positioned to capture the organic fertilizers market's projected growth through 2035.

Delivered Customizations

We have successfully delivered the following deep-dive customizations:

Client Request Customization Delivered Value Adds
Historical Market Growth Analysis
  • Historical revenue and volume analysis of organic fertilizers by product type, form, and crop type.
  • Reveals high-growth product and crop segments to prioritize for portfolio and capacity decisions.
Country-Level Trade Assessment
  • Country-wise import and export analysis for organic fertilizers such as manure-based, compost, and bio-based nutrient products.
  • Identifies sourcing hubs, export opportunities, and import-dependent markets for expansion.
Company-Level Sales Volume Analysis
  • Company-level organic fertilizer sales volume and revenue benchmarking by product type and form where disclosed.
  • Highlights producer scale and competitive positioning to guide partnerships and M&A targets.
Crop-Wise Organic Nutrient Demand Mapping
  • Organic fertilizer demand mapped by crop type, product type, and application method across key producing regions.
  • Pinpoints crops and application practices with the strongest organic adoption for targeted product development.
Feedstock Availability and Production Cost Assessment
  • Regional assessment of manure, crop residue, and food waste feedstock availability and its link to organic fertilizer production economics.
  • Supports plant siting, sourcing strategy, and cost-competitive capacity expansion decisions.
Regulatory and Certification Impact Assessment
  • Country-wise review of organic input regulations, certification standards, and subsidy programs affecting organic fertilizer adoption.
  • Guides market entry timing, compliance planning, and localization of product offerings.

FAQs

About the Author

Liza Phukan

Liza Phukan

Liza Phukan is Research Associate at Next Move Strategy Consulting, where she has covered emerging industries and market research across sectors for 3.5 years. Her work includes analyzing industry developments, validating market data, and developing structured business content from research findings. She uses secondary research and data-validation practices to turn complex market information into clear decision-useful market analysis for business audiences and support report development and B2B.

About the Reviewer

Supradip Baul

Supradip Baul

Supradip Baul is an accomplished business consultant and strategist with over a decade of rich experience in market intelligence, strategy, technology, and business transformation. His work has included rigorous qualitative and quantitative analysis across multiple industries, helping clients shape investment decisions and long-term roadmaps. Earlier in his career, he was associated with Gartner, where he contributed to industry-leading reports and market share analyses. He has worked with leading global companies and holds an MBA with a dual specialization in Marketing and Finance.

Download Free Sample

Mohit Agarwal

MOHIT AGARWAL

Chief Manager

DryChem India Pvt. Ltd.

Next Move Strategy Consulting is an amazing team of consultants. We required a market study report for our investors on top priority and the team went above and beyond our expectations to deliver the same with ample supporting data within a short time span enabling us to secure the investments and keep our project timeline maintained. Their professionalism, attention to detail, and timely delivery of actionable recommendations have left a lasting impression on our organization.

Nishant Awate

NISHANT AWATE

Business Development Global Sales

Zehnder Group Deutschland GmbH

Our experience working with Next Move Strategy Consulting was positive. The team was responsive, professional, and open to incorporating our specific requirements throughout the project. The India AHU market study was comprehensive and well structured, covering market value and volume forecasts, product and application segments, and key industry trends. The inclusion of both AHU and residential MVHR market insights made the study particularly relevant for our strategic market assessment. Overall, the report provides a solid foundation for evaluating market potential, identifying priority segments, and supporting business-development decisions in India.

Henri Knyphausen

HENRI KNYPHAUSEN

Partner at Singulier [Ex-BCG]

Singulier

I recently engaged NEXTMSC.com for a commercial due diligence project within the intralogistics sector, and I am pleased to provide a reference based on my experience. In utilizing NEXTMSC.com's services, I found their report to offer valuable insights into market dynamics and key industry players. The initial report provided a solid foundation for our analysis. However, as we were investigating a smaller target in the market, and I had specific customization requests requiring additional research. These requests included detailed information on product portfolios of various players and sub-market sizes, both inclusive and exclusive of certain product categories. NEXTMSC.com demonstrated commendable responsiveness and agility in accommodating these customization requests. Within a timeframe of 1-2 weeks, they delivered a revised report that met our specific needs. Furthermore, they were receptive to my follow-up inquiries, ensuring clarity and understanding of the data provided. The final deliverable significantly contributed to our due diligence efforts. One of NEXTMSC.com's notable strengths lies in their qualitative research capabilities. However, for future engagements, I would recommend the inclusion of a quantified market model in Excel format. Such a model would offer the ability to conduct in-depth analyses and explore various market segments, including country-specific data and subcomponent breakdowns. Based on my positive experience, I would not hesitate to work with NEXTMSC.com again. Their responsiveness, willingness to accommodate customization requests, and commitment to delivering actionable insights make them a reliable partner for commercial research projects.

Ross J Mckenzie

ROSS J MCKENZIE

Business Insight Manager

Staysure Group

“Next MSC have been incredibly helpful in providing detailed & robust information on our market, alongside quantifying growth by different segments. The process to procure was simple and easy, with sample reports and regular contact to ensure we had what we needed. Succinct detail on their sources & methodologies is also greatly received, allowing transparency in this respect helps build trust in the detail you pay for. Joseph in particular was fantastic, and helped ensure efficient provision of the insight pack – thank you NMSC!”.

Melanie Samko

MELANIE SAMKO

Director of Marketing

TOSOH BIOSCIENCE, INC.

The information provided by NMSC is incredibly valuable, thank you so much for such a excellent work. I really appreciate it. I will make sure to reference all of it, in my summary document.

Custom Market Research Services

We will customize the research for you if the listed report does not fully match your requirements.

Get 30% Free Customization

Select License

This website uses cookies to ensure you get the best experience on our website. Learn more

✖