Crop Protection Chemicals Market Global Industry Analysis and Forecast (2026–2035)

The global Crop Protection Chemicals Market size was valued at USD 82.50 billion in 2025 and is estimated at USD 86.60 billion in 2026, forecast to reach USD 134.30 billion by 2035, expanding at a 5.0% CAGR between 2026 and 2035. Asia-Pacific leads with approximately 36% share, while Herbicides dominate all other product types with approximately 45% share.

Download Free Sample PDF
Base Year (2025)
$82.50 Billion
Forecast (2035)
$134.30 Billion
CAGR (2026-2035)
5.0%
Top Region
Asia-Pacific

What Is the Crop Protection Chemicals Market Size?

The global crop protection chemicals market size was valued at USD 82.50 billion in 2025 and is estimated at USD 86.60 billion in 2026, forecast to reach USD 134.30 billion by 2035, expanding at a 5.0% CAGR between 2026 and 2035. Asia-Pacific leads with approximately 36% share, while herbicides dominate all other product types with approximately 45% share.

We observed that growth is broad-based across every segmentation axis, with biological product adoption and digital distribution channels driving the dominant structural shifts through 2035.

Crop Protection Chemicals Market Global Industry Analysis and Forecast (2026–2035) Revenue Forecast

Values in USD Billion

2025 $82.50 Billion
2025
2026 $86.60 Billion
2026
2027 $90.93 Billion
2027
2028 $95.48 Billion
2028
2029 $100.25 Billion
2029
2030 $105.26 Billion
2030
2031 $110.53 Billion
2031
2032 $116.05 Billion
2032
2033 $121.85 Billion
2033
2034 $127.95 Billion
2034
2035 $134.30 Billion
2035

Key Takeaways

By Product Type: Herbicides held the largest share of approximately 45% (USD 37.13 billion) in 2025; Biopesticides is the fastest-growing sub-segment at 9.0% CAGR from 2026–2035.

By Origin: Synthetic Chemicals held the largest share of approximately 75% (USD 61.88 billion) in 2025; Biological and Bio-based Products is the fastest-growing sub-segment at 10.6% CAGR from 2026–2035.

By Crop Type: Cereals and Grains held the largest share of approximately 40% (USD 33.00 billion) in 2025; Fruits and Vegetables is the fastest-growing sub-segment at 7.1% CAGR from 2026–2035.

By Mode of Application: Foliar Spray held the largest share of approximately 55% (USD 45.38 billion) in 2025; Seed Treatment is the fastest-growing sub-segment at 7.7% CAGR from 2026–2035.

By Formulation: Liquid Formulations held the largest share of approximately 68% (USD 56.10 billion) in 2025; Dry Formulations is the fastest-growing sub-segment at 7.0% CAGR from 2026–2035.

By Distribution Channel: Distributors and Retailers held the largest share of approximately 52% (USD 42.90 billion) in 2025; Digital and Online Platforms is the fastest-growing sub-segment at 12.7% CAGR from 2026–2035.

By End User: Large Commercial Farms held the largest share of approximately 54% (USD 44.55 billion) in 2025; Small and Medium Farms is the fastest-growing sub-segment at 6.8% CAGR from 2026–2035.

Dominant Region: Asia-Pacific dominated with approximately 36% revenue share (USD 30.00 billion) in 2025.

Fastest-Growing Region: Latin America is expected to register the highest CAGR of 9.1% during 2026–2035.

Dominant Country: China led with approximately USD 10.50 billion in 2025.

Fastest-Growing Country: India is the fastest-growing country at approximately 9.5% CAGR from 2026–2035.

Market Opportunity: The crop protection chemicals market is expected to create an absolute dollar opportunity of USD 47.70 billion between 2026 and 2035, presenting significant investment potential across biologicals, digital distribution, and precision application technologies.

According to NMSC analysis, manufacturers are increasingly integrating biological and bio-based active ingredients alongside conventional synthetic chemistries to address regulatory pressure and resistance management, a shift that favors diversified portfolio players over single-chemistry specialists as global food demand continues rising through 2035.

What Does the Crop Protection Chemicals Market Encompass?

The crop protection chemicals market encompasses herbicides, insecticides, fungicides, biopesticides, and other specialty chemical formulations applied to protect crops from weeds, insects, fungal pathogens, and other pests across cereals, oilseeds, fruits, vegetables, and turf applications. Our assessment indicates that the scope spans synthetic and biological origin products, distributed through direct sales, agricultural distributors and retailers, and increasingly through digital and online platforms to large commercial farms, small and medium growers, and government and institutional buyers worldwide.
The category has evolved from broad-spectrum synthetic chemistries into precision, resistance-managed formulations combining conventional actives with biological modes of action. The United States Department of Agriculture notes that pests, including weeds, plant diseases, and insects, ruin more than 40% of the world's potential food supply annually, anchoring sustained reliance on crop protection products. Regulatory frameworks such as the U.S. Environmental Protection Agency's pesticide registration process under the Federal Insecticide, Fungicide, and Rodenticide Act and the European Union's plant protection product regulation shape active ingredient approval and residue standards. We observed that technology adoption is shifting toward seed treatment and precision foliar application. NMSC's analysis indicates that this structural shift, combined with rising biologicals adoption, is redefining product portfolios across the crop protection chemicals market.

Market Drivers & Dynamics

Interactive Dataset
Rising global food demand and yield protection needs driver +1.8% Global 2026-2035
Growing pest, weed, and pathogen resistance pressure driver +1.4% Global 2026-2035
Expansion of biological and bio-based product portfolios driver +1.2% North America, Europe, Latin America 2026-2035
Rising adoption of precision and seed treatment application driver +1.0% North America, Europe, Asia-Pacific 2026-2035
Expanding cultivation of high-value fruit and vegetable crops driver +0.8% Asia-Pacific, Latin America 2026-2035
Government agricultural productivity support programs driver +0.6% Asia-Pacific, MEA 2026-2035
Stringent regulatory approval and residue limit requirements restraint -1.1% Global 2026-2035
Rising generic competition compressing synthetic product pricing restraint -0.7% Asia-Pacific, Latin America 2026-2035
Grower price sensitivity amid input cost management restraint -0.5% North America, Latin America 2026-2032
Source: Next Move Strategy Consulting

Growth Drivers

What Is the Primary Growth Driver of the Crop Protection Chemicals Market?

Rising global food demand and the need to protect crop yield is the primary driver of the market. The United States Department of Agriculture estimates that pests, including weeds, plant diseases, and insects, destroy more than 40% of the world's potential food supply annually. We observed that this yield-loss pressure, reinforced by a growing global population, continues to anchor baseline demand for herbicides, insecticides, and fungicides across developed and emerging agricultural economies alike.

How Is Resistance Management Driving Crop Protection Chemicals Market Growth?

Rising resistance among weeds, insects, and pathogens to existing active ingredients is accelerating demand for new multi-active and biological formulations. Corteva, Inc.'s first-quarter 2026 disclosure reported crop protection net sales of USD 1,882 million, up 10% year over year, driven partly by demand for new products and spinosyn-based insecticides. Our assessment indicates that this resistance-driven replacement cycle is compressing product development timelines across major manufacturers.

Growth Inhibitors

What Is Restraining Crop Protection Chemicals Market Expansion?

Stringent regulatory approval and residue limit requirements restrain faster product introduction, particularly for new synthetic active ingredients requiring multi-year registration review. The European Union's plant protection product regulation and the U.S. Environmental Protection Agency's registration process under the Federal Insecticide, Fungicide, and Rodenticide Act impose extensive data requirements before market entry. We found that this regulatory rigor, while protecting food safety, extends time-to-market and raises development costs for new active ingredients.

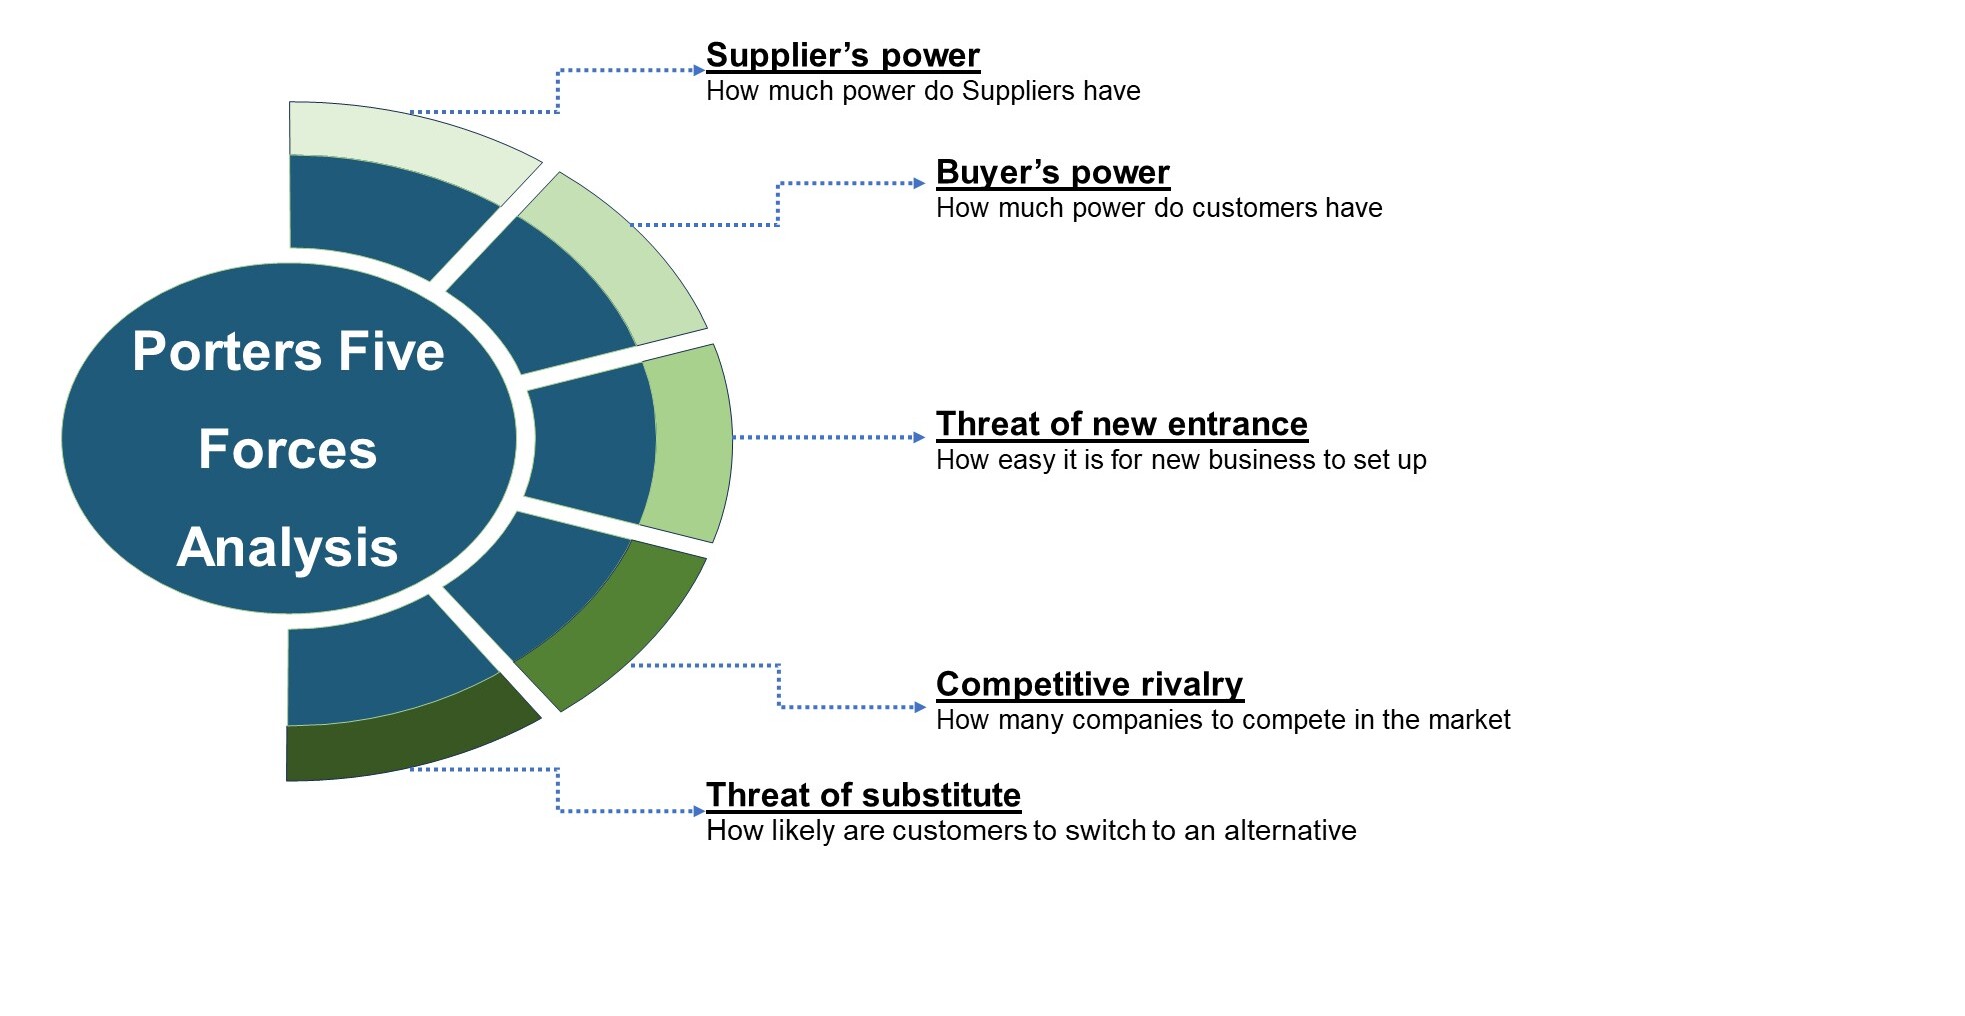
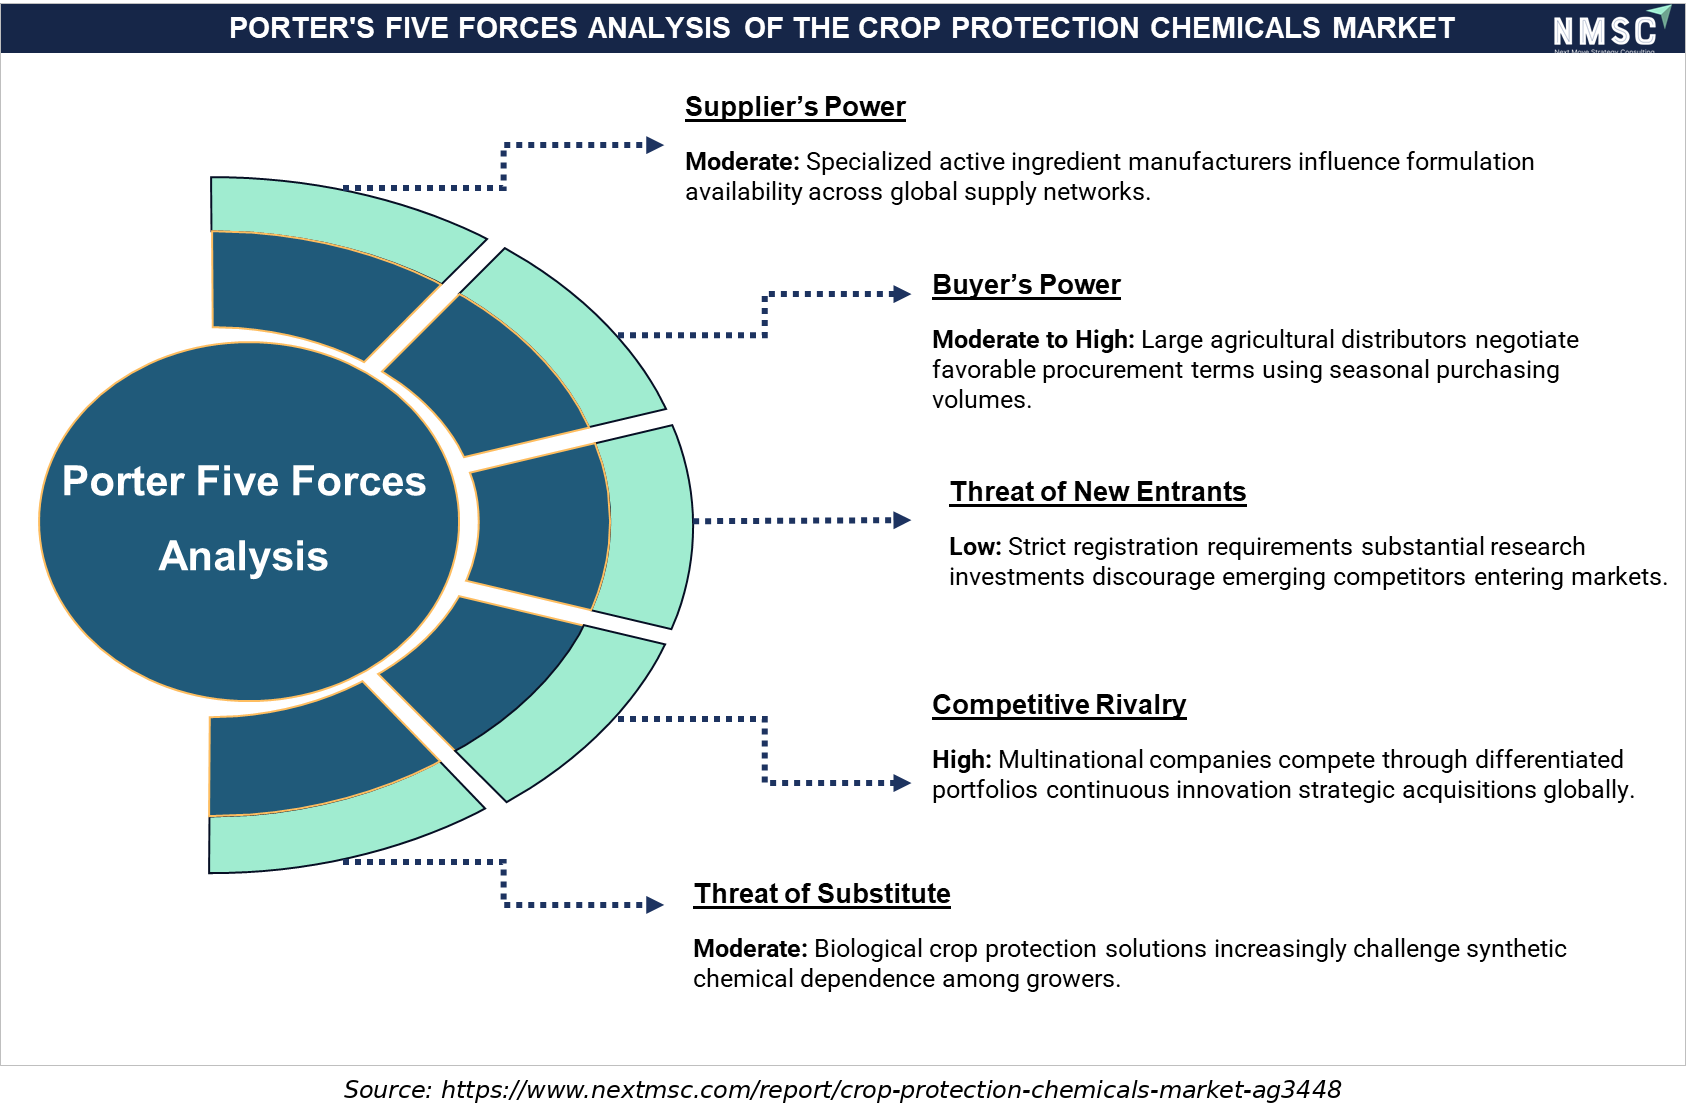
Porter’s Five Forces Analysis of the Crop Protection Chemicals Market

The crop protection chemicals market is shaped by competition among established manufacturers, regulatory requirements, and evolving agricultural practices. Supplier influence varies with the availability of active ingredients and specialized inputs, while buyers have options across chemical and biological solutions. Entry barriers remain influenced by formulation expertise, registration requirements, manufacturing capabilities, and established distribution networks.

Segmentation Analysis

2025 (USD Billion)
2035 (USD Billion)
Herbicides 2025: $37.13 Billion | 2035: $56.41 Billion
Herbicides
Insecticides 2025: $20.63 Billion | 2035: $36.26 Billion
Insecticides
Fungicides 2025: $16.50 Billion | 2035: $25.52 Billion
Fungicides
Biopesticides 2025: $4.95 Billion | 2035: $10.74 Billion
Biopesticide
Other Product Types 2025: $3.30 Billion | 2035: $5.37 Billion
Other Produc
Herbicides $37.13 Billion $56.41 Billion 4.8%
Insecticides $20.63 Billion $36.26 Billion 6.5%
Fungicides $16.50 Billion $25.52 Billion 5.0%
Biopesticides $4.95 Billion $10.74 Billion 9.0%
Other Product Types $3.30 Billion $5.37 Billion 5.6%

Which Product Type Dominates the Crop Protection Chemicals Market?

Herbicides dominate the product type segmentation with approximately 45% share, reflecting the widespread need for effective weed management across cereals, grains, and oilseed crops where weed infestation directly reduces yield and quality. We observed that biopesticides are the fastest-growing sub-segment at 9.0% CAGR, as manufacturers including Syngenta Group and Corteva expand biological disease and pest control offerings to address resistance management and regulatory pressure on conventional synthetic chemistries.

2025 (USD Billion)
2035 (USD Billion)
Synthetic ch
Biological a
Segment Item 2025 (USD Billion) 2035 (USD Billion) CAGR
Synthetic chemicals $10.0 USD Billion $40.0 USD Billion 25.0%
Biological and bio-based products $17.1 USD Billion $51.1 USD Billion 11.0%

Segment-wise data is locked

Unlock complete segment-wise numbers for By Origin.

Unlock Full Data

Which Origin Segment Is Fastest-Growing in the Crop Protection Chemicals Market?

Synthetic chemicals held the largest share of the origin segmentation in 2025 at approximately 75%, reflecting decades of established registration and grower familiarity. Our findings suggest that biological and bio-based products are the fastest-growing sub-segment at 10.6% CAGR, driven by regulatory support for reduced-residue solutions and manufacturer investment in biological research, including Corteva's disclosed volume growth in biologicals during 2025.

2025 (USD Billion)
2035 (USD Billion)
Cereals and
Oilseeds and
Fruits and v
Turf and orn
Other crop t
Segment Item 2025 (USD Billion) 2035 (USD Billion) CAGR
Cereals and grains $10.0 USD Billion $40.0 USD Billion 27.0%
Oilseeds and pulses $17.1 USD Billion $51.1 USD Billion 9.0%
Fruits and vegetables $24.2 USD Billion $62.2 USD Billion 19.0%
Turf and ornamentals $31.3 USD Billion $73.3 USD Billion 17.0%
Other crop types $38.4 USD Billion $84.4 USD Billion 18.0%

Segment-wise data is locked

Unlock complete segment-wise numbers for By Crop Type.

Unlock Full Data

Which Crop Type Leads the Crop Protection Chemicals Market?

Cereals and grains lead crop type segmentation with approximately 40% share, reflecting the extensive global cultivation area devoted to wheat, corn, and rice requiring consistent weed and disease management. We found that fruits and vegetables are the fastest-growing crop type at 7.1% CAGR, as expanding high-value horticultural cultivation and rising per-capita fruit and vegetable consumption drive demand for targeted fungicide and insecticide applications.

2025 (USD Billion)
2035 (USD Billion)
Foliar spray
Soil treatme
Seed treatme
Fumigation
Other modes
Segment Item 2025 (USD Billion) 2035 (USD Billion) CAGR
Foliar spray $10.0 USD Billion $40.0 USD Billion 14.0%
Soil treatment $17.1 USD Billion $51.1 USD Billion 24.0%
Seed treatment $24.2 USD Billion $62.2 USD Billion 22.0%
Fumigation $31.3 USD Billion $73.3 USD Billion 12.0%
Other modes of application $38.4 USD Billion $84.4 USD Billion 27.0%

Segment-wise data is locked

Unlock complete segment-wise numbers for By Mode of Application.

Unlock Full Data
2025 (USD Billion)
2035 (USD Billion)
Liquid formu
Dry formulat
Segment Item 2025 (USD Billion) 2035 (USD Billion) CAGR
Liquid formulations $10.0 USD Billion $40.0 USD Billion 24.0%
Dry formulations $17.1 USD Billion $51.1 USD Billion 22.0%

Segment-wise data is locked

Unlock complete segment-wise numbers for By Formulation.

Unlock Full Data
2025 (USD Billion)
2035 (USD Billion)
Direct sales
Distributors
Digital and
Segment Item 2025 (USD Billion) 2035 (USD Billion) CAGR
Direct sales $10.0 USD Billion $40.0 USD Billion 23.0%
Distributors and retailers $17.1 USD Billion $51.1 USD Billion 9.0%
Digital and online platforms $24.2 USD Billion $62.2 USD Billion 19.0%

Segment-wise data is locked

Unlock complete segment-wise numbers for By Distribution Channel.

Unlock Full Data
2025 (USD Billion)
2035 (USD Billion)
Large commer
Small and me
Government a
Segment Item 2025 (USD Billion) 2035 (USD Billion) CAGR
Large commercial farms $10.0 USD Billion $40.0 USD Billion 21.0%
Small and medium farms $17.1 USD Billion $51.1 USD Billion 23.0%
Government and institutional buyers $24.2 USD Billion $62.2 USD Billion 25.0%

Segment-wise data is locked

Unlock complete segment-wise numbers for By End User.

Unlock Full Data

Growth Opportunities

NMSC's analysis indicates that three whitespace opportunities stand out for manufacturers and technology vendors positioning for the next phase of market expansion.

How Can Biological Portfolio Expansion Unlock New Revenue?

Expanding biological and bio-based product lines alongside conventional chemistries offers manufacturers a lower-regulatory-friction path to address resistance management demand. This opportunity benefits large agrochemical manufacturers and specialized biologicals developers seeking share in fruit, vegetable, and cereal disease control.

What Opportunity Does Seed Treatment Present for Manufacturers?

Growing adoption of seed treatment application, which delivers targeted early-season pest and disease protection with reduced field application requirements, creates opportunity for manufacturers to bundle chemistries with precision seed technology. This mechanism benefits large commercial farms and seed technology providers seeking integrated crop protection solutions.

How Can Digital Distribution Expand Reach to Small and Medium Farms?

Expanding digital and online distribution platforms creates opportunity for manufacturers and distributors to reach small and medium farms in emerging agricultural economies more cost-effectively than traditional retail networks. This mechanism benefits distributors and digital platform operators scaling access across Asia-Pacific and Latin American growing regions.

Regional Outlook

2025 (USD Billion)
2035 (USD Billion)
Asia-Pacific
North Americ
Europe
Latin Americ
Middle East
Region 2025 (USD Billion) 2035 (USD Billion) CAGR (%)
Asia-Pacific $10.0 USD Billion $40.0 USD Billion 9.0%
North America $17.1 USD Billion $51.1 USD Billion 27.0%
Europe $24.2 USD Billion $62.2 USD Billion 25.0%
Latin America $31.3 USD Billion $73.3 USD Billion 23.0%
Middle East & Africa $38.4 USD Billion $84.4 USD Billion 12.0%

Regional data is locked

Unlock complete regional numbers for this market.

Unlock Full Data

Competitive Landscape

Our findings suggest that the crop protection chemicals industry is moderately consolidated, with a small number of diversified global manufacturers competing alongside regional and generic-focused producers.

Dimension Description
Market Structure Moderately consolidated, with the top ten companies accounting for the majority share of global crop protection chemical revenue.
Innovation Focus Multi-active formulations, biological and bio-based product integration, and precision seed treatment technology.
M&A Activity Active, including Corteva's planned 2026 separation of its crop protection business into a standalone publicly traded company.

How Do Companies Compete in the Crop Protection Chemicals Market?

Companies compete primarily on active ingredient breadth, resistance-management formulation innovation, and distribution network depth across cereal, oilseed, and horticultural crop segments. NMSC's analysis indicates that manufacturers differentiate through proprietary active ingredient pipelines, co-development agreements, and regional manufacturing presence. Competitive rivalry is most intense in herbicide and insecticide categories, where multiple established manufacturers offer comparable core chemistries, pushing differentiation toward biological integration and formulation technology.

Which Competitive Archetypes Dominate the Crop Protection Chemicals Industry?

Two archetypes dominate: global diversified leaders such as Bayer AG and Syngenta Group that combine deep R&D pipelines with global distribution networks, and regional or generic-focused manufacturers such as UPL Limited and Jiangsu Yangnong Chemical Co., Ltd. that compete on cost-effective production scale. Our analysis shows that scale advantages favor global leaders in patented active ingredient categories, while regional manufacturers retain share in off-patent and generic product segments.

What Innovation and Differentiation Strategies Define Market Leadership?

Leading manufacturers are investing in multi-active formulations, biological co-development, and precision seed treatment technology to differentiate beyond conventional chemistry alone. We observed that Bayer AG's multi-active EverGolRise and Sivanto Energy launches, alongside Syngenta Group's biofungicide partnership with Ascribe Bioscience, illustrate how established players are broadening portfolios to address resistance management and sustainability expectations simultaneously.

How Active Is M&A and Structural Activity in the Crop Protection Chemicals Market?

Structural activity remains significant, exemplified by Corteva, Inc.'s April 2026 announcement of its planned fourth-quarter 2026 separation into a standalone, publicly traded crop protection company under incoming chief executive officer Luke Kissam. We found that similar portfolio-focused restructuring and co-development agreements, such as the FMC-Corteva fluindapyr technology-sharing arrangement, are likely to continue as manufacturers seek pure-play specialization and expanded active ingredient access.

Key Market Players

Our assessment identifies the following companies as the leading participants shaping competitive dynamics in the crop protection chemicals market.

Bayer AG Syngenta Group BASF SE Corteva, Inc. FMC Corporation UPL Limited ADAMA Ltd. Nufarm Limited Sumitomo Chemical Co., Ltd. American Vanguard Corporation Gowan Company Certis Biologicals Bioceres Crop Solutions Corp. PI Industries Limited Coromandel International Limited Rallis India Limited Albaugh, LLC Jiangsu Yangnong Chemical Co., Ltd. Zhejiang Wynca Chemical Industry Group Co., Ltd. Isagro S.p.A.

Latest Developments

We observed the following recent developments shaping competitive positioning across the crop protection chemicals industry.

Date Event
Jul 2026 Corteva launched Enclosa™ herbicide for soybeans after U.S. EPA approval. The product combines proprietary encapsulated acetochlor, a Group 15 herbicide, with cloransulam, a Group 2 herbicide, providing residual weed control for up to four weeks and expanding options for soybean weed-management programs.
Jul 2026 UPL Sustainable Agri Solutions launched Ricebeaux, a rice herbicide developed after more than a decade of R&D and multi-location trials. The solution targets weed-management challenges in rice cultivation and is designed to simplify control programs amid labour constraints and changing agricultural conditions.

Investment Opportunities

Where Are Capital Inflows Concentrated in the Crop Protection Chemicals Market?

Capital inflows are concentrated in biological product research and multi-active formulation development, as manufacturers seek to address resistance management and regulatory pressure simultaneously. We observed that Corteva's planned 2026 separation into a standalone crop protection he distinct from seed genetics businesses.

How Significant Is Infrastructure Investment in Supporting Market Growth?

Manufacturing capacity investment, particularly across India and China, is expanding the addressable production base for cost-competitive generic and branded crop protection products. Our assessment indicates that domestic manufacturers including PI Industries Limited and Jiangsu Yangnong Chemical Co., Ltd. continue expanding production capacity to serve both domestic and export markets, directly supporting regional market growth over the forecast period.

What ESG Considerations Are Shaping Investment in Crop Protection Chemicals?

Environmental, social, and governance considerations increasingly favor manufacturers demonstrating reduced-residue and biological product innovation. We found that investors and regulators are prioritizing companies showing measurable progress on integrated pest management and lower-toxicity formulations, aligning capital allocation with broader sustainability disclosure expectations across the agricultural inputs value chain.

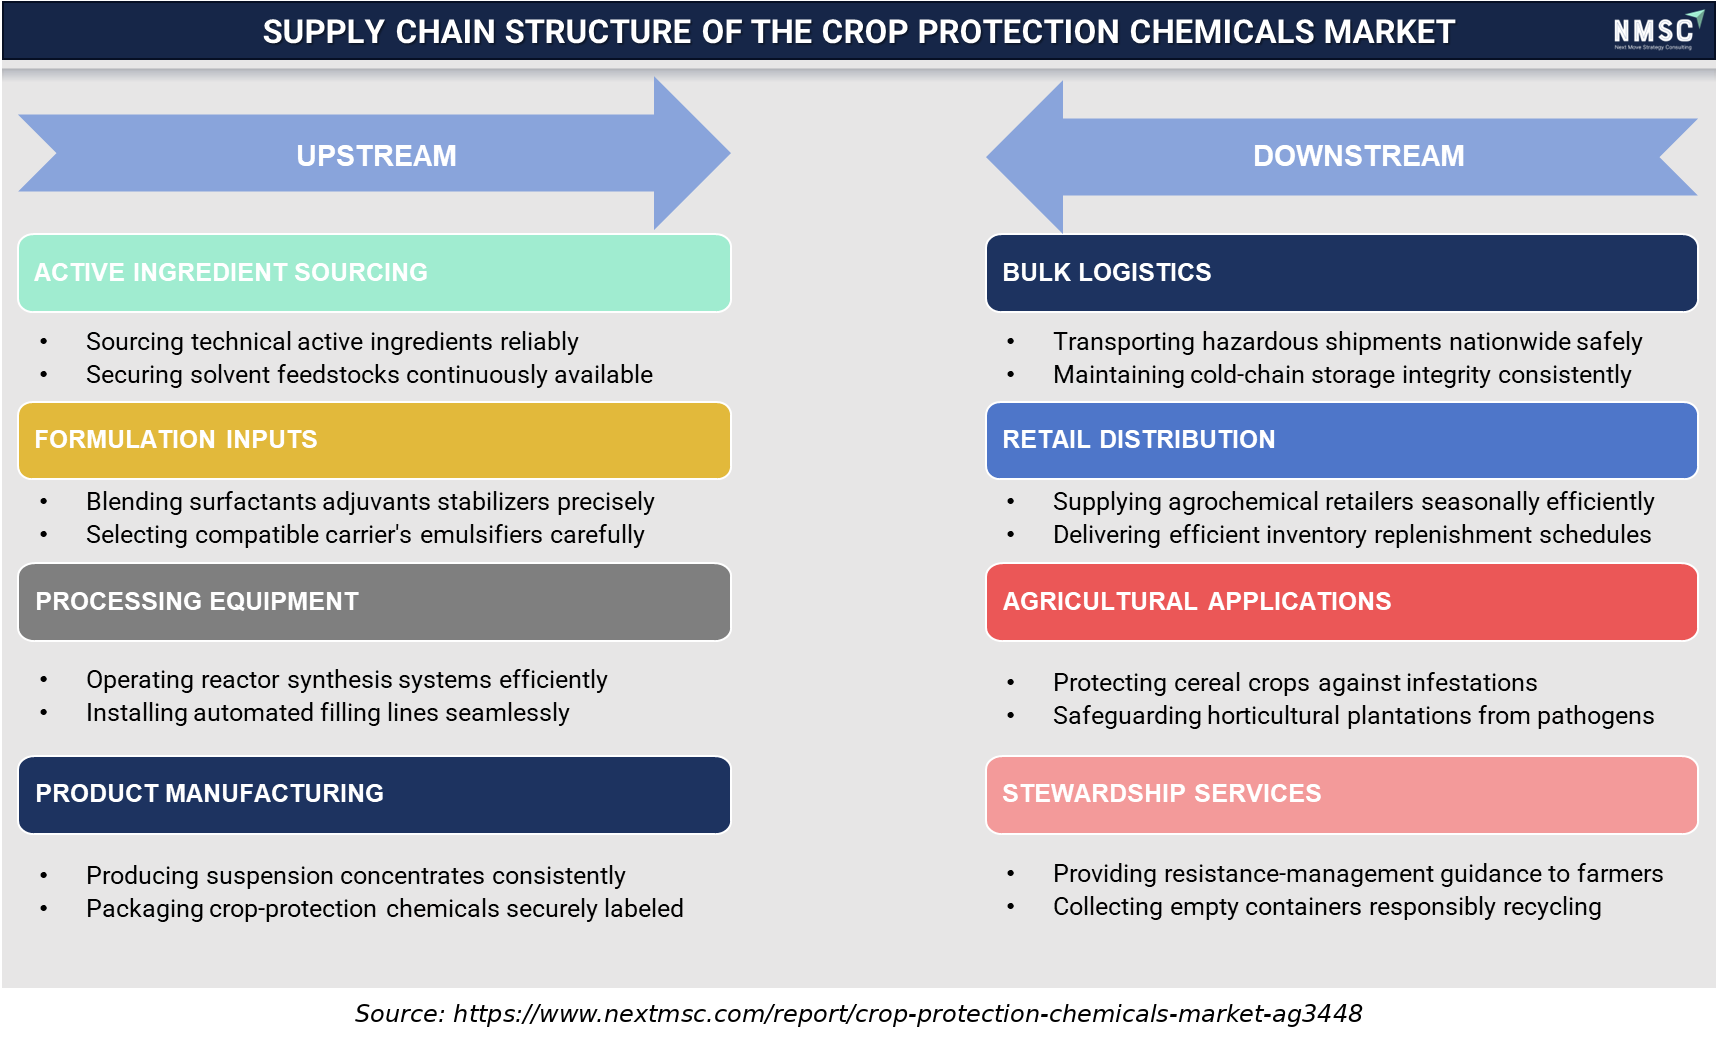
Supply Chain Structure of the Crop Protection Chemicals Market

Supply Chain Structure of the Crop Protection Chemicals Market
The crop protection chemicals supply chain spans active ingredient sourcing, formulation inputs, processing, manufacturing, logistics, distribution, and agricultural application. Reliable access to raw materials and compliant production supports consistent product availability, while specialized transportation and storage requirements influence downstream efficiency. Retail distributors connect manufacturers with farmers, complemented by stewardship services focused on responsible application and container management.

Key Benefits for Stakeholders

How Does This Report Benefit Industry Leaders and Enterprise Decision-Makers?

This report equips crop protection manufacturer and distributor leadership with segmented demand data, competitive benchmarking, and regional growth projections to prioritize capital allocation across product portfolios. NMSC's analysis indicates that decision-makers can use the segmentation and driver-restraint analysis to align product development timing with regulatory and resistance-management pressures shaping their specific crop and geography focus.

How Does This Report Benefit Investors and Financial Analysts?

Investors and financial analysts gain access to independently derived market sizing, CAGR trajectories, and competitive landscape analysis supporting valuation and diligence work across crop protection manufacturers, including pure-play entities emerging from corporate separations. Our assessment indicates that the regional and segment-level detail supports comparative analysis of growth exposure across public and private company portfolios.

How Does This Report Benefit Technology Vendors and Product Teams?

Technology vendors and product teams can use the segmentation by origin, mode of application, and distribution channel to identify underserved product categories and prioritize biological versus synthetic development investment. We observed that the driver-restraint and opportunity analysis directly informs go-to-market sequencing across regions with differing regulatory and adoption maturity.

Key Market Segments Evaluated

By Product Type

  • Herbicides 
    • Selective herbicides
    • Non-selective herbicides
  • Insecticides 
    • Chemical insecticides
    • Biological insecticides
  • Fungicides 
    • Contact fungicides
    • Systemic fungicides
  • Biopesticides
  • Other product types

By Origin

  • Synthetic chemicals
  • Biological and bio-based products

By Crop Type

  • Cereals and grains
  • Oilseeds and pulses
  • Fruits and vegetables
  • Turf and ornamentals
  • Other crop types

By Mode of Application

  • Foliar spray
  • Soil treatment
  • Seed treatment
  • Fumigation
  • Other modes of application

By Formulation

  • Liquid formulations
  • Dry formulations

By Distribution Channel

  • Direct sales
  • Distributors and retailers
  • Digital and online platforms

By End User

  • Large commercial farms
  • Small and medium farms
  • Government and institutional buyers

By Region

  • North America 
    • U.S.
    • Canada
    • Mexico.
  • Europe 
    • UK
    • Germany
    • France
    • Italy
    • Spain
    • Sweden
    • Denmark
    • Finland
    • Netherlands
    • Rest of Europe.
  • Asia-Pacific 
    • China
    • India
    • Japan
    • South Korea
    • Taiwan
    • Indonesia
    • Vietnam
    • Australia
    • Philippines
    • Malaysia
    • Rest of APAC.
  • Middle East & Africa 
    • Saudi Arabia
    • UAE
    • Egypt
    • Israel
    • Turkey
    • Nigeria
    • South Africa
    • Rest of MEA.
  • Latin America 
    • Brazil
    • Argentina
    • Chile
    • Colombia
    • Rest of LATAM.

Conclusion & Recommendations

What Strategic Positioning Should Manufacturers Pursue?

Manufacturers should prioritize integrated conventional and biological portfolios that address resistance management, while pursuing co-development agreements to expand active ingredient access without full internal development cost. Our assessment indicates that companies pursuing pure-play crop protection focus, following Corteva's planned separation model, will be best positioned to accelerate innovation as competitive intensity rises across commoditizing herbicide categories.

How Attractive Is the Market for New Investment?

The market presents steady investment characteristics given its durable demand base, expanding biological product categories, and exposure to rising global food security priorities. We found that biological and bio-based products and digital distribution channels, growing at 10.6% and 12.7% CAGR respectively, represent the most attractive entry points for growth-focused investors and strategic acquirers.

What Market Shifts and Key Risks Should Stakeholders Monitor?

Stakeholders should monitor the shift toward biological product integration and the corporate restructuring activity reshaping competitive positioning industry-wide. Our analysis shows that stringent regulatory approval timelines remain a key risk to new active ingredient introduction, while rising generic competition continues compressing pricing in mature synthetic product categories.

What Growth Pathways Should Companies Prioritize?

Companies should prioritize growth pathways centered on biological portfolio expansion, seed treatment technology adoption, and geographic expansion into Latin American and Asia-Pacific high-growth cultivation regions. NMSC's analysis indicates that these pathways offer the most direct route to capturing the USD 47.70 billion absolute dollar opportunity identified between 2026 and 2035.

Delivered Customizations

We have successfully delivered the following deep-dive customizations:

Client Request Customization Delivered Value Adds
Country-Level Trade Assessment
  • Country-wise import and export analysis of agrochemical active ingredients and formulated crop protection products by product type.
  • Reveals sourcing dependencies, export hubs, and supply-chain risks to guide procurement and market-entry decisions.
Historical Market Growth Analysis
  • Historical revenue and volume analysis by product type, origin, crop type, and formulation across key regions.
  • Identifies structural growth drivers and high-potential segments to prioritize portfolio and investment decisions.
Company-Level Product Share Analysis
  • Company-wise revenue share benchmarking across herbicide, fungicide, insecticide, and biopesticide portfolios, based on disclosed company data.
  • Highlights portfolio strengths and white spaces to support competitive positioning and M&A screening.
Active Ingredient Patent Expiry and Generic Opportunity Assessment
  • Mapping of key active ingredient patent expiries and generic entry potential by product type, crop type, and region.
  • Supports generic launch timing, in-licensing decisions, and defense planning against off-patent price erosion.
Regulatory Approval and Active Ingredient Restriction Impact Analysis
  • Country-level tracking of registration status, bans, and maximum residue limit changes for major actives, with impact on product type and crop type demand.
  • Anticipates portfolio risk and shifts toward biologicals and safer chemistries to guide registration and R&D priorities.
Crop-Wise Application and Channel Demand Analysis
  • Demand mapping by crop type, mode of application, formulation, distribution channel, and end user across key agricultural countries.
  • Pinpoints priority crop-application-channel combinations to sharpen product positioning, route-to-market, and customer targeting.

FAQs

About the Author

Mihul Sharma

Mihul Sharma

Mihul Sharma is Research Associate at Next Move Strategy Consulting, where he has covered technology, industrial, and healthcare markets for 3 years. His work applies structured business research, market analysis, and secondary-source review to assess market trends, competitive developments, and growth opportunities. He supports report development by fully synthesizing industry data, company information, and market signals into concise findings for strategy and investment-focused research teams.

About the Reviewer

Supradip Baul

Supradip Baul

Supradip Baul is an accomplished business consultant and strategist with over a decade of rich experience in market intelligence, strategy, technology, and business transformation. His work has included rigorous qualitative and quantitative analysis across multiple industries, helping clients shape investment decisions and long-term roadmaps. Earlier in his career, he was associated with Gartner, where he contributed to industry-leading reports and market share analyses. He has worked with leading global companies and holds an MBA with a dual specialization in Marketing and Finance.

Download Free Sample

Gaurav Jaiswal

GAURAV JAISWAL

Founder & CEO

Yano Charge Private Limited

The EV Charging market research report provided by the NextMSC was exceptionally detailed and insightful. It offered a comprehensive analysis that proved to be a game-changer for our strategic planning. Truly a testament to the NextMSC’s expertise and thoroughness in EV market landscape & analysis.

Nishant Awate

NISHANT AWATE

Business Development Global Sales

Zehnder Group Deutschland GmbH

Our experience working with Next Move Strategy Consulting was positive. The team was responsive, professional, and open to incorporating our specific requirements throughout the project. The India AHU market study was comprehensive and well structured, covering market value and volume forecasts, product and application segments, and key industry trends. The inclusion of both AHU and residential MVHR market insights made the study particularly relevant for our strategic market assessment. Overall, the report provides a solid foundation for evaluating market potential, identifying priority segments, and supporting business-development decisions in India.

Ross J Mckenzie

ROSS J MCKENZIE

Business Insight Manager

Staysure Group

“Next MSC have been incredibly helpful in providing detailed & robust information on our market, alongside quantifying growth by different segments. The process to procure was simple and easy, with sample reports and regular contact to ensure we had what we needed. Succinct detail on their sources & methodologies is also greatly received, allowing transparency in this respect helps build trust in the detail you pay for. Joseph in particular was fantastic, and helped ensure efficient provision of the insight pack – thank you NMSC!”.

Robert Sean Trevino

ROBERT SEAN TREVINO

Sr. Director, Head of Strategic Insights & Analytics

Foundation Medicine

I realized that it was a reliable source of information. These days, there are many people who are looking for authentic data, and this is one of the only sources that can offer them with what they need;

Henri Knyphausen

HENRI KNYPHAUSEN

Partner at Singulier [Ex-BCG]

Singulier

I recently engaged NEXTMSC.com for a commercial due diligence project within the intralogistics sector, and I am pleased to provide a reference based on my experience. In utilizing NEXTMSC.com's services, I found their report to offer valuable insights into market dynamics and key industry players. The initial report provided a solid foundation for our analysis. However, as we were investigating a smaller target in the market, and I had specific customization requests requiring additional research. These requests included detailed information on product portfolios of various players and sub-market sizes, both inclusive and exclusive of certain product categories. NEXTMSC.com demonstrated commendable responsiveness and agility in accommodating these customization requests. Within a timeframe of 1-2 weeks, they delivered a revised report that met our specific needs. Furthermore, they were receptive to my follow-up inquiries, ensuring clarity and understanding of the data provided. The final deliverable significantly contributed to our due diligence efforts. One of NEXTMSC.com's notable strengths lies in their qualitative research capabilities. However, for future engagements, I would recommend the inclusion of a quantified market model in Excel format. Such a model would offer the ability to conduct in-depth analyses and explore various market segments, including country-specific data and subcomponent breakdowns. Based on my positive experience, I would not hesitate to work with NEXTMSC.com again. Their responsiveness, willingness to accommodate customization requests, and commitment to delivering actionable insights make them a reliable partner for commercial research projects.

Custom Market Research Services

We will customize the research for you if the listed report does not fully match your requirements.

Get 30% Free Customization

Select License

This website uses cookies to ensure you get the best experience on our website. Learn more

✖