Over-the-Top (OTT) Market Global Industry Analysis and Forecast (2026-2035)

Over-the-Top (OTT) market size is estimated at USD 1168.38 billion in 2026, projected to reach USD 5188.02 billion by 2035, growing at a CAGR of 18% from 2026 to 2035. Key drivers include rising broadband and smartphone penetration, and live sports content adoption, with North America leading the market and Asia-Pacific registering the fastest growth.

Download Free Sample PDF
Base Year (2025)
$721.75 Billion
Forecast (2035)
$5,188.02 Billion
CAGR (2026-2035)
18.0%
Top Region
North America

What Is the Over-the-Top (OTT) Market Size?

The global OTT market size was valued at USD 721.75 billion in 2025 and is estimated at USD 1168.38 billion in 2026, forecast to reach USD 5188.02 billion by 2035, expanding at an 18% CAGR between 2026 and 2035. North America leads with approximately 40% share, while Video OTT dominates all other types with approximately 58% share.

We observed that the growth is broad-based across every segmentation axis, with ad-supported streaming expansion and live sports rights acquisition driving the dominant structural shifts through 2035.

Over-the-Top (OTT) Market Global Industry Analysis and Forecast (2026-2035) Revenue Forecast

Values in USD Billion

2025 $721.75 Billion
2025
2026 $1,168.38 Billion
2026
2027 $1,378.69 Billion
2027
2028 $1,626.85 Billion
2028
2029 $1,919.69 Billion
2029
2030 $2,265.23 Billion
2030
2031 $2,672.97 Billion
2031
2032 $3,154.11 Billion
2032
2033 $3,721.84 Billion
2033
2034 $4,391.78 Billion
2034
2035 $5,188.02 Billion
2035

Key Takeaways

By Type: Video OTT held the largest share of approximately 58% (USD 420.00 billion) in 2025; Game OTT is the fastest-growing sub-segment at 24.2% CAGR from 2026–2035.

By Monetization Model: Subscription Revenue held the largest share of approximately 53% (USD 385.00 billion) in 2025; Advertising Revenue is the fastest-growing sub-segment at 25.9% CAGR from 2026–2035.

By Content Category: General Entertainment held the largest share of approximately 33% (USD 240.00 billion) in 2025; Creator and User-Generated Content is the fastest-growing sub-segment at 27.3% CAGR from 2026–2035.

Dominant Region: North America dominated with approximately 40% revenue share (USD 285.00 billion) in 2025.

Fastest-Growing Region: Asia-Pacific is expected to register the highest CAGR of 26.1% during 2026–2035.

Dominant Country: U.S. led with approximately USD 235.00 billion in 2025.

Fastest-Growing Country: India is the fastest-growing country at approximately 28.9% CAGR from 2026–2035.

Market Opportunity: The OTT market is expected to create an absolute dollar opportunity of USD 4019.64 billion between 2026 and 2035, presenting significant investment potential across ad-supported streaming, live sports, and creator content channels.

According to NMSC analysis, platform operators are increasingly bundling subscription, advertising, and transactional revenue streams within a single service to maximize average revenue per user, a shift that favors diversified platform operators over single-monetization-model providers as ad-supported tiers scale globally through 2035.

What Does the Over-the-Top (OTT) Market Encompass?

The OTT market encompasses video, audio, game, and communication services delivered directly to consumers over the internet, bypassing traditional cable, satellite, and telecommunications distribution. Our assessment indicates that the scope spans on-demand and live video streaming, music and podcast streaming, cloud gaming services, and messaging and communication platforms, monetized through subscription, advertising, transactional, and distribution revenue models. The category has evolved from a niche cord-cutting alternative into the dominant mode of media consumption across connected households, exemplified by the rapid global scaling of ad-supported streaming tiers.

Regulatory frameworks such as the European Union's Audiovisual Media Services Directive and national telecommunications authority oversight increasingly shape content quota, advertising, and platform accountability requirements across covered jurisdictions. We observed that technology adoption is shifting toward connected TV as the primary viewing device, alongside AI-driven content recommendation and dynamic ad insertion systems. NMSC's analysis indicates that this structural shift, combined with rising live sports rights acquisition, is redefining competitive priorities across the OTT market.

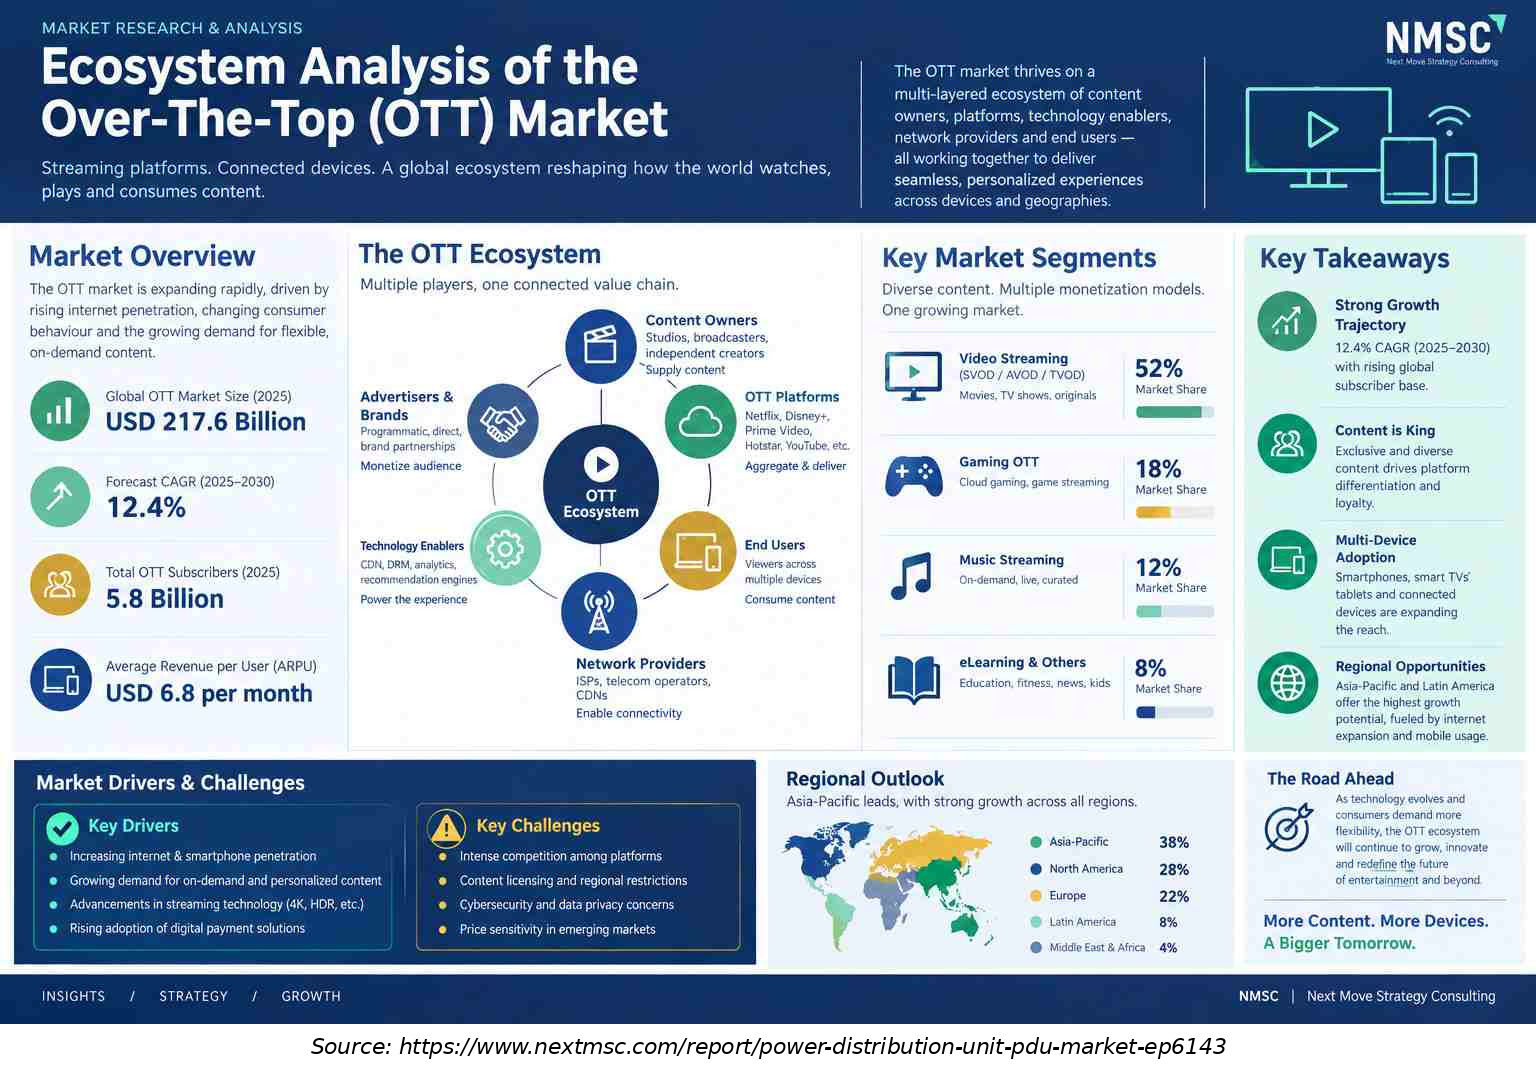
Ecosystem Analysis of the Over-The-Top (Ott) Market

The infographic presents the Regulatory Framework Impacting the Over-the-Top (OTT) Market, highlighting key regulatory areas shaping digital streaming services. It covers content regulation, data privacy and user protection, licensing and market entry, competition and antitrust laws, and taxation and local compliance. The framework illustrates how regulatory requirements influence platform operations, consumer protection, market access, fair competition, and the development of a trusted and sustainable OTT ecosystem.

Market Drivers & Dynamics

Interactive Dataset
Rising global smartphone and broadband penetration driver +3.2% Global 2026-2035
Growing adoption of ad-supported and FAST channel streaming tiers driver +2.6% North America, Europe 2026-2035
Expanding live sports streaming rights acquisition driver +1.8% Global 2026-2035
Rising short-form and creator-generated content consumption driver +1.4% Global 2026-2032
Growing cloud gaming and game streaming adoption driver +1.0% North America, Asia-Pacific 2026-2032
Expanding connected TV device penetration in emerging markets driver +0.7% Asia-Pacific, Latin America 2026-2032
Subscription fatigue and password-sharing crackdown friction restraint −1.1% North America, Europe 2026-2030
Content licensing and production cost inflation restraint −0.8% Global 2026-2035
Regulatory scrutiny over streaming competition and content quotas restraint −0.5% Europe 2026-2032
Source: Next Move Strategy Consulting

Growth Drivers

What Is the Primary Growth Driver of the OTT Market?

Rising global smartphone and broadband penetration is the primary driver of the market. National telecommunications regulators, including the U.S. Federal Communications Commission, continue to report expanding broadband access as fixed and mobile network infrastructure investment reaches underserved populations. We observed that this connectivity expansion, reinforced by falling device costs, continues to anchor baseline OTT subscriber and viewer growth across developed and emerging economies alike.

How Is Ad-Supported Streaming Driving OTT Market Growth?

Growing adoption of ad-supported and free ad-supported television channel streaming tiers is accelerating market growth toward broader audience monetization. Our assessment indicates that platform operators increasingly launch or expand ad-supported tiers to capture price-sensitive audiences while diversifying revenue beyond subscription fees alone. This pathway, combined with rising programmatic advertising infrastructure investment, is compressing advertising revenue growth timelines across North America and Europe.

Growth Inhibitors

What Is Restraining OTT Market Expansion?

Subscription fatigue and password-sharing crackdown friction restrain subscriber growth across the OTT supply chain. We found that consumers managing multiple simultaneous subscriptions increasingly reassess spending priorities, while platform password-sharing restrictions, though designed to convert non-paying viewers, create short-term subscriber churn. Smaller platforms face particular exposure, as limited content libraries reduce their ability to retain subscribers compared with larger, content-diversified competitors, delaying sustained subscriber base expansion.

Segmentation Analysis

2025 (USD Billion)
2035 (USD Billion)
Video OTT 2025: $420.00 Billion | 2035: $2,850.00 Billion
Video OTT
Audio OTT 2025: $145.00 Billion | 2035: $980.00 Billion
Audio OTT
Communication OTT 2025: $98.75 Billion | 2035: $850.00 Billion
Communicatio
Game OTT 2025: $58.00 Billion | 2035: $508.02 Billion
Game OTT
Video OTT $420.00 Billion $2,850.00 Billion 21.1%
Audio OTT $145.00 Billion $980.00 Billion 21.0%
Communication OTT $98.75 Billion $850.00 Billion 24.0%
Game OTT $58.00 Billion $508.02 Billion 24.2%

Which Type Segment Dominates the OTT Market?

Video OTT led the market with USD 420.00 billion in 2025, supported by sustained subscriber demand for on-demand and live streaming video content. We observed that Game OTT is the fastest-growing type, expanding at a 24.2% CAGR from 2026 to 2035, as video game streaming services gain adoption among consumers seeking access to high-end gaming without dedicated hardware investment.

2025 (USD Billion)
2035 (USD Billion)
Subscription
Advertising
Programmatic
Direct-Sold
Sponsorship
Segment Item 2025 (USD Billion) 2035 (USD Billion) CAGR
Subscription Revenue $10.0 USD Billion $40.0 USD Billion 21.0%
Advertising Revenue $17.1 USD Billion $51.1 USD Billion 27.0%
Programmatic Advertising $24.2 USD Billion $62.2 USD Billion 21.0%
Direct-Sold Advertising $31.3 USD Billion $73.3 USD Billion 23.0%
Sponsorship and Branded Content $38.4 USD Billion $84.4 USD Billion 24.0%

Segment-wise data is locked

Unlock complete segment-wise numbers for By Monetization Model.

Unlock Full Data

Which Monetization Model Leads OTT Market Revenue?

Subscription Revenue remained the leading monetization model, valued at USD 385.00 billion in 2025 on sustained consumer willingness to pay for ad-free, on-demand content access. Our findings suggest that Advertising Revenue is the fastest-growing monetization model, registering a 25.9% CAGR from 2026 to 2035, as ad-supported tiers and free ad-supported television channels scale audience reach and programmatic advertising infrastructure matures.

2025 (USD Billion)
2035 (USD Billion)
General Ente
Sports
News and Fac
Creator and
Music
Segment Item 2025 (USD Billion) 2035 (USD Billion) CAGR
General Entertainment $10.0 USD Billion $40.0 USD Billion 8.0%
Sports $17.1 USD Billion $51.1 USD Billion 18.0%
News and Factual $24.2 USD Billion $62.2 USD Billion 16.0%
Creator and User-Generated Content $31.3 USD Billion $73.3 USD Billion 18.0%
Music $38.4 USD Billion $84.4 USD Billion 13.0%

Segment-wise data is locked

Unlock complete segment-wise numbers for By Content Category.

Unlock Full Data

Which Content Category Is Most Widely Consumed in the OTT Market?

General Entertainment remained the dominant content category, reaching USD 240.00 billion in 2025 due to sustained demand for scripted series, films, and broad-appeal programming. Based on research conducted by NMSC, we found that Creator and User-Generated Content is the fastest-growing content category at a 27.3% CAGR from 2026 to 2035, reflecting rapid audience migration toward short-form, creator-produced content across major platforms.

2025 (USD Billion)
2035 (USD Billion)
Consumers
Individuals
Households
Advertisers
Brands
Segment Item 2025 (USD Billion) 2035 (USD Billion) CAGR
Consumers $10.0 USD Billion $40.0 USD Billion 14.0%
Individuals $17.1 USD Billion $51.1 USD Billion 16.0%
Households $24.2 USD Billion $62.2 USD Billion 14.0%
Advertisers $31.3 USD Billion $73.3 USD Billion 20.0%
Brands $38.4 USD Billion $84.4 USD Billion 19.0%

Segment-wise data is locked

Unlock complete segment-wise numbers for By Customer Type.

Unlock Full Data
2025 (USD Billion)
2035 (USD Billion)
Direct
OTT Website
OTT Applicat
App Marketpl
Connected TV
Segment Item 2025 (USD Billion) 2035 (USD Billion) CAGR
Direct $10.0 USD Billion $40.0 USD Billion 8.0%
OTT Website $17.1 USD Billion $51.1 USD Billion 10.0%
OTT Application $24.2 USD Billion $62.2 USD Billion 20.0%
App Marketplace $31.3 USD Billion $73.3 USD Billion 10.0%
Connected TV Platform $38.4 USD Billion $84.4 USD Billion 25.0%

Segment-wise data is locked

Unlock complete segment-wise numbers for By Distribution Channel.

Unlock Full Data
2025 (USD Billion)
2035 (USD Billion)
Smartphone a
Smart TV and
Personal Com
Gaming Conso
Other Connec
Segment Item 2025 (USD Billion) 2035 (USD Billion) CAGR
Smartphone and Tablet $10.0 USD Billion $40.0 USD Billion 11.0%
Smart TV and Streaming Device $17.1 USD Billion $51.1 USD Billion 25.0%
Personal Computer $24.2 USD Billion $62.2 USD Billion 11.0%
Gaming Console $31.3 USD Billion $73.3 USD Billion 13.0%
Other Connected Device $38.4 USD Billion $84.4 USD Billion 10.0%

Segment-wise data is locked

Unlock complete segment-wise numbers for By End Device.

Unlock Full Data

Growth Opportunities

Our analysis shows that three forward-looking opportunities stand out for stakeholders positioning within the OTT market over the 2026-2035 forecast period.

How Can Bundled Monetization Models Unlock Value for Platform Operators?

Bundled subscription, advertising, and transactional monetization models present a whitespace opportunity for platform operators seeking to maximize average revenue per user. Suppliers that commercialize flexible, tiered monetization architectures stand to capture incremental advertising and transactional revenue as consumers migrate between ad-free and ad-supported access levels based on price sensitivity.

Where Does Live Sports and Event Streaming Create New Demand?

Sports leagues and rights holders seeking expanded digital distribution create an opportunity for OTT platforms offering premium live event streaming capability. Early movers that secure exclusive regional or global sports rights can differentiate with subscribers pursuing appointment-viewing content unavailable through traditional broadcast alternatives.

How Can Creator Monetization Tools Expand Platform Content Libraries?

Independent content creators seeking sustainable monetization create an underpenetrated opportunity for platforms offering revenue-sharing and audio and video production tools. Suppliers that develop validated creator monetization infrastructure can secure long-term content partnerships, benefiting from recurring content supply tied to expanding creator economy participation.

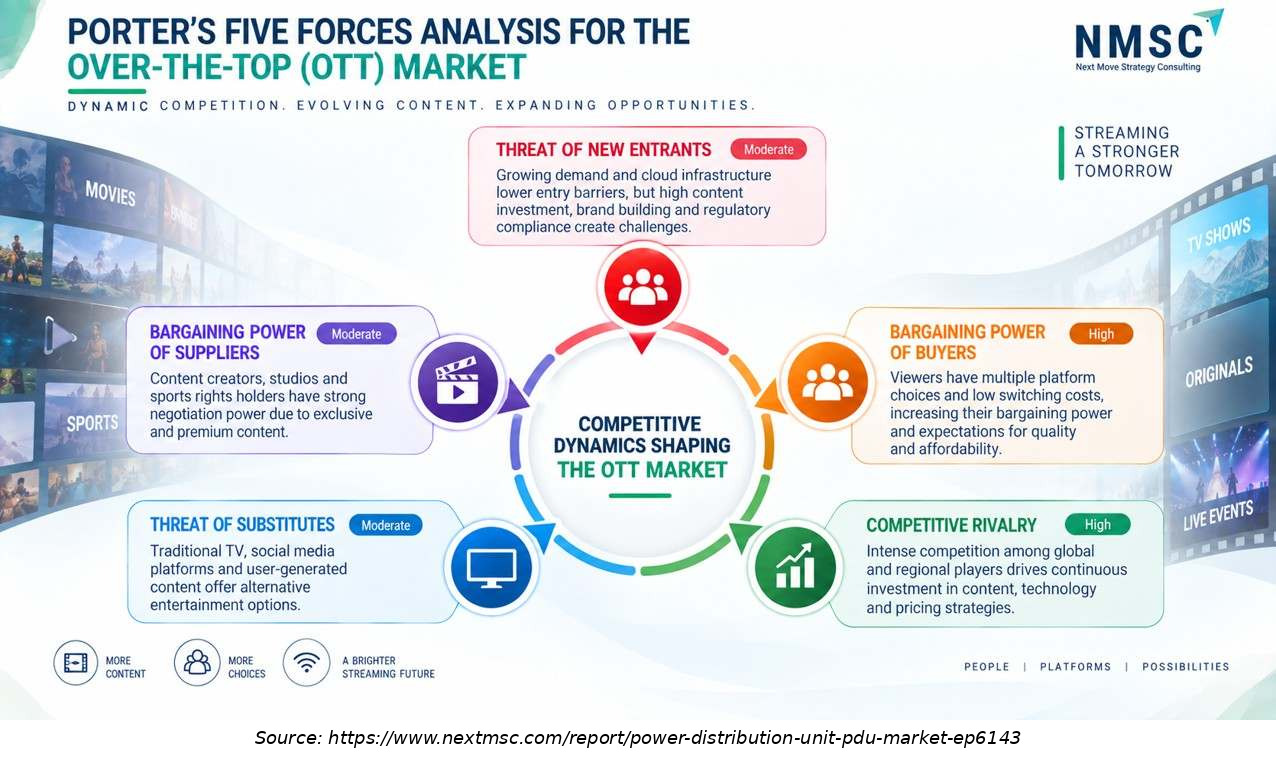
Porter’s Five Forces Analysis for the Over-The-Top (Ott) Market

The infographic presents a Porter’s Five Forces analysis of the Over-the-Top (OTT) Market, highlighting the competitive dynamics shaping the streaming industry. It examines the threat of new entrants, bargaining power of suppliers and buyers, threat of substitutes, and competitive rivalry. The analysis emphasizes content ownership, platform choices, switching costs, technological investment, pricing strategies, and competition among global and regional OTT providers.

Regional Outlook

2025 (USD Billion)
2035 (USD Billion)
North Americ
Europe
Asia-Pacific
Middle East
Latin Americ
Region 2025 (USD Billion) 2035 (USD Billion) CAGR (%)
North America $10.0 USD Billion $40.0 USD Billion 9.0%
Europe $17.1 USD Billion $51.1 USD Billion 27.0%
Asia-Pacific $24.2 USD Billion $62.2 USD Billion 25.0%
Middle East & Africa $31.3 USD Billion $73.3 USD Billion 23.0%
Latin America $38.4 USD Billion $84.4 USD Billion 12.0%

Regional data is locked

Unlock complete regional numbers for this market.

Unlock Full Data

Competitive Landscape

We observed that the OTT market features a moderately consolidated competitive landscape, with diversified technology and media conglomerates competing alongside specialized streaming and regional platform operators on content library breadth, monetization flexibility, and distribution reach.

Dimension Description
Market Structure Moderately consolidated; a small number of platform operators such as Netflix, Amazon, and The Walt Disney Company account for a significant share of global OTT market revenue, while regional platforms serve localized language and content markets.
Innovation Focus Ad-supported tier expansion, live sports and event streaming, and connected TV advertising infrastructure dominate current innovation pipelines across leading suppliers.
M&A Activity Content and distribution consolidation, exemplified by the merger forming Paramount Skydance Corporation and continued portfolio management at Warner Bros. Discovery.

How Do Companies Compete in the OTT Market?

Companies compete primarily on content library breadth, monetization flexibility, and distribution reach across the industry. Global platforms such as Netflix and Amazon leverage broad content investment and bundled monetization models to serve multinational subscriber bases, while regional platforms such as iQIYI and Zee Entertainment Enterprises compete on local-language content depth and cultural relevance for domestic audiences.

Which Competitive Archetypes Dominate the OTT Market?

Two archetypes dominate the market: diversified technology and media conglomerates offering integrated content, advertising, and device ecosystems, and regionally focused platforms serving local-language content markets. The Walt Disney Company and Amazon.com exemplify the diversified archetype through vertically integrated content, advertising, and device portfolios, while iQIYI and Zee Entertainment Enterprises exemplify the regional-specialist archetype serving domestic language and cultural content demand.

How Are Companies Differentiating Through Innovation in OTT Streaming?

Innovation and differentiation strategy increasingly center on ad-supported monetization and live content capability. Amazon's ad-supported Prime Video default tier and Netflix's expanding live sports and event programming both extend platform monetization and retention capability into new territory. Our analysis shows that platforms unable to demonstrate credible advertising infrastructure and live content capability risk losing subscriber and advertiser share as monetization sophistication increases across the industry.

What M&A and Expansion Activity Is Shaping the OTT Market?

Content and distribution consolidation continue to shape the competitive landscape within the industry. The merger forming Paramount Skydance Corporation, alongside Warner Bros. Discovery's continued content portfolio management, illustrates how media conglomerates pursue scale and content library breadth to compete with technology-native platforms such as Netflix and Amazon across subscription, advertising, and live event distribution channels.

Key Market Players

Our assessment indicates that the following 20 companies are actively shaping content investment, monetization strategy, and distribution reach within the global OTT market.

Alphabet Inc. Netflix, Inc. The Walt Disney Company Amazon.com, Inc. Spotify Technology S.A. Paramount Skydance Corporation Warner Bros. Discovery, Inc. Comcast Corporation ByteDance Ltd. Apple Inc. Tencent Holdings Limited Roku, Inc. iQIYI, Inc. Sony Group Corporation CANAL+ SA Bilibili Inc. DAZN Group Limited Viaplay Group AB Zee Entertainment Enterprises Limited MBC Group

Latest Developments

We found that recent developments within the OTT market are concentrated on ad-supported tier expansion and live content investment, reflecting the industry's broader monetization diversification transition.

Date Event
Sep 2026 Spotify expanded its Partner Program to more than 35 new markets, including Italy, Spain, Brazil, Mexico, Colombia, and other countries. Eligible creators can earn from Premium video engagement and advertising, while participating Premium video podcasts receive fewer dynamic ads, extending Spotify’s video podcast model across a broader international audience.
Sep 2026 Apple expanded iCloud+ in India to include Apple TV and Apple Arcade at no additional cost for subscribers. The change creates a new bundled route to Apple’s streaming service in India, potentially broadening household access to Apple TV content while replacing Apple One for new Indian subscribers.

Investment Opportunities

What Capital Inflows Are Targeting the OTT Market?

Capital inflows into the OTT market are increasingly directed toward live sports rights acquisition and ad-supported infrastructure development. Platform operators continue to fund content and technology investment, as seen in the merger forming Paramount Skydance Corporation and continued live sports programming expansion at Netflix and Amazon. We observed that investors favor platforms demonstrating validated monetization diversification, viewing advertising infrastructure maturity as a proxy for long-term subscriber and revenue growth.

How Is Infrastructure Investment Supporting OTT Platform Distribution?

Infrastructure investment is expanding connected TV advertising and content delivery capacity to serve rising global streaming demand. Platforms are scaling programmatic advertising and dynamic ad insertion infrastructure to support both subscription and ad-supported tier monetization. Our findings suggest that regional platforms are investing in localized content delivery infrastructure to improve streaming quality for emerging market consumers with variable broadband connectivity.

What ESG Considerations Are Shaping OTT Investment Decisions?

Environmental, social, and governance considerations are increasingly relevant to investment decisions across the industry, with content diversity and responsible advertising practices as leading criteria. Regulatory bodies continue to shape platform accountability expectations that inform content and advertising governance practices. We found that investors increasingly favor platforms with transparent content moderation and advertising disclosure practices, treating it as a governance indicator alongside subscriber data privacy compliance.

Key Benefits for Stakeholders

How Does This Report Benefit Enterprise and Industry Leaders?

Enterprise and industry leaders gain access to validated segmentation, competitive benchmarking, and regional demand forecasts that support content and monetization decisions across the OTT industry. Our analysis shows that detailed type, monetization-model, and content-category breakdowns help platform operators align investment priorities with audience demand and advertiser requirements while identifying underserved segments for portfolio expansion.

How Does This Report Benefit Investors and Financial Analysts?

Investors and financial analysts benefit from consistent, single-point market size and CAGR estimates that support valuation and capital-allocation decisions across the OTT supply chain. We observed that the report's regional and segment-level growth differentials help identify which platform operators are best positioned to capture above-market growth in advertising revenue and Asia-Pacific categories through 2035.

How Does This Report Benefit Technology Vendors and Product Teams?

Technology vendors and product teams gain insight into emerging design requirements, including ad-supported infrastructure, live streaming capability, and connected TV optimization, that are reshaping the industry. Our findings suggest that this analysis helps R&D teams prioritize development roadmaps around advertising technology and content recommendation systems increasingly required by platform operator and advertiser procurement processes.

Key Market Segments Evaluated

By Type

  • Video OTT 
    • On-Demand Video
    • Linear Channel Streaming
    • Live Event Streaming
  • Audio OTT 
    • On-Demand Audio
    • Linear Audio Streaming
    • Live Audio Events
  • Game OTT 
    • Game Streaming
  • Communication OTT 
    • Messaging
    • Voice Communication
    • Video Communication

By Monetization Model

  • Subscription Revenue
  • Advertising Revenue 
    • Programmatic Advertising
    • Direct-Sold Advertising
    • Sponsorship and Branded Content
    • Other Advertising
  • Transactional Revenue 
    • Digital Rental
    • Digital Purchase
    • Pay-Per-View
  • Distribution Revenue 
    • Subscription Distribution
    • Transaction Distribution
    • OTT Aggregation

By Content Category

  • General Entertainment
  • Sports
  • News and Factual
  • Creator and User-Generated Content
  • Music
  • Podcasts and Spoken Audio
  • Audiobooks
  • Games
  • Communication
  • Other Content

By Customer Type

  • Consumers 
    • Individuals
    • Households
  • Advertisers 
    • Brands
    • Agencies
    • Merchants
  • Business and Institutional Customers 
    • Enterprises
    • Hospitality
    • Transport Operators
    • Other Institutions

By Distribution Channel

  • Direct 
    • OTT Website
    • OTT Application
  • App Marketplace
  • Connected TV Platform
  • Telecom Bundle
  • Third-Party Aggregator

By End Device

  • Smartphone and Tablet
  • Smart TV and Streaming Device
  • Personal Computer
  • Gaming Console
  • Other Connected Device

By Region

  • North America 
    • U.S.
    • Canada
    • Mexico
  • Europe 
    • UK
    • Germany
    • France
    • Italy
    • Spain
    • Sweden
    • Denmark
    • Finland
    • Netherlands
    • Rest of Europe
  • Asia-Pacific 
    • China
    • India
    • Japan
    • South Korea
    • Taiwan
    • Indonesia
    • Vietnam
    • Australia
    • Philippines
    • Malaysia
    • Rest of APAC
  • Middle East & Africa 
    • Saudi Arabia
    • UAE
    • Egypt
    • Israel
    • Turkey
    • Nigeria
    • South Africa
    • Rest of MEA
  • Latin America 
    • Brazil
    • Argentina
    • Chile
    • Colombia
    • Rest of LATAM

Conclusion & Recommendations

The long-term outlook for the market remains positive, with global revenue projected to expand from USD 721.75 billion in 2025 to USD 5188.02 billion by 2035 at an 18% CAGR. We observed that ad-supported tier expansion, live sports investment, and creator content growth will continue underpinning demand across video, audio, game, and communication applications through the forecast period.

What Strategic Positioning Should OTT Suppliers Pursue?

Suppliers should prioritize bundled monetization architectures while pursuing live content and creator partnership capability to secure long-term subscriber and advertiser relationships. Our assessment indicates that platforms investing early in advertising infrastructure and connected TV optimization will be best positioned to capture premium pricing within the OTT market.

How Attractive Is the OTT Market for New Investment?

The OTT industry presents an attractive investment case, supported by a USD 4019.64 billion absolute dollar opportunity between 2026 and 2035 and above-average growth in Asia-Pacific and Advertising Revenue categories. We found that investment attractiveness is highest for platforms combining diversified monetization models with scaled content libraries, positioning them to serve both premium and price-sensitive subscriber segments simultaneously.

What Market Shifts and Key Risks Should Stakeholders Monitor?

Stakeholders should monitor subscription fatigue, content licensing cost inflation, and regulatory scrutiny over streaming competition as key risks to the OTT market. Our analysis shows that platforms unable to differentiate content libraries and manage production costs risk losing subscriber share to competitors with broader monetization diversification, particularly as consumers reassess multiple simultaneous subscription commitments.

What Are the Key Growth Pathways for the OTT Market?

Key growth pathways include scaling ad-supported infrastructure, expanding live sports and event content investment, and deepening penetration into Asia-Pacific and creator content categories. NMSC's analysis indicates that suppliers pursuing these pathways while maintaining content library competitiveness in general entertainment will be best positioned to capture the OTT market's projected growth through 2035.

FAQs

About the Author

Mayurima Roy

Mayurima Roy

Mayurima Roy is Research Analyst at Next Move Strategy Consulting, where she has spent 4 years working across the firm's full industry coverage rather than a single fixed vertical. Her work centers on structured research, ongoing trend tracking, competitive assessment, and insight-led content development, translating complex market data into clear, decision-ready narratives that support informed client decision-making across diverse global industries, market sectors, and world regions every day.

About the Reviewer

Supradip Baul

Supradip Baul

Supradip Baul is an accomplished business consultant and strategist with over a decade of rich experience in market intelligence, strategy, technology, and business transformation. His work has included rigorous qualitative and quantitative analysis across multiple industries, helping clients shape investment decisions and long-term roadmaps. Earlier in his career, he was associated with Gartner, where he contributed to industry-leading reports and market share analyses. He has worked with leading global companies and holds an MBA with a dual specialization in Marketing and Finance.

Download Free Sample

Ross J Mckenzie

ROSS J MCKENZIE

Business Insight Manager

Staysure Group

“Next MSC have been incredibly helpful in providing detailed & robust information on our market, alongside quantifying growth by different segments. The process to procure was simple and easy, with sample reports and regular contact to ensure we had what we needed. Succinct detail on their sources & methodologies is also greatly received, allowing transparency in this respect helps build trust in the detail you pay for. Joseph in particular was fantastic, and helped ensure efficient provision of the insight pack – thank you NMSC!”.

Rishabh Jogani

RISHABH JOGANI

Strategy Analyst

Accenture Japan

We are incredibly impressed with the market report on the real estate market in India provided by Next Move Strategy Consulting. The report was thorough, insightful, and well-structured, offering deep analysis and actionable recommendations. It not only captured the current trends and dynamics but also provided a forward-looking perspective that has been invaluable for our strategic planning. Their team demonstrated exceptional professionalism, attention to detail, and a profound understanding of the industry. The data-driven insights and clarity of presentation exceeded our expectations, making complex market trends easy to understand. We highly recommend Next Move Strategy Consulting to anyone looking for reliable and comprehensive market research services. Their expertise has given us the confidence to navigate the complexities of the Indian real estate market with clarity and foresight.

Robert Sean Trevino

ROBERT SEAN TREVINO

Sr. Director, Head of Strategic Insights & Analytics

Foundation Medicine

I realized that it was a reliable source of information. These days, there are many people who are looking for authentic data, and this is one of the only sources that can offer them with what they need;

Diana Trejo

DIANA TREJO

Assistant Manager

Sumitomo Corporation de Mexico, S.A. de C.V.

Recently, we purchased a report on the Mexico Data Center Market from Next Move Strategy Consulting. The service has been excellent, with support that is always timely and thoroughly professional. The information provided is interesting, highly useful, and delivered with clarity. I would highly recommend NextMSC for anyone seeking insightful and dependable analysis.

Semih Kavaklioglu

SEMIH KAVAKLIOGLU

Co-Founder & Sales Manager

Decortie

I work a lot in the marketing industry and I know that research is an essential part of any campaign. I have used Market research reports for my own products and I found them to be very informative and well-researched. The team here produces insightful reports for a good price

Custom Market Research Services

We will customize the research for you if the listed report does not fully match your requirements.

Get 30% Free Customization

Select License

This website uses cookies to ensure you get the best experience on our website. Learn more

✖