Radar Market

Radar Market size was USD 48.65 Billion in 2025, projected to reach USD 90.89 Billion by 2035, growing at a CAGR of 6.20% from 2026 to 2035. Key drivers include defense modernization, automotive radar adoption, NATO defense spending, counter-drone security investment, and growing border and maritime surveillance demand, with Asia-Pacific leading the market.

Download Free Sample PDF
Base Year (2025)
$48.65 Billion
Forecast (2035)
$90.89 Billion
CAGR (2026-2035)
6.2%
Top Region
North America

What Is the Radar Market Size?

The global radar market size was valued at USD 48.65 billion in 2025 and is estimated at USD 52.87 billion in 2026, forecast to reach USD 90.89 billion by 2035, expanding at a 6.20% CAGR between 2026 and 2035. North America leads with approximately 38% share, while defense radar dominates all other applications with approximately 40% share.

We observed that growth is broad-based across every segmentation axis, with automotive radar adoption and digital radar processing driving the dominant structural shifts through 2035.

Radar Market Revenue Forecast

Values in USD Billion

2025 $48.65 Billion
2025
2026 $51.67 Billion
2026
2027 $54.87 Billion
2027
2028 $58.27 Billion
2028
2029 $61.88 Billion
2029
2030 $65.72 Billion
2030
2031 $69.80 Billion
2031
2032 $74.12 Billion
2032
2033 $78.72 Billion
2033
2034 $83.60 Billion
2034
2035 $90.89 Billion
2035

Key Takeaways

By Application: Defense Radar held the largest share of approximately 40% (USD 19.46 billion) in 2025; Automotive Radar is the fastest-growing sub-segment at 14.7% CAGR from 2026–2035.

By Technology: Electronically Scanned Radar held the largest share of approximately 38% (USD 18.49 billion) in 2025; Digital Radar is the fastest-growing sub-segment at 13.6% CAGR from 2026–2035.

By Waveform: Pulsed Radar held the largest share of approximately 52% (USD 25.30 billion) in 2025; Continuous Wave Radar is the fastest-growing sub-segment at 9.0% CAGR from 2026–2035.

By Frequency Band: X Band held the largest share of approximately 18% (USD 8.76 billion) in 2025; Millimeter Wave Band is the fastest-growing sub-segment at 14.7% CAGR from 2026–2035.

By Range: Medium Range held the largest share of approximately 34% (USD 16.54 billion) in 2025; Short Range is the fastest-growing sub-segment at 10.3% CAGR from 2026–2035.

By Platform: Ground Based held the largest share of approximately 32% (USD 15.57 billion) in 2025; Spaceborne is the fastest-growing sub-segment at 9.6% CAGR from 2026–2035.

By Offering: Radar Systems held the largest share of approximately 58% (USD 28.22 billion) in 2025; Radar Software is the fastest-growing sub-segment at 14.7% CAGR from 2026–2035.

By End User: Defense held the largest share of approximately 42% (USD 20.43 billion) in 2025; Automotive is the fastest-growing sub-segment at 15.5% CAGR from 2026–2035.

Dominant Region: North America dominated with approximately 38% revenue share (USD 18.48 billion) in 2025.

Fastest-Growing Region: Asia-Pacific is expected to register the highest CAGR of 9.1% during 2026–2035.

Dominant Country: U.S. led with approximately USD 15.80 billion in 2025.

Fastest-Growing Country: India is the fastest-growing country at approximately 13.0% CAGR from 2026–2035.

Market Opportunity: The radar market is expected to create an absolute dollar opportunity of USD 38.02 billion between 2026 and 2035, presenting significant investment potential across automotive, digital signal processing, and spaceborne radar platforms.

According to NMSC analysis, radar manufacturers are increasingly integrating software-defined digital processing into legacy mechanically and electronically scanned platforms, a shift that favors vendors with strong software engineering capability over hardware-only suppliers as defense and automotive customers demand upgradeable, multi-mission radar systems through 2035.

What Does the Radar Market Encompass?

The market encompasses systems, subsystems, software, and services that use radio waves to detect, track, and image objects across defense, automotive, aviation, maritime, meteorological, and industrial applications. Our assessment indicates that the scope spans mechanically scanned, electronically scanned, digital, MIMO, and passive radar technologies operating across HF through millimeter wave frequency bands, deployed on ground, vehicle, airborne, maritime, spaceborne, and fixed infrastructure platforms. The category has evolved from single-mission mechanically rotating antennas into software-defined, multi-function systems capable of simultaneous surveillance, tracking, and imaging.
Regulatory frameworks such as national spectrum allocation authorities and export control regimes shape how radar manufacturers design and commercialize systems across defense and civil markets. We observed that technology adoption is shifting toward active electronically scanned array and digital radar architectures that replace mechanically rotating antennas with solid-state beam steering. NMSC's analysis indicates that this structural shift, combined with rising automotive radar integration for driver-assistance systems, is redefining procurement priorities across the radar market.

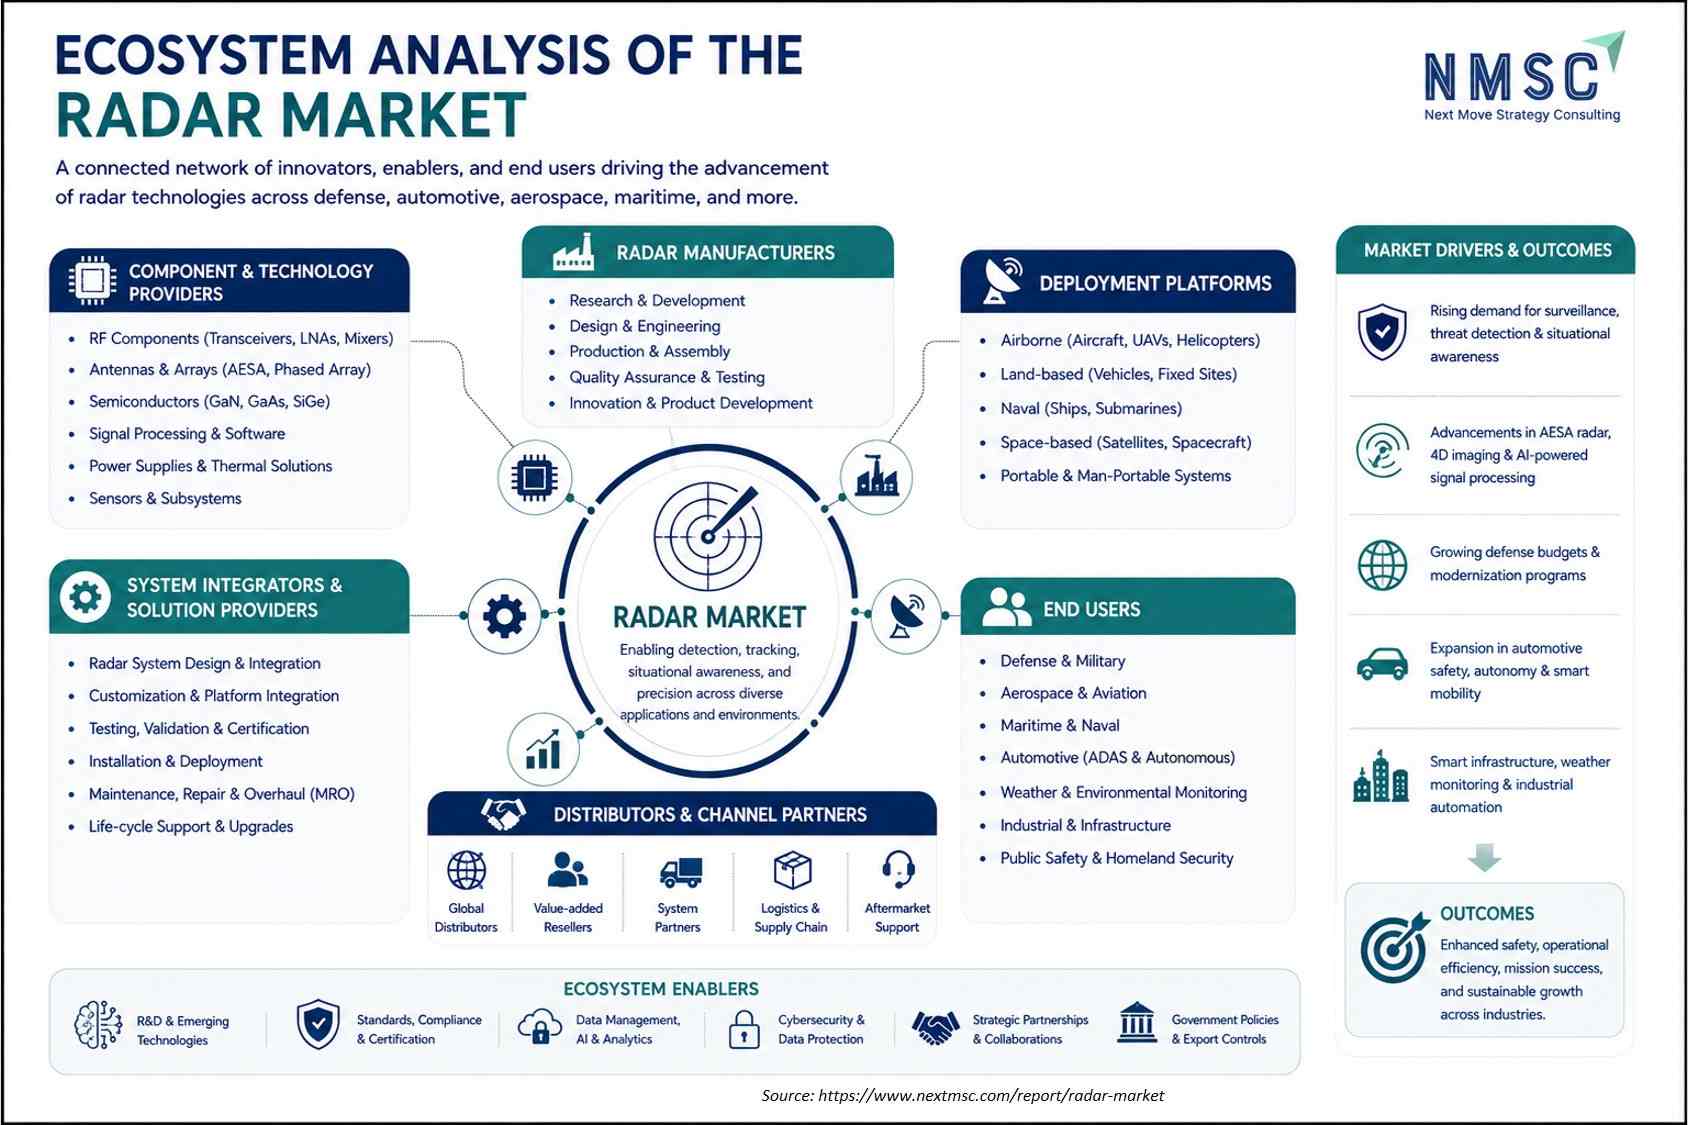
ECOSYSTEM ANALYSIS OF THE RADAR MARKET

The infographic presents the Market ecosystem, illustrating the interconnected roles of component and technology providers, radar manufacturers, system integrators, distributors, deployment platforms, and end users. It highlights key ecosystem enablers such as R&D, AI and analytics, cybersecurity, standards, partnerships, and government policies. The ecosystem is supported by growing demand for surveillance, defense modernization, advanced sensing, smart infrastructure, and automotive applications, ultimately enabling enhanced safety, operational efficiency, mission success, and business growth

Market Drivers & Dynamics

Interactive Dataset
Rising global defense modernization budgets driver +2.0% North America, Europe, Asia-Pacific 2026–2035
Expanding automotive radar adoption for driver-assistance systems driver +1.8% Global 2026–2035
Growing air and missile defense system procurement driver +1.2% North America, Middle East & Africa 2026–2035
Rising counter-drone and critical infrastructure security investment driver +0.9% Europe, North America 2026–2032
Expanding weather and air traffic radar modernization programs driver +0.7% Global 2026–2032
Growing Asia-Pacific indigenous defense manufacturing investment driver +0.9% Asia-Pacific 2026–2035
High system cost and long development cycles restraint −1.2% Global 2026–2032
Export control restrictions on advanced radar technology restraint −0.8% Global 2026–2032
Spectrum congestion and frequency allocation constraints restraint −0.5% North America, Europe 2026–2030
Source: Next Move Strategy Consulting

Growth Drivers

What Is the Primary Growth Driver of the Radar Market?

Rising global defense modernization budgets is the primary driver of the market. U.S. Department of War fiscal year 2025 appropriations continue to fund sustained investment in air and missile defense radar procurement across service branches. We observed that this budget commitment, reinforced by expanding NATO member defense spending, continues to anchor baseline investment in defense radar systems across developed and emerging defense economies alike.

How Is Automotive Radar Adoption Driving Market Growth?

Expanding automotive radar adoption for driver-assistance systems is accelerating market growth toward high-volume, cost-optimized radar sensor production. U.S. National Highway Traffic Safety Administration guidance continues to support advanced driver-assistance system adoption across new vehicle fleets. Our assessment indicates that this regulatory support, combined with rising consumer demand for automated safety features, is compressing the cost curve for millimeter wave automotive radar sensors.

Growth Inhibitors

What Is Restraining Radar Market Expansion?

High system cost and long development cycles restrain adoption among budget-constrained defense and civil customers evaluating radar procurement against competing sensor technologies. Export control restrictions under national defense trade regulations continue to limit cross-border radar technology transfer for advanced electronically scanned systems. We found that spectrum congestion further complicates frequency allocation for new radar deployments, though digital and software-defined architectures are gradually improving spectral efficiency.

Segmentation Analysis

2025 (USD Billion)
2035 (USD Billion)
Defense Radar 2025: $19.46 Billion | 2035: $29.08 Billion
Defense Rada
Aviation Radar 2025: $6.81 Billion | 2035: $11.82 Billion
Aviation Rad
Maritime Radar 2025: $5.84 Billion | 2035: $10.00 Billion
Maritime Rad
Automotive Radar 2025: $4.87 Billion | 2035: $18.18 Billion
Automotive R
Meteorological Radar 2025: $3.89 Billion | 2035: $7.27 Billion
Meteorologic
Traffic Radar 2025: $2.92 Billion | 2035: $5.45 Billion
Traffic Rada
Security Radar 2025: $1.95 Billion | 2035: $3.64 Billion
Security Rad
Industrial Radar 2025: $1.46 Billion | 2035: $2.73 Billion
Industrial R
Geospatial Radar 2025: $0.97 Billion | 2035: $1.82 Billion
Geospatial R
Others 2025: $0.48 Billion | 2035: $0.90 Billion
Others
Defense Radar $19.46 Billion $29.08 Billion 3.6%
Aviation Radar $6.81 Billion $11.82 Billion 5.3%
Maritime Radar $5.84 Billion $10.00 Billion 5.2%
Automotive Radar $4.87 Billion $18.18 Billion 14.7%
Meteorological Radar $3.89 Billion $7.27 Billion 6.2%
Traffic Radar $2.92 Billion $5.45 Billion 6.2%
Security Radar $1.95 Billion $3.64 Billion 6.2%
Industrial Radar $1.46 Billion $2.73 Billion 6.2%
Geospatial Radar $0.97 Billion $1.82 Billion 6.3%
Others $0.48 Billion $0.90 Billion 6.1%

Which Application Segment Dominates the Radar Market?

Defense Radar led the market with USD 19.46 billion in 2025, supported by sustained government procurement of air surveillance, fire control, and missile defense systems. We observed that Automotive Radar is the fastest-growing application, expanding at a 14.7% CAGR from 2026 to 2035, as automakers scale millimeter wave sensor integration to support expanding advanced driver-assistance and autonomous driving feature sets.

2025 (USD Billion)
2035 (USD Billion)
Mechanically
Electronical
Passive elec
Active elect
Digital rada
Segment Item 2025 (USD Billion) 2035 (USD Billion) CAGR
Mechanically scanned radar $10.0 USD Billion $40.0 USD Billion 25.0%
Electronically scanned radar $17.1 USD Billion $51.1 USD Billion 11.0%
Passive electronically scanned array $24.2 USD Billion $62.2 USD Billion 25.0%
Active electronically scanned array $31.3 USD Billion $73.3 USD Billion 11.0%
Digital radar $38.4 USD Billion $84.4 USD Billion 16.0%

Segment-wise data not detailed in this view

Unlock complete segment-wise numbers for By Technology.

Unlock Full Data
2025 (USD Billion)
2035 (USD Billion)
Pulsed radar
Conventional
Pulse dopple
Continuous w
Continuous w
Segment Item 2025 (USD Billion) 2035 (USD Billion) CAGR
Pulsed radar $10.0 USD Billion $40.0 USD Billion 27.0%
Conventional pulse $17.1 USD Billion $51.1 USD Billion 9.0%
Pulse doppler $24.2 USD Billion $62.2 USD Billion 19.0%
Continuous wave radar $31.3 USD Billion $73.3 USD Billion 17.0%
Continuous wave $38.4 USD Billion $84.4 USD Billion 18.0%

Segment-wise data not detailed in this view

Unlock complete segment-wise numbers for By Waveform.

Unlock Full Data
2025 (USD Billion)
2035 (USD Billion)
HF band
VHF band
UHF band
L band
S band
Segment Item 2025 (USD Billion) 2035 (USD Billion) CAGR
HF band $10.0 USD Billion $40.0 USD Billion 14.0%
VHF band $17.1 USD Billion $51.1 USD Billion 24.0%
UHF band $24.2 USD Billion $62.2 USD Billion 22.0%
L band $31.3 USD Billion $73.3 USD Billion 12.0%
S band $38.4 USD Billion $84.4 USD Billion 27.0%

Segment-wise data not detailed in this view

Unlock complete segment-wise numbers for By Frequency Band.

Unlock Full Data
2025 (USD Billion)
2035 (USD Billion)
Short range
Medium range
Long range
Very long ra
Segment Item 2025 (USD Billion) 2035 (USD Billion) CAGR
Short range $10.0 USD Billion $40.0 USD Billion 24.0%
Medium range $17.1 USD Billion $51.1 USD Billion 22.0%
Long range $24.2 USD Billion $62.2 USD Billion 20.0%
Very long range $31.3 USD Billion $73.3 USD Billion 22.0%

Segment-wise data not detailed in this view

Unlock complete segment-wise numbers for By Range.

Unlock Full Data
2025 (USD Billion)
2035 (USD Billion)
Ground Based 2025: $15.57 Billion | 2035: $23.63 Billion
Ground Based
Airborne 2025: $10.70 Billion | 2035: $18.18 Billion
Airborne
Vehicle Based 2025: $7.78 Billion | 2035: $21.81 Billion
Vehicle Base
Maritime 2025: $7.30 Billion | 2035: $11.82 Billion
Maritime
Fixed Infrastructure 2025: $4.38 Billion | 2035: $8.18 Billion
Fixed Infras
Spaceborne 2025: $2.92 Billion | 2035: $7.27 Billion
Spaceborne
Ground Based $15.57 Billion $23.63 Billion 3.8%
Airborne $10.70 Billion $18.18 Billion 5.1%
Vehicle Based $7.78 Billion $21.81 Billion 11.1%
Maritime $7.30 Billion $11.82 Billion 4.5%
Fixed Infrastructure $4.38 Billion $8.18 Billion 6.2%
Spaceborne $2.92 Billion $7.27 Billion 9.6%

Which Platform Segment Is Most Widely Adopted?

Ground Based platforms remained the dominant category across the market, reaching USD 15.57 billion in 2025 due to their established role in air surveillance, border security, and weather monitoring installations. Based on research conducted by NMSC, we found that Spaceborne platforms represent the fastest-growing category at a 9.6% CAGR from 2026 to 2035, reflecting expanding satellite-based synthetic aperture radar deployment for earth observation and reconnaissance.

2025 (USD Billion)
2035 (USD Billion)
Radar system
Surveillance
Fire control
Navigation r
Weather rada
Segment Item 2025 (USD Billion) 2035 (USD Billion) CAGR
Radar systems $10.0 USD Billion $40.0 USD Billion 21.0%
Surveillance radar $17.1 USD Billion $51.1 USD Billion 23.0%
Fire control radar $24.2 USD Billion $62.2 USD Billion 25.0%
Navigation radar $31.3 USD Billion $73.3 USD Billion 15.0%
Weather radar $38.4 USD Billion $84.4 USD Billion 16.0%

Segment-wise data not detailed in this view

Unlock complete segment-wise numbers for By Offering.

Unlock Full Data
2025 (USD Billion)
2035 (USD Billion)
Defense 2025: $20.43 Billion | 2035: $30.90 Billion
Defense
Aviation 2025: $6.81 Billion | 2035: $11.82 Billion
Aviation
Government 2025: $5.84 Billion | 2035: $10.00 Billion
Government
Maritime 2025: $4.87 Billion | 2035: $8.18 Billion
Maritime
Industrial 2025: $3.89 Billion | 2035: $7.27 Billion
Industrial
Automotive 2025: $3.89 Billion | 2035: $15.45 Billion
Automotive
Commercial 2025: $1.95 Billion | 2035: $4.55 Billion
Commercial
Healthcare 2025: $0.97 Billion | 2035: $2.72 Billion
Healthcare
Defense $20.43 Billion $30.90 Billion 3.7%
Aviation $6.81 Billion $11.82 Billion 5.3%
Government $5.84 Billion $10.00 Billion 5.2%
Maritime $4.87 Billion $8.18 Billion 5.0%
Industrial $3.89 Billion $7.27 Billion 6.2%
Automotive $3.89 Billion $15.45 Billion 15.5%
Commercial $1.95 Billion $4.55 Billion 8.9%
Healthcare $0.97 Billion $2.72 Billion 11.1%

Which End User Segment Leads Market Demand?

Defense remained the leading end user within the market, valued at USD 20.43 billion in 2025 on sustained government procurement across air, missile, and border surveillance programs. Our findings suggest that Automotive is the fastest-growing end user, registering a 15.5% CAGR from 2026 to 2035, as vehicle manufacturers integrate radar sensors across an expanding range of vehicle trims to meet safety and automation requirements.

Growth Opportunities

Our analysis shows that three forward-looking opportunities stand out for stakeholders positioning within the radar market over the 2026–2035 forecast period.

How Can Digital Radar Software Unlock Value for Legacy Fleet Operators?

Software-defined upgrade paths for legacy mechanically and electronically scanned radar present a whitespace opportunity for vendors seeking to extend fielded system lifecycles without full hardware replacement. Suppliers that scale modular software licensing stand to capture recurring revenue as defense operators prioritize capability upgrades over new-platform procurement amid budget constraints.

Where Does Spaceborne Synthetic Aperture Radar Create New Demand?

Commercial and government earth observation programs seeking all-weather, day-and-night imaging represent an underpenetrated opportunity for spaceborne radar developers. Manufacturers that secure reconnaissance satellite payload contracts can capture recurring revenue tied to expanding small satellite constellation deployment for both defense and commercial imaging customers.

How Can Asia-Pacific Defense Manufacturing Investment Benefit Regional Vendors?

Asia-Pacific governments pursuing indigenous defense manufacturing capability create an opportunity for radar vendors establishing local production and technology-transfer partnerships. Early movers that secure joint-venture manufacturing agreements in India, Japan, and South Korea can differentiate ahead of multinational competitors scaling distribution across the region's expanding defense modernization budgets.

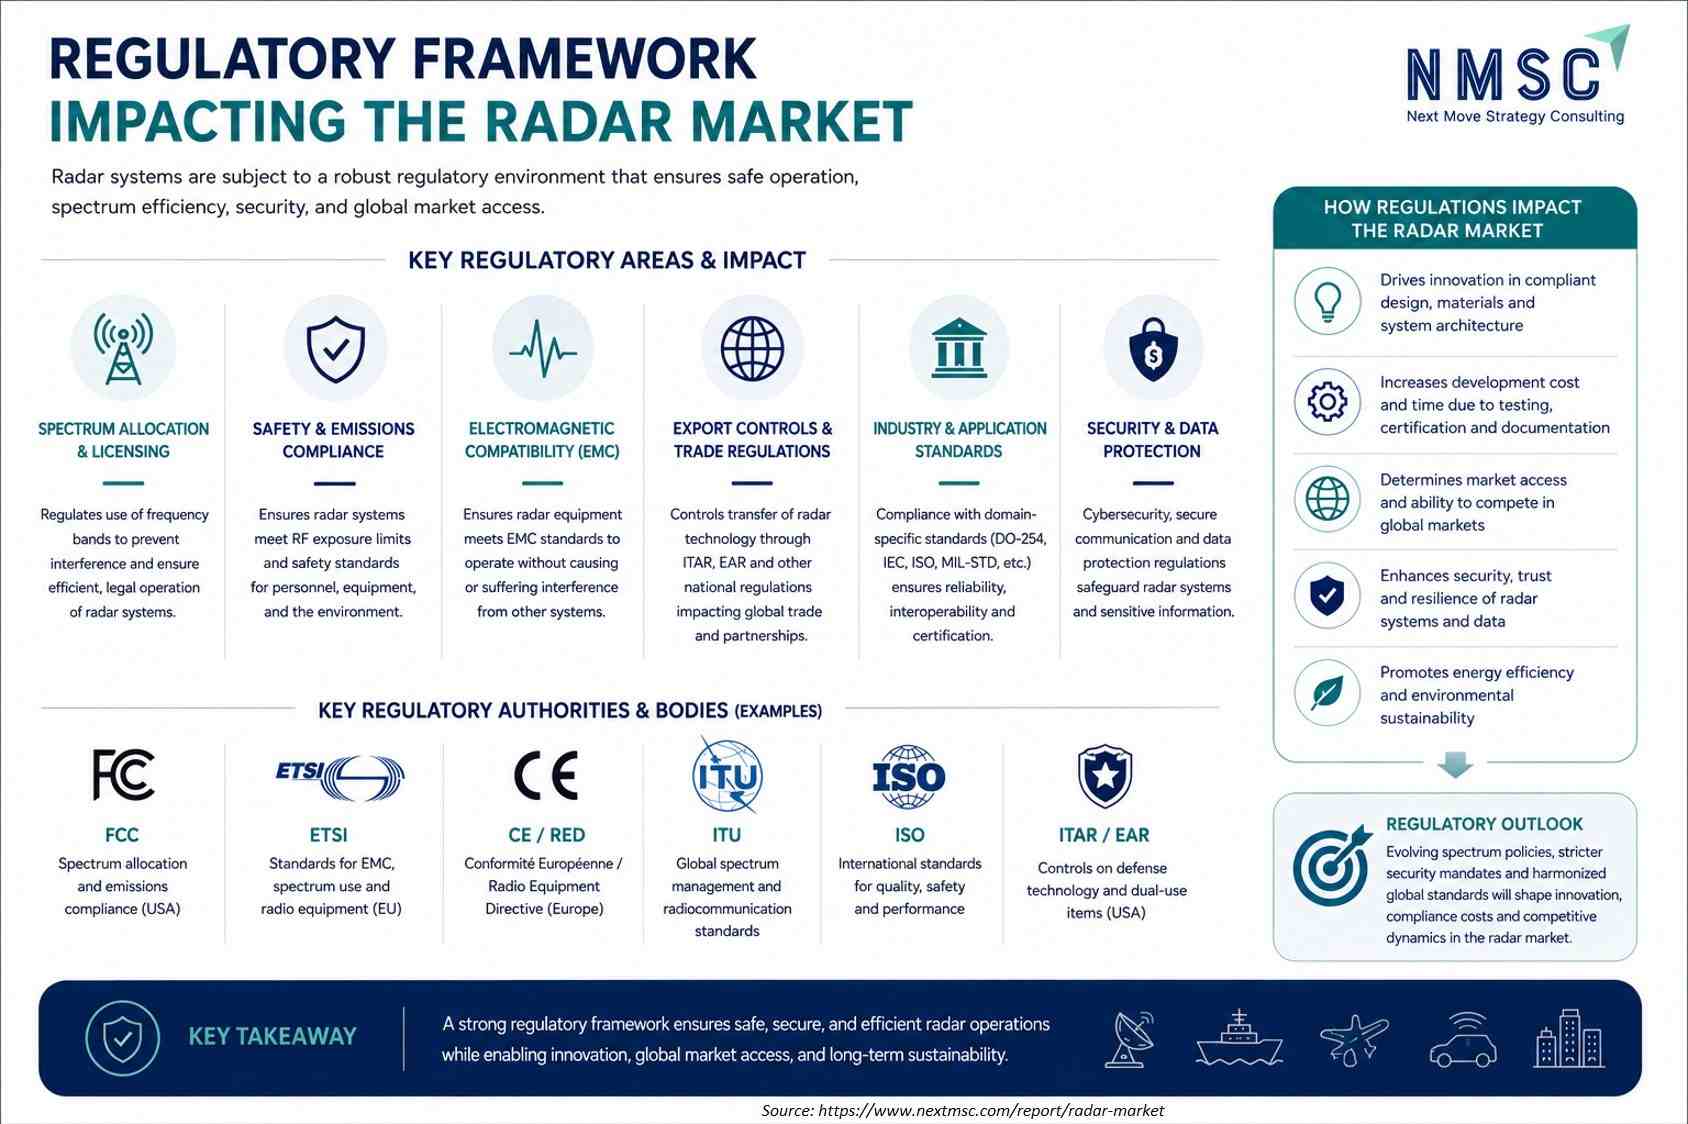
REGULATORY FRAMEWORK IMPACTING THE RADAR MARKET

The infographic outlines the regulatory framework impacting the Radar Market, emphasizing spectrum allocation, safety and emissions, electromagnetic compatibility, export controls, and industry-specific standards. It highlights the roles of regulatory bodies such as the FCC, ETSI, CE/RED, ITU, ISO, ITAR, and EAR. Regulations influence radar design, certification, costs, market access, cybersecurity, data protection, and environmental sustainability, while evolving spectrum and security requirements continue to shape innovation, compliance, and global competitiveness.

Regional Outlook

North America $18.48 Billion $29.08 Billion 5.1%
Europe $12.65 Billion $20.00 Billion 5.2%
Asia-Pacific $10.71 Billion $25.45 Billion 9.1%
Middle East & Africa $3.89 Billion $10.00 Billion 10.0%
Latin America $2.92 Billion $6.36 Billion 8.0%

Competitive Landscape

We observed that the radar market features a moderately concentrated competitive landscape, with diversified defense primes competing alongside specialized radar and electronics manufacturers on system integration depth and technology differentiation. Dimension | Details Market Structure | Moderately concentrated; the top five manufacturers, including RTX Corporation, Lockheed Martin Corporation, Northrop Grumman Corporation, Thales S.A., and Leonardo S.p.A., account for a significant share of global defense radar revenue. Innovation Focus | Digital beamforming, 4D imaging radar, and counter-drone detection systems dominate current innovation pipelines across leading manufacturers. M&A Activity | Selective capacity expansion and technology partnerships, exemplified by continued electronically scanned array production scaling among leading defense primes to meet expanding air and missile defense procurement. Source: www.nextmsc.com

Dimension Description
Market Structure Moderately concentrated; the top five manufacturers, including RTX Corporation, Lockheed Martin Corporation, Northrop Grumman Corporation, Thales S.A., and Leonardo S.p.A., account for a significant share of global defense radar revenue.
Innovation Focus Digital beamforming, 4D imaging radar, and counter-drone detection systems dominate current innovation pipelines across leading manufacturers.
M&A Activity Selective capacity expansion and technology partnerships, exemplified by continued electronically scanned array production scaling among leading defense primes to meet expanding air and missile defense procurement.

How Do Companies Compete in the Radar Market?

Companies compete primarily on system integration depth, frequency band specialization, and defense program track record across the industry. Diversified defense primes such as RTX Corporation and Lockheed Martin Corporation leverage broad program relationships and manufacturing scale to serve large national security contracts, while specialized manufacturers such as HENSOLDT AG and Saab AB compete on platform-specific engineering and regional defense partnerships.

Which Competitive Archetypes Dominate the Radar Market?

Two archetypes dominate the market: diversified defense primes offering integrated radar, missile defense, and platform systems across large national security programs, and specialized electronics manufacturers focused on regional and platform-specific radar development. RTX Corporation exemplifies the diversified archetype through its Raytheon air and missile defense radar portfolio, while Saab AB exemplifies the specialized archetype through its focused Nordic and export-market radar systems.

How Are Companies Differentiating Through Innovation in Radar?

Innovation and differentiation strategy increasingly center on digital signal processing and multi-mission system architecture. Leading manufacturers continue to invest in software-defined radar platforms capable of simultaneous surveillance, tracking, and imaging functions previously requiring separate systems. Our analysis shows that manufacturers unable to demonstrate credible digital and electronically scanned array capability risk exclusion from modern defense procurement shortlists.

What M&A and Expansion Activity Is Shaping the Radar Market?

Capacity expansion and technology partnership activity continue to shape competitive positioning within the industry. Leading defense primes continue to expand production capacity for electronically scanned array and digital radar systems to meet sustained air and missile defense procurement, while regional manufacturers pursue technology-transfer partnerships to serve growing indigenous defense manufacturing requirements across Asia-Pacific and the Middle East.

Key Market Players

Our assessment indicates that the following 16 companies are actively shaping product innovation, contract capture, and platform expansion within the global radar market.

RTX Corporation Lockheed Martin Corporation Northrop Grumman Corporation Thales S.A. Leonardo S.p.A. BAE Systems plc L3Harris Technologies, Inc. Saab AB HENSOLDT AG Elbit Systems Ltd. Israel Aerospace Industries Ltd. Indra Sistemas, S.A. Rheinmetall AG ASELSAN Elektronik Sanayi ve Ticaret A.Ş. Bharat Electronics Limited Furuno Electric Co., Ltd.

Latest Developments

We found that recent contracts and platform developments within the radar market are concentrated on air and missile defense procurement and electronically scanned array capacity expansion, reflecting the industry's modernization trajectory.

Date Event
Aug 2026 During Germany’s Timber Express 2026 exercise, HENSOLDT’s Twinvis passive radar was integrated with Rheinmetall’s Skymaster command-and-engagement system and Skynex. The demonstration fused passive radar data through NATO Link 16, showing improved air-picture generation, network resilience and potential integration into future counter-UAS architectures .
July 2026 L3Harris received an FAA contract to upgrade and operate the U.S. aircraft-tracking network through 2045. The programme covers more than 700 ground stations and expands surveillance capabilities for evolving National Airspace System users, supporting modernization of the country’s long-term airspace surveillance infrastructure .
June 2026 Indra and Rheinmetall agreed to integrate Indra’s NEMUS AESA radar into the modular StrikeShield active protection system for next-generation armored vehicles. The collaboration targets threats including drones and hypersonic projectiles, combining advanced radar sensing with vehicle protection and engagement functions .

Expert Insights

Jae-Eun Lee

Jae-Eun Lee

CEO | bitsensing

"“ 4D imaging radar is a key sensor for autonomous driving that demands both high precision and all-weather reliability.”"

Analyst Interpretation

Lee's statement highlights the transition of automotive radar from conventional object-detection sensors toward high-resolution 4D imaging radar platforms. By adding elevation information to distance, velocity and direction measurements, 4D imaging radar can provide more detailed environmental perception and improve the detection and classification of vehicles, pedestrians and road infrastructure. This capability is particularly relevant to the development of advanced driver-assistance systems (ADAS) and autonomous vehicles, where precise object perception is increasingly important. The reference to all-weather reliability also underscores a key competitive advantage of radar within multimodal vehicle perception systems. Unlike camera-based sensing, radar can maintain sensing capabilities in challenging conditions such as rain, snow and fog, making it valuable for continuous environmental awareness. The collaboration's combination of radar hardware, AI-based signal processing, sensor-fusion algorithms and automotive datasets further indicates that the market is moving toward AI-enabled, software-integrated radar systems rather than standalone radar hardware

Investment Opportunities

What Capital Inflows Are Targeting the Radar Market?

Capital inflows into the radar market are increasingly directed toward digital signal processing capability and electronically scanned array production capacity. Sustained defense prime investment in software-defined radar architecture illustrates this trend toward technology-driven capacity expansion. We observed that investors favor manufacturers demonstrating validated multi-year defense contract backlogs as a proxy for long-term revenue visibility.

How Is Infrastructure Investment Supporting Radar Market Expansion?

Infrastructure investment is expanding manufacturing and testing capacity for electronically scanned array and digital radar systems across North America, Europe, and Asia-Pacific. Our findings suggest that manufacturers are investing in automated production lines for automotive radar sensors to meet rapidly scaling driver-assistance system demand, supporting the volume production required for expanding vehicle fleet integration.

What ESG Considerations Are Shaping Radar Market Investment Decisions?

Environmental, social, and governance considerations remain secondary to national security and safety performance criteria within the industry, though energy-efficient digital processing increasingly factors into manufacturer disclosures. We found that investors increasingly favor manufacturers with transparent export compliance and defense contract governance records, treating regulatory compliance as a governance indicator alongside technical performance.

Key Benefits for Stakeholders

How Does This Report Benefit Enterprise and Industry Leaders?

Enterprise and industry leaders gain access to validated segmentation, competitive benchmarking, and regional demand forecasts that support program-investment and technology-selection decisions across the radar industry. Our analysis shows that detailed application, platform, and end-user breakdowns help program and procurement teams align specifications with digital and electronically scanned requirements while identifying underserved categories for portfolio expansion.

How Does This Report Benefit Investors and Financial Analysts?

Investors and financial analysts benefit from consistent, single-point market size and CAGR estimates that support valuation and capital-allocation decisions across the radar supply chain. We observed that the report's regional and segment-level growth differentials help identify which manufacturers are best positioned to capture above-market growth in Asia-Pacific and automotive radar categories through 2035.

How Does This Report Benefit Technology Vendors and Product Teams?

Technology vendors and product teams gain insight into emerging platform requirements, including digital beamforming, 4D imaging, and counter-drone detection capabilities, that are reshaping the industry. Our findings suggest that this analysis helps R&D teams prioritize development roadmaps around software-defined architecture and multi-mission functionality increasingly required by defense and automotive procurement processes.

Key Market Segments Evaluated

By Application

  • Defense Radar
  • Aviation Radar
  • Maritime Radar
  • Automotive Radar
  • Meteorological Radar
  • Traffic Radar
  • Security Radar
  • Industrial Radar
  • Geospatial Radar
  • Others

By Technology

  • Mechanically scanned radar
  • Electronically scanned radar
  • Passive electronically scanned array
  • Active electronically scanned array
  • Digital radar
  • MIMO radar
  • Passive radar

By Waveform

  • Pulsed radar
  • Conventional pulse
  • Pulse doppler
  • Continuous wave radar
  • Continuous wave
  • FMCW
  • Other waveforms

By Frequency Band

  • HF band
  • VHF band
  • UHF band
  • L band
  • S band
  • C band
  • X band
  • Ku band
  • K band
  • Ka band
  • Millimeter wave band

By Range

  • Short range
  • Medium range
  • Long range
  • Very long range

By Platform

  • Ground Based
  • Airborne
  • Vehicle Based
  • Maritime
  • Fixed Infrastructure
  • Spaceborne

By Offering

  • Radar systems
  • Surveillance radar
  • Fire control radar
  • Navigation radar
  • Weather radar
  • Imaging radar
  • Radar subsystems
  • Radar software
  • Radar services

By End User

  • Defense
  • Aviation
  • Government
  • Maritime
  • Industrial
  • Automotive
  • Commercial
  • Healthcare

Conclusion & Recommendations

The long-term outlook for the market remains positive, with global revenue projected to expand from USD 48.65 billion in 2025 to USD 90.89 billion by 2035 at a 6.20% CAGR. We observed that sustained defense modernization spending, automotive radar adoption, and spaceborne imaging expansion will continue underpinning demand across application categories through the forecast period.

What Strategic Positioning Should Radar Suppliers Pursue?

Suppliers should prioritize digital beamforming and software-defined architecture while pursuing automotive and spaceborne platform expansion to secure long-term contracts. Our assessment indicates that manufacturers investing early in 4D imaging and counter-drone detection capability, alongside multi-mission system design, will be best positioned to capture premium pricing within the radar market.

How Attractive Is the Radar Market for New Investment?

The radar industry presents an attractive investment case, supported by a USD 38.02 billion absolute dollar opportunity between 2026 and 2035 and above-average growth in Asia-Pacific and automotive radar categories. We found that investment attractiveness is highest for manufacturers combining validated defense contract backlogs with proven digital and electronically scanned array capability.

What Market Shifts and Key Risks Should Stakeholders Monitor?

Stakeholders should monitor high system development costs, export control restrictions, and spectrum congestion as key risks to the radar market. Our analysis shows that manufacturers unable to adapt to digital and multi-mission architecture expectations risk losing contracts to competitors with stronger software-defined capability, particularly within North America's increasingly technology-driven procurement environment.

What Are the Key Growth Pathways for the Radar Market?

Key growth pathways include expanding automotive radar sensor production, scaling spaceborne synthetic aperture radar deployment, and deepening penetration into Asia-Pacific and Middle Eastern defense channels. NMSC's analysis indicates that manufacturers pursuing these pathways while maintaining cost competitiveness in core defense radar categories will be best positioned to capture the radar market's projected growth through 2035.

FAQs

About the Author

Liza Phukan

Liza Phukan

Liza Phukan is Research Associate at Next Move Strategy Consulting, where she has covered emerging industries and market research across sectors for 3.5 years. Her work includes analyzing industry developments, validating market data, and developing structured business content from research findings. She uses secondary research and data-validation practices to turn complex market information into clear decision-useful market analysis for business audiences and support report development and B2B.

About the Reviewer

Supradip Baul

Supradip Baul

Supradip Baul is an accomplished business consultant and strategist with over a decade of rich experience in market intelligence, strategy, technology, and business transformation. His work has included rigorous qualitative and quantitative analysis across multiple industries, helping clients shape investment decisions and long-term roadmaps. Earlier in his career, he was associated with Gartner, where he contributed to industry-leading reports and market share analyses. He has worked with leading global companies and holds an MBA with a dual specialization in Marketing and Finance.

Download Free Sample

Kevin Coker

KEVIN COKER

Founder, CEO and Board Diector

Proxima Clinical Research

I have been using Next MSC reports for product positioning in a new geography for a long time. They have by far the best reports I have found and the price is reasonable too!

Gaurav Jaiswal

GAURAV JAISWAL

Founder & CEO

Yano Charge Private Limited

The EV Charging market research report provided by the NextMSC was exceptionally detailed and insightful. It offered a comprehensive analysis that proved to be a game-changer for our strategic planning. Truly a testament to the NextMSC’s expertise and thoroughness in EV market landscape & analysis.

Kishu Kanda

KISHU KANDA

Strategy Analyst

Accenture

We purchased the AI Consumer Market Report from this company. Not only did they customize the report to meet our specific requirements, but they also showed great flexibility in accommodating our budget. The report we received fully met our expectations. Additionally, they provided prompt and thorough responses to both our pre-purchase and follow-up questions. We look forward to working with this company again in the future.

Amos Chang

AMOS CHANG

Strategy Consultant

Kardex Group

I have bought the intralogistics market reports from NMSC two times so far. Joseph and his team are always very helpful and flexible in responding to any customization requirements on the report. Their expertise in market reports really helps us steer the day-to-day business. I will definitely recommend and come back myself whenever there is a need.

Semih Kavaklioglu

SEMIH KAVAKLIOGLU

Co-Founder & Sales Manager

Decortie

I work a lot in the marketing industry and I know that research is an essential part of any campaign. I have used Market research reports for my own products and I found them to be very informative and well-researched. The team here produces insightful reports for a good price

Custom Market Research Services

We will customize the research for you if the listed report does not fully match your requirements.

Get 30% Free Customization

Select License

This website uses cookies to ensure you get the best experience on our website. Learn more

✖