Reverse Logistics and Distribution Market Global Industry Analysis and Forecast (2026–2035)

The Reverse Logistics and Distribution Market is estimated at USD 42.80 Billion in 2025, rising to USD 138.60 Billion by 2035 at a 12.7% CAGR from 2026 to 2035, led by North America and driven by rising e-commerce returns, extended producer responsibility regulations, AI-enabled returns processing and EV battery recycling demand.

Download Free Sample PDF
Base Year (2025)
$42.80 Billion
Forecast (2035)
$138.60 Billion
CAGR (2026-2035)
12.7%
Top Region
North America

What Is the Reverse Logistics and Distribution Market Size?

The global reverse logistics and distribution market size was valued at USD 42.80 billion in 2025 and is estimated at USD 47.10 billion in 2026, forecast to reach USD 138.60 billion by 2035, expanding at a 12.7% CAGR between 2026 and 2035. North America leads with approximately 34% share, while Return Transportation dominates the service type landscape with approximately 24% share.

We observed that e-commerce return volumes and tightening extended producer responsibility regulation are jointly pushing brands and retailers toward outsourced, technology-enabled reverse networks.

Reverse Logistics and Distribution Market Global Industry Analysis and Forecast (2026–2035) Revenue Forecast

Values in USD Billion

2025 $42.80 Billion
2025
2026 $47.10 Billion
2026
2027 $53.08 Billion
2027
2028 $59.82 Billion
2028
2029 $67.42 Billion
2029
2030 $75.98 Billion
2030
2031 $85.63 Billion
2031
2032 $96.51 Billion
2032
2033 $108.76 Billion
2033
2034 $122.58 Billion
2034
2035 $138.60 Billion
2035

Key Takeaways

By Service Type: Return Transportation held the largest share of approximately 24% (USD 10.27 billion) in 2025; Recycling Services is the fastest-growing sub-segment at 15.8% CAGR from 2026–2035.

By Return Type: Customer Returns held the largest share of approximately 32% (USD 13.70 billion) in 2025; End-of-Life Returns is the fastest-growing sub-segment at 18.7% CAGR from 2026–2035.

By Delivery Model: Dedicated Operations held the largest share of approximately 38% (USD 16.26 billion) in 2025; Specialized Logistics is the fastest-growing sub-segment at 19.1% CAGR from 2026–2035.

By Customer Type: Retailers held the largest share of approximately 34% (USD 14.55 billion) in 2025; Service Providers is the fastest-growing sub-segment at 17.7% CAGR from 2026–2035.

By End User: Electronics held the largest share of approximately 24% (USD 10.27 billion) in 2025; Automotive is the fastest-growing sub-segment at 15.5% CAGR from 2026–2035.

Dominant Region: North America dominated with approximately 34% revenue share (USD 14.55 billion) in 2025.

Fastest-Growing Region: Asia-Pacific is expected to register the highest CAGR of 15.0% during 2026–2035.

Dominant Country: U.S. led with approximately USD 11.79 billion in 2025.

Fastest-Growing Country: India is the fastest-growing country at approximately 18.0% CAGR from 2026–2035.

Market Opportunity: The reverse logistics and distribution market is expected to create an absolute dollar opportunity of USD 91.50 billion between 2026 and 2035, presenting significant investment potential across the returns management and circular supply chain value chain.

According to NMSC analysis, contract logistics providers are increasingly bundling returns management with forward fulfillment under a single technology platform, a shift that is reshaping vendor selection criteria across the broader [fleet management system](https: //www.nextmsc.com/report/fleet-management-system-market) landscape supporting reverse transportation networks.

What Does the Reverse Logistics and Distribution Market Encompass?

The reverse logistics and distribution market encompasses the transportation, processing, recovery, and redistribution of products moving backward through the supply chain, from consumer or business returns through inspection, refurbishment, and resale or disposal. Our assessment indicates that the scope spans dedicated and multi-client operations serving manufacturers, retailers, brands, distributors, and service providers across consumer goods, electronics, automotive, healthcare, and industrial end markets, supported by the 17 companies profiled in this report.
The category has evolved from a cost-center afterthought into a value-recovery discipline as e-commerce return rates and circular economy mandates reshape retailer economics. Regulatory frameworks including the European Union's Ecodesign for Sustainable Products Regulation, whose Right to Repair provisions for household appliances and electronics enter into force on July 31, 2026, alongside the EU's Waste Electrical and Electronic Equipment Directive and Battery Regulation, continue to mandate formal take-back and recycling infrastructure. We observed that technology adoption is shifting toward AI-driven disposition and automated grading, reducing manual touches across artificial intelligence-enabled returns processing centers.

Market Drivers & Dynamics

Interactive Dataset
Rising e-commerce return volumes relative to forward fulfillment driver +3.1% Global 2026-2035
EU Ecodesign Regulation and Right to Repair enforcement driver +2.2% Europe 2026-2032
EU Battery Regulation and EV end-of-life volume growth driver +1.8% Europe, North America, Asia-Pacific 2026-2035
Contract logistics outsourcing and AI-enabled disposition adoption driver +1.6% Global 2026-2035
Extended producer responsibility expansion in Asia-Pacific driver +2.0% Asia-Pacific 2026-2035
Cross-border e-commerce return flow growth driver +1.4% Global 2026-2032
Fragmented customs and duty drawback requirements for cross-border returns restraint -1.2% Europe, Asia-Pacific 2026-2035
High labor and facility costs constraining margin in mature markets restraint -0.9% North America, Europe 2026-2032
Limited formal reverse infrastructure in emerging markets restraint -0.7% Middle East & Africa, Latin America 2028-2035
Source: Next Move Strategy Consulting

Growth Drivers

What Is the Primary Growth Driver of the Reverse Logistics and Distribution Market?

Rising e-commerce return volumes relative to forward fulfillment is the primary driver of the market. We observed that GXO Logistics, Inc. reported ecommerce revenue increasing 21% year over year in the first quarter of 2025, with customers increasingly tapping bonded warehousing and reverse logistics services to manage return-heavy categories. This behavioral shift continues to anchor baseline demand for outsourced returns processing capacity across developed and emerging e-commerce markets alike.

How Is Regulation Driving Reverse Logistics and Distribution Market Growth?

The European Union's Ecodesign for Sustainable Products Regulation is accelerating market growth by mandating Right to Repair provisions for household appliances and electronics starting July 31, 2026, alongside the Digital Product Passport and Packaging and Packaging Waste Regulation. Our assessment indicates that this regulatory convergence is compressing compliance timelines for brands, positioning providers with certified refurbishment and repair capability to capture early contract wins.

Growth Inhibitors

What Is Restraining Reverse Logistics and Distribution Market Expansion?

Fragmented customs and duty drawback requirements for cross-border returns restrain broader market expansion, particularly across Europe and Asia-Pacific where a consumer returning a product purchased from an overseas seller triggers complex re-export documentation. We found that this compliance burden adds cost and processing delay compared with domestic returns, slowing consolidation of cross-border reverse logistics networks relative to domestic operations.

What Are the Growth Opportunities?

How Can EV Battery Reverse Logistics Unlock Value for Automotive Providers?

Providers that build dedicated hazardous-materials transportation and cell-level material recovery capability ahead of the 2026-2030 EV battery end-of-life wave can capture early contracts from automotive manufacturers and component recyclers. This positions specialized battery logistics providers to secure long-term recovery agreements as EV fleets mature.

Where Does Right to Repair Compliance Create Opportunity for Electronics Brands?

Repair-integrated returns platforms present a whitespace opportunity as the European Union's Right to Repair provisions take effect for household appliances and electronics in July 2026. Providers offering certified repair and component-replacement capability stand to capture recurring compliance-driven contracts from covered electronics and appliance brands.

How Can Cross-Border Returns Consolidation Expand E-Commerce Distributor Reach?

Providers that establish bonded consolidation hubs and streamlined customs documentation for cross-border returns can capture recurring revenue from e-commerce retailers and distributors managing international order volumes. Vendors offering integrated duty drawback and re-export handling stand to capture share from fragmented regional customs processes.

Segmentation Analysis

2025 (USD Billion)
2035 (USD Billion)
Return Transportation 2025: $10.27 Billion | 2035: $27.72 Billion
Return Trans
Return Processing 2025: $9.42 Billion | 2035: $26.33 Billion
Return Proce
Product Recovery 2025: $7.70 Billion | 2035: $29.11 Billion
Product Reco
Recovery Distribution 2025: $6.42 Billion | 2035: $22.18 Billion
Recovery Dis
Recycling Services 2025: $3.85 Billion | 2035: $16.63 Billion
Recycling Se
Returns Management 2025: $3.00 Billion | 2035: $11.09 Billion
Returns Mana
Disposal Services 2025: $2.14 Billion | 2035: $5.54 Billion
Disposal Ser
Return Transportation $10.27 Billion $27.72 Billion 10.4%
Return Processing $9.42 Billion $26.33 Billion 10.8%
Product Recovery $7.70 Billion $29.11 Billion 14.2%
Recovery Distribution $6.42 Billion $22.18 Billion 13.2%
Recycling Services $3.85 Billion $16.63 Billion 15.8%
Returns Management $3.00 Billion $11.09 Billion 14.0%
Disposal Services $2.14 Billion $5.54 Billion 10.0%

Which Service Type Segment Dominates the Reverse Logistics and Distribution Market?

Return Transportation led the market with USD 10.27 billion in 2025, reflecting sustained demand for consumer collection, commercial collection, and cross-border transport of returned goods. We observed that Recycling Services is the fastest-growing service type, expanding at a 15.8% CAGR from 2026 to 2035, as electronics and battery recycling volumes scale under tightening extended producer responsibility regulation across developed markets.

2025 (USD Billion)
2035 (USD Billion)
Customer Ret
Change of Mi
Product Mism
Product Fit
Delivery Ret
Segment Item 2025 (USD Billion) 2035 (USD Billion) CAGR
Customer Returns $10.0 USD Billion $40.0 USD Billion 14.0%
Change of Mind $17.1 USD Billion $51.1 USD Billion 12.0%
Product Mismatch $24.2 USD Billion $62.2 USD Billion 18.0%
Product Fit $31.3 USD Billion $73.3 USD Billion 24.0%
Delivery Returns $38.4 USD Billion $84.4 USD Billion 23.0%

Segment-wise data is locked

Unlock complete segment-wise numbers for By Return Type.

Unlock Full Data
2025 (USD Billion)
2035 (USD Billion)
Dedicated Op
Dedicated Fa
Dedicated Ne
Dedicated Wo
Multi-Client
Segment Item 2025 (USD Billion) 2035 (USD Billion) CAGR
Dedicated Operations $10.0 USD Billion $40.0 USD Billion 11.0%
Dedicated Facility $17.1 USD Billion $51.1 USD Billion 25.0%
Dedicated Network $24.2 USD Billion $62.2 USD Billion 15.0%
Dedicated Workforce $31.3 USD Billion $73.3 USD Billion 21.0%
Multi-Client Operations $38.4 USD Billion $84.4 USD Billion 22.0%

Segment-wise data is locked

Unlock complete segment-wise numbers for By Delivery Model.

Unlock Full Data
2025 (USD Billion)
2035 (USD Billion)
Manufacturer
OEMs
Component Ma
Contract Man
Retailers
Segment Item 2025 (USD Billion) 2035 (USD Billion) CAGR
Manufacturers $10.0 USD Billion $40.0 USD Billion 12.0%
OEMs $17.1 USD Billion $51.1 USD Billion 18.0%
Component Manufacturers $24.2 USD Billion $62.2 USD Billion 16.0%
Contract Manufacturers $31.3 USD Billion $73.3 USD Billion 14.0%
Retailers $38.4 USD Billion $84.4 USD Billion 9.0%

Segment-wise data is locked

Unlock complete segment-wise numbers for By Customer Type.

Unlock Full Data

Which Customer Type Segment Is Growing Fastest in the Reverse Logistics and Distribution Market?

Retailers remained the largest customer type, valued at USD 14.55 billion in 2025 as omnichannel and e-commerce retailers continue to outsource high-volume returns processing. Our findings suggest that Service Providers is the fastest-growing customer type, registering a 17.7% CAGR from 2026 to 2035, as leasing, rental, and warranty providers increasingly rely on third-party reverse networks to manage end-of-use and end-of-life product flows.

2025 (USD Billion)
2035 (USD Billion)
Consumer Goo
Apparel
Footwear
Beauty Produ
Sporting Goo
Segment Item 2025 (USD Billion) 2035 (USD Billion) CAGR
Consumer Goods $10.0 USD Billion $40.0 USD Billion 26.0%
Apparel $17.1 USD Billion $51.1 USD Billion 16.0%
Footwear $24.2 USD Billion $62.2 USD Billion 18.0%
Beauty Products $31.3 USD Billion $73.3 USD Billion 8.0%
Sporting Goods $38.4 USD Billion $84.4 USD Billion 23.0%

Segment-wise data is locked

Unlock complete segment-wise numbers for By End User.

Unlock Full Data

Which End User Segment Is Growing Fastest in the Reverse Logistics and Distribution Market?

Electronics remained the leading end user segment, reaching USD 10.27 billion in 2025 on sustained smartphone, computer, and consumer electronics return volumes. We found that Automotive is the fastest-growing end user category, registering a 15.5% CAGR from 2026 to 2035, as EV component and battery reverse logistics volumes accelerate ahead of the first major wave of EV battery end-of-life replacements.

Growth Opportunities

Our analysis shows that three forward-looking opportunities stand out for stakeholders positioning within the reverse logistics and distribution market over the 2026-2035 forecast period.

How Can EV Battery Reverse Logistics Unlock Value for Automotive Providers?

Providers that build dedicated hazardous-materials transportation and cell-level material recovery capability ahead of the 2026-2030 EV battery end-of-life wave can capture early contracts from automotive manufacturers and component recyclers. This positions specialized battery logistics providers to secure long-term recovery agreements as EV fleets mature.

Where Does Right to Repair Compliance Create Opportunity for Electronics Brands?

Repair-integrated returns platforms present a whitespace opportunity as the European Union's Right to Repair provisions take effect for household appliances and electronics in July 2026. Providers offering certified repair and component-replacement capability stand to capture recurring compliance-driven contracts from covered electronics and appliance brands.

How Can Cross-Border Returns Consolidation Expand E-Commerce Distributor Reach?

Providers that establish bonded consolidation hubs and streamlined customs documentation for cross-border returns can capture recurring revenue from e-commerce retailers and distributors managing international order volumes. Vendors offering integrated duty drawback and re-export handling stand to capture share from fragmented regional customs processes.

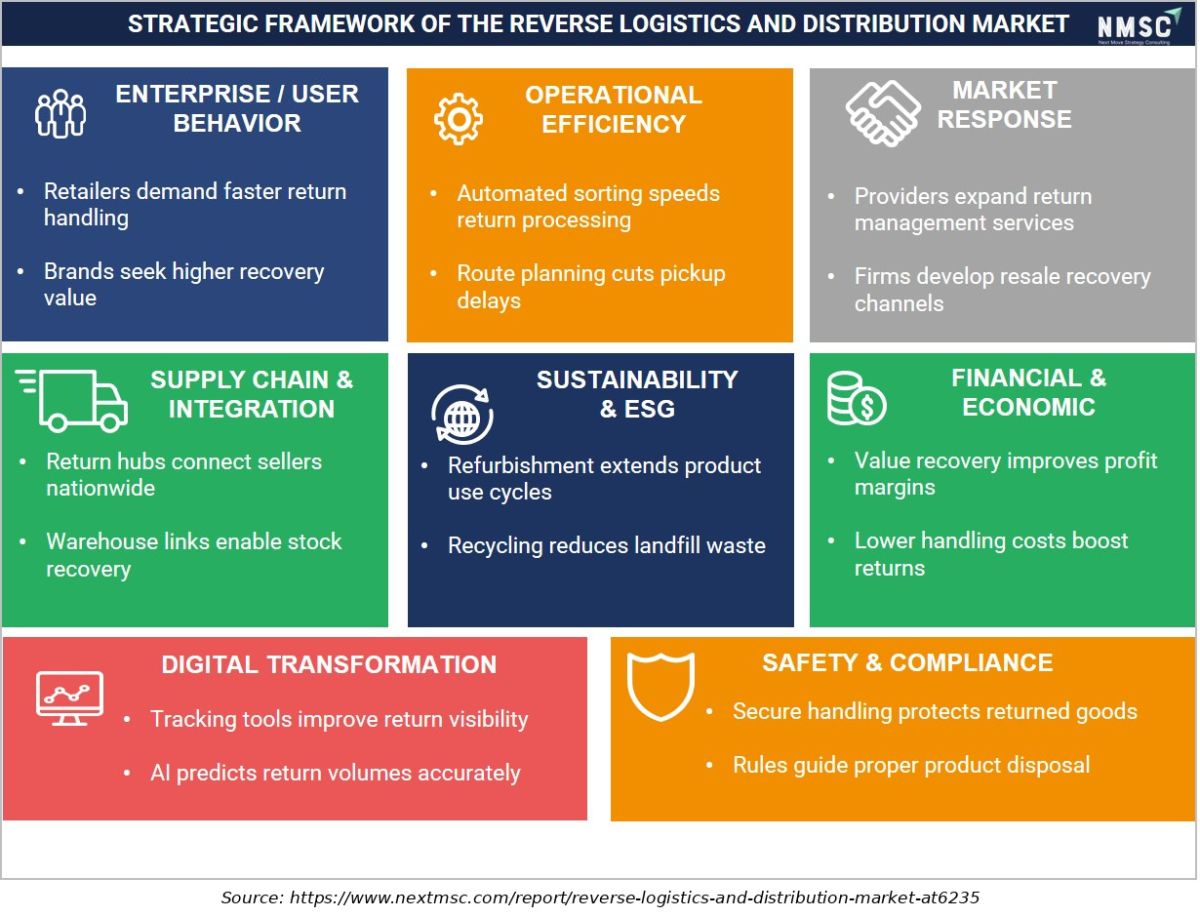
Strategic Framework of the Reverse Logistics and Distribution Market

Strategic Framework of the Reverse Logistics and Distribution Market
The strategic framework highlights the interconnected forces shaping reverse logistics and distribution, including enterprise behavior, operational efficiency, supply-chain integration, sustainability, financial outcomes, digital transformation, and compliance. Growing return volumes and recovery expectations are encouraging providers to automate sorting, improve tracking, expand refurbishment capabilities, optimize transportation, and strengthen value recovery while maintaining secure and compliant handling practices.

Regional Outlook

2025 (USD Billion)
2035 (USD Billion)
North Americ
Europe
Asia-Pacific
Middle East
Latin Americ
Region 2025 (USD Billion) 2035 (USD Billion) CAGR (%)
North America $10.0 USD Billion $40.0 USD Billion 9.0%
Europe $17.1 USD Billion $51.1 USD Billion 27.0%
Asia-Pacific $24.2 USD Billion $62.2 USD Billion 25.0%
Middle East & Africa $31.3 USD Billion $73.3 USD Billion 23.0%
Latin America $38.4 USD Billion $84.4 USD Billion 12.0%

Regional data is locked

Unlock complete regional numbers for this market.

Unlock Full Data

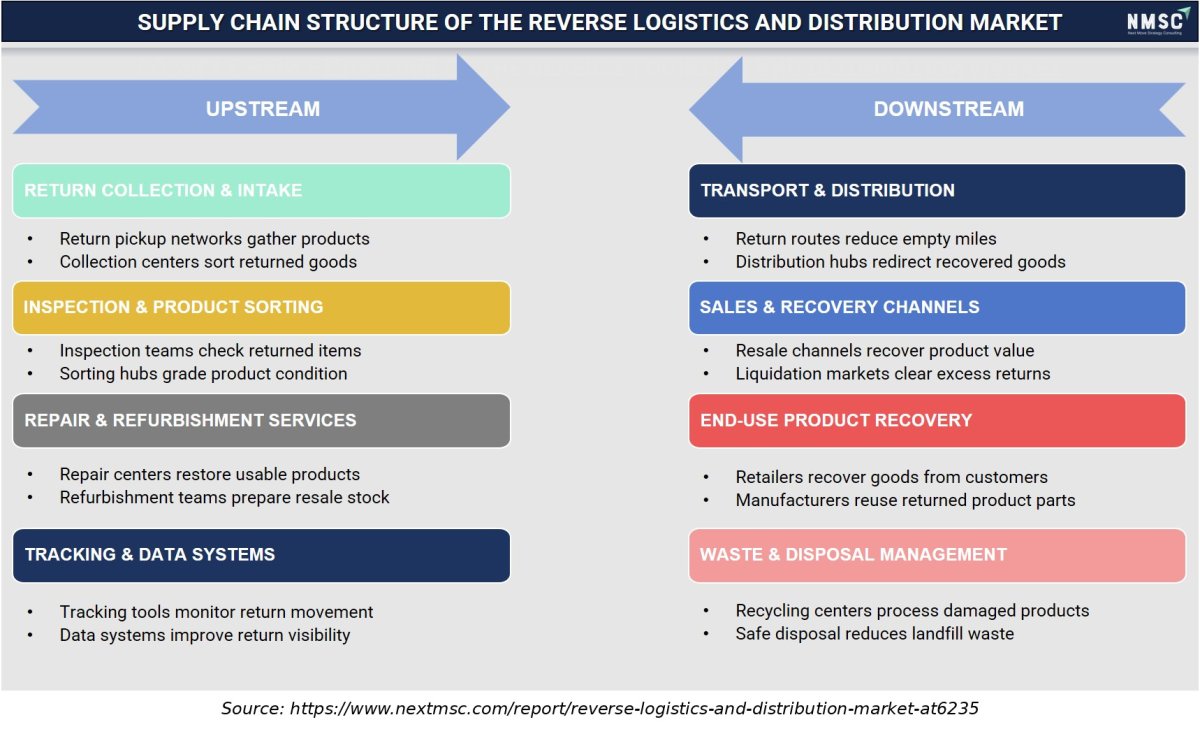
Supply Chain Structure of the Reverse Logistics and Distribution Market

Supply Chain Structure of the Reverse Logistics and Distribution Market
The reverse logistics and distribution supply chain spans return collection, inspection, sorting, repair, refurbishment, tracking, transportation, resale, product recovery, and waste management. Effective coordination across these stages enables businesses to recover product value, reduce unnecessary transportation and disposal costs, improve inventory visibility, and support circular-economy objectives through structured recovery and redistribution channels.

Competitive Landscape

We observed that the reverse logistics and distribution market features a moderately consolidated competitive landscape, with global parcel and freight integrators competing alongside contract logistics specialists and circular economy platform providers across the Industry.

Dimension Description
Market Structure Moderately consolidated; global parcel integrators and diversified contract logistics providers profiled in this report compete alongside specialized circular economy and IT asset disposition providers serving niche verticals.
Innovation Focus AI-driven disposition, automated grading, bonded cross-border consolidation, and certified refurbishment capability dominate current innovation pipelines across leading providers.
M&A Activity Selective consolidation through platform acquisitions and contract renewals, exemplified by GXO Logistics, Inc.'s pending integration of its Wincanton acquisition and its July 2026 returns management service renewal with Castorama.

How Do Companies Compete in the Reverse Logistics and Distribution Market?

Companies compete primarily on network scale, technology-enabled disposition capability, and cross-border customs expertise across the Industry. Global parcel integrators such as Deutsche Post AG and United Parcel Service, Inc. leverage extensive transportation networks to serve high-volume retail returns, while contract logistics specialists such as GXO Logistics, Inc. and DSV A/S compete on integrated warehousing and returns processing capability for large enterprise accounts.

Which Competitive Archetypes Dominate the Reverse Logistics and Distribution Market?

Three archetypes dominate the market: global parcel and freight integrators offering end-to-end transportation networks, diversified contract logistics providers bundling warehousing with returns management, and specialized circular economy and IT asset disposition providers. Deutsche Post AG and FedEx Corporation exemplify the integrator archetype, GXO Logistics, Inc. and Kuehne + Nagel International AG exemplify the contract logistics archetype, and Reconomy Group Limited and Iron Mountain Incorporated exemplify the specialized circular economy archetype.

How Are Companies Differentiating Through Innovation in Reverse Logistics?

Innovation and differentiation strategy increasingly center on AI-driven disposition and automated grading capability. GXO Logistics, Inc. exemplifies this direction through its live AI module deployment across returns processing facilities. Our analysis shows that providers unable to demonstrate technology-enabled disposition risk exclusion from large retailer procurement shortlists as e-commerce return volumes scale.

What M&A and Expansion Activity Is Shaping the Reverse Logistics and Distribution Market?

Mergers, acquisitions, and contract expansion continue to reshape competitive positioning within the Industry. GXO Logistics, Inc.'s pending integration of its Wincanton acquisition, alongside its July 2026 returns management renewal with Castorama and June 2026 transport extension with Co-op, illustrates how diversified providers pursue both inorganic scale and long-term contract renewal to secure recurring returns management revenue.

Key Market Players

Our assessment indicates that the following 17 companies are actively shaping network scale, technology adoption, and service innovation within the global reverse logistics and distribution market.

Deutsche Post AG United Parcel Service, Inc. FedEx Corporation DSV A/S CEVA Logistics SA Kuehne + Nagel International AG GXO Logistics, Inc. XPO, Inc. GEODIS SA C.H. Robinson Worldwide, Inc. Ryder System, Inc. Yusen Logistics Co., Ltd. Kintetsu World Express, Inc. Reconomy Group Limited Iron Mountain Incorporated NFI Industries, Inc. Safexpress Private Limited

Latest Developments

We found that recent activity within the reverse logistics and distribution market is concentrated on contract renewals and technology-enabled returns management expansion, reflecting the industry's broader shift toward outsourced, AI-supported reverse networks.

Date Event
April 2026 UPS and Happy Returns expanded their Return Bar network to 10,000 U.S. locations, adding more than 1,700 sites through UPS Authorized Shipping Outlets. The network enables box-free, label-free returns and supports consolidated reverse flows, faster inventory recovery and lower operational friction for retailers.
February 2026 FedEx announced enhanced Tracking+ and Returns+ tools that can be embedded within shipper-owned digital channels. The AI-powered, white-labeled capabilities improve post-purchase visibility, automate customer interactions and provide greater control over returns throughout the delivery and reverse-logistics lifecycle.
January 2026 DHL highlighted expansion of its specialized ReTurn Network following the acquisition of Inmar Supply Chain Solutions. The network operates 11 North American sites handling e-commerce returns and overstocks, with inspection, restocking, remarketing and resale capabilities designed to keep returned products in productive circulation.

Expert Insights

Katherine Cullen

Katherine Cullen

Vice President, Industry and Consumer Insights | National Retail Federation (NRF)

"Returns play an important role within the retail ecosystem and offer an additional touchpoint for retailers to provide a positive interaction with their customers. Retailers recognize the value of returns and their integration with brand loyalty, and many are prioritizing their returns capacity to ensure a seamless customer experience."

Analyst Interpretation

The statement highlights a structural transformation in the Reverse Logistics and Distribution Market, where returns management is increasingly becoming a strategic component of the customer experience rather than a post-purchase cost center. Retailers are investing in faster processing, convenient return channels, centralized return-management systems, and integrated reverse-logistics networks to improve customer retention while controlling recovery costs. This shift is increasing demand for specialized reverse-logistics services, technology platforms, return consolidation networks, and value-recovery solutions that connect returns processing with broader retail and distribution operations.

Investment Opportunities

What Capital Inflows Are Targeting the Reverse Logistics and Distribution Market?

Capital inflows into the market are increasingly directed toward AI-enabled disposition capacity and returns management contract expansion. We observed that GXO Logistics, Inc. booked USD 732 million in new revenue for 2025 and an additional USD 316 million for 2026, reflecting sustained investor confidence in outsourced, technology-forward reverse logistics infrastructure.

How Is Infrastructure Investment Supporting Reverse Logistics Expansion?

Infrastructure investment is expanding bonded warehousing and consolidation hub capacity across North America, Europe, and Asia-Pacific to serve rising cross-border return volumes. Our findings suggest that providers are investing in automated sorting and grading facilities, complementing adjacent investment in warehouse automation infrastructure supporting high-throughput returns centers.

What ESG Considerations Are Shaping Reverse Logistics and Distribution Investment Decisions?

Environmental, social, and governance considerations are central to investment decisions, with material recovery and certified recycling as key criteria for reverse logistics providers. The European Union's Battery Regulation and Waste Electrical and Electronic Equipment Directive continue to inform provider compliance roadmaps. We found that investors increasingly favor providers demonstrating measurable landfill-diversion outcomes, treating this as a governance indicator alongside traditional throughput metrics.

Key Benefits for Stakeholders

How Does This Report Benefit Enterprise and Industry Leaders?

Enterprise and industry leaders gain access to validated segmentation, competitive benchmarking, and regional demand forecasts that support sourcing and network-planning decisions across the reverse logistics and distribution industry. Our analysis shows that detailed service type, delivery model, and end user breakdowns help operations teams align provider selection with rising return volume requirements while identifying underserved segments for expansion.

How Does This Report Benefit Investors and Financial Analysts?

Investors and financial analysts benefit from consistent, single-point market size and CAGR estimates that support valuation and capital-allocation decisions across the reverse logistics and distribution supply chain. We observed that the report's regional and segment-level growth differentials help identify which providers are best positioned to capture above-market growth in Asia-Pacific and Automotive end user categories through 2035.

How Does This Report Benefit Technology Vendors and Product Teams?

Technology vendors and product teams gain insight into emerging design requirements, including AI-driven disposition, certified refurbishment, and cross-border customs automation, that are reshaping the industry. Our findings suggest that this analysis helps product teams prioritize development roadmaps around returns management platforms increasingly required by large retailer and manufacturer procurement processes.

Key Market Segments Evaluated

By Service Type

  • Return Transportation 
    • Consumer Collection
      • Residential Pickup
      • Drop-Off Collection
      • Locker Collection
    • Commercial Collection
      • Retail Consolidation
      • B2B Transport
      • Manufacturer Transport
    • Cross-Border Transport
      • Parcel Returns
      • Freight Returns
      • Customs Handling
  • Return Processing 
    • Receiving
      • Product Receiving
      • Barcode Scanning
      • RMA Processing
    • Inspection
      • Quality Inspection
      • Functional Testing
      • Condition Grading
    • Sorting
      • Restock Sorting
      • Repair Sorting
      • Recovery Sorting
      • Disposal Sorting
    • Return Warehousing
      • Short-Term Storage
      • Inventory Storage
      • Specialized Storage
  • Product Recovery 
    • Repair
      • Warranty Repair
      • Non-Warranty Repair
      • Component Replacement
    • Refurbishment
      • Cosmetic Refurbishment
      • Functional Refurbishment
      • Certified Refurbishment
    • Remanufacturing
      • Product Rebuild
      • Component Recovery
      • Parts Harvesting
    • IT Asset Processing
      • Data Erasure
      • Data Destruction
      • Asset Certification
  • Recovery Distribution 
    • Restocking
      • Retail Restocking
      • Distribution Center Restocking
      • Manufacturer Restocking
    • Secondary Distribution
      • Wholesale Distribution
      • B2B Distribution
      • E-Commerce Distribution
    • Liquidation
      • Bulk Liquidation
      • Auction Services
      • Asset Remarketing
  • Recycling Services 
    • Material Recovery
      • Electronics Recycling
      • Battery Recycling
      • Plastics Recycling
      • Textile Recycling
    • Resource Recovery
      • Component Recovery
      • Material Recovery
      • Parts Recovery
  • Disposal Services 
    • Product Destruction
      • Certified Destruction
      • Brand Protection Destruction
      • Data-Bearing Asset Destruction
    • Regulated Disposal
      • Hazardous Product Disposal
      • Non-Recoverable Product Disposal
  • Returns Management 
    • Return Authorization
      • Eligibility Processing
      • Return Approval
      • Return Routing
    • Return Administration
      • Refund Administration
      • Replacement Administration
      • Warranty Administration
    • Returns Analytics
      • Return Analytics
      • Recovery Analytics
      • Inventory Analytics

By Return Type

  • Customer Returns 
    • Change of Mind
    • Product Mismatch
    • Product Fit
  • Delivery Returns 
    • Failed Delivery
    • Refused Delivery
    • Damaged Delivery
  • Product Returns 
    • Defective Product
    • Warranty Return
    • Service Return
  • Commercial Returns 
    • Overstock Return
    • Trade Return
    • Stock Balancing
  • Recall Returns 
    • Safety Recall
    • Quality Recall
    • Regulatory Recall
  • End-of-Use Returns 
    • Lease Return
    • Rental Return
    • Trade-In Return
    • Take-Back Return
  • End-of-Life Returns 
    • Obsolete Product
    • Non-Repairable Product
    • Product Retirement

By Delivery Model

  • Dedicated Operations 
    • Dedicated Facility
    • Dedicated Network
    • Dedicated Workforce
  • Multi-Client Operations 
    • Shared Facility
    • Shared Network
    • Shared Workforce
  • Integrated Logistics 
    • Transport Integration
    • Warehouse Integration
    • End-to-End Integration
  • Specialized Logistics 
    • Technology Lifecycle
    • Healthcare Logistics
    • Automotive Logistics
    • Regulated Logistics

By Customer Type

  • Manufacturers 
    • OEMs
    • Component Manufacturers
    • Contract Manufacturers
  • Retailers 
    • Physical Retailers
    • Omnichannel Retailers
    • E-Commerce Retailers
  • Brands 
    • Consumer Brands
    • Technology Brands
    • Luxury Brands
  • Distributors 
    • Wholesale Distributors
    • Technology Distributors
    • Industrial Distributors
  • Service Providers 
    • Leasing Providers
    • Rental Providers
    • Warranty Providers

By End User

  • Consumer Goods 
    • Apparel
    • Footwear
    • Beauty Products
    • Sporting Goods
  • Electronics 
    • Smartphones
    • Computers
    • Consumer Electronics
    • Gaming Devices
  • Automotive 
    • Vehicle Components
    • Aftermarket Parts
    • EV Components
  • Healthcare 
    • Pharmaceuticals
    • Medical Devices
    • Diagnostic Equipment
  • Industrial 
    • Industrial Equipment
    • Machinery
    • Industrial Components
  • Technology 
    • IT Equipment
    • Telecom Equipment
    • Data Center Equipment
  • Food and Beverage 
    • Packaged Food
    • Beverages
    • Foodservice Products
  • Home Products 
    • Furniture
    • Appliances
    • Home Improvement Products
  • Other Industries 
    • Luxury Goods
    • Commercial Equipment
    • Other Products

By Region

  • North America 
    • U.S.
    • Canada
    • Mexico
  • Europe 
    • UK
    • Germany
    • France
    • Italy
    • Spain
    • Sweden
    • Denmark
    • Finland
    • Netherlands
    • Rest of Europe
  • Asia-Pacific 
    • China
    • India
    • Japan
    • South Korea
    • Taiwan
    • Indonesia
    • Vietnam
    • Australia
    • Philippines
    • Malaysia
    • Rest of APAC
  • Middle East & Africa 
    • Saudi Arabia
    • UAE
    • Egypt
    • Israel
    • Turkey
    • Nigeria
    • South Africa
    • Rest of MEA
  • Latin America 
    • Brazil
    • Argentina
    • Chile
    • Colombia
    • Rest of LATAM

Conclusion & Recommendations

The long-term outlook for the market remains strongly positive, with global revenue projected to expand more than threefold from USD 42.80 billion in 2025 to USD 138.60 billion by 2035 at a 12.7% CAGR. We observed that sustained e-commerce return growth, tightening extended producer responsibility regulation, and rising Asia-Pacific adoption will continue underpinning demand across retail, electronics, and automotive applications through the forecast period.

What Strategic Positioning Should Reverse Logistics and Distribution Providers Pursue?

Providers should prioritize AI-driven disposition capability and certified refurbishment infrastructure to secure long-term retailer and manufacturer contracts. Our assessment indicates that providers investing early in EV battery logistics and cross-border customs automation will be best positioned to capture premium pricing within the reverse logistics and distribution market.

How Attractive Is the Reverse Logistics and Distribution Market for New Investment?

The reverse logistics and distribution industry presents a highly attractive investment case, supported by a USD 91.50 billion absolute dollar opportunity between 2026 and 2035 and above-average growth in Asia-Pacific and Automotive end user categories. We found that investment attractiveness is highest for providers combining technology-enabled disposition with scaled network capacity, positioning them to serve both retail and manufacturer buyer segments simultaneously.

What Market Shifts and Key Risks Should Stakeholders Monitor?

Stakeholders should monitor fragmented cross-border customs requirements, high labor and facility costs in mature markets, and limited formal infrastructure in emerging markets as key risks to the reverse logistics and distribution market. Our analysis shows that providers unable to adapt to EU Ecodesign Regulation requirements risk losing contracts to competitors with certified repair and refurbishment platforms, particularly within Europe's increasingly regulated environment.

What Are the Key Growth Pathways for the Reverse Logistics and Distribution Market?

Key growth pathways include expanding AI-driven disposition portfolios, scaling EV battery and electronics recycling infrastructure, and deepening penetration into cross-border e-commerce returns consolidation. NMSC's analysis indicates that providers pursuing these pathways while maintaining cost competitiveness in mature domestic markets will be best positioned to capture the reverse logistics and distribution market's projected growth through 2035.

FAQs

About the Author

Mihul Sharma

Mihul Sharma

Mihul Sharma is Research Associate at Next Move Strategy Consulting, where he has covered technology, industrial, and healthcare markets for 3 years. His work applies structured business research, market analysis, and secondary-source review to assess market trends, competitive developments, and growth opportunities. He supports report development by fully synthesizing industry data, company information, and market signals into concise findings for strategy and investment-focused research teams.

About the Reviewer

Supradip Baul

Supradip Baul

Supradip Baul is an accomplished business consultant and strategist with over a decade of rich experience in market intelligence, strategy, technology, and business transformation. His work has included rigorous qualitative and quantitative analysis across multiple industries, helping clients shape investment decisions and long-term roadmaps. Earlier in his career, he was associated with Gartner, where he contributed to industry-leading reports and market share analyses. He has worked with leading global companies and holds an MBA with a dual specialization in Marketing and Finance.

Download Free Sample

Robert Sean Trevino

ROBERT SEAN TREVINO

Sr. Director, Head of Strategic Insights & Analytics

Foundation Medicine

I realized that it was a reliable source of information. These days, there are many people who are looking for authentic data, and this is one of the only sources that can offer them with what they need;

Pratyush Kumar Das

PRATYUSH KUMAR DAS

Assistant Manager

Polycab India Limited

We would like to express our appreciation for the data and insights provided by nextmsc. We are very pleased with the quality and depth of the information, which has proven to be highly valuable and beneficial for our business decision-making.

Mohit Agarwal

MOHIT AGARWAL

Chief Manager

DryChem India Pvt. Ltd.

Next Move Strategy Consulting is an amazing team of consultants. We required a market study report for our investors on top priority and the team went above and beyond our expectations to deliver the same with ample supporting data within a short time span enabling us to secure the investments and keep our project timeline maintained. Their professionalism, attention to detail, and timely delivery of actionable recommendations have left a lasting impression on our organization.

Diana Trejo

DIANA TREJO

Assistant Manager

Sumitomo Corporation de Mexico, S.A. de C.V.

Recently, we purchased a report on the Mexico Data Center Market from Next Move Strategy Consulting. The service has been excellent, with support that is always timely and thoroughly professional. The information provided is interesting, highly useful, and delivered with clarity. I would highly recommend NextMSC for anyone seeking insightful and dependable analysis.

Henri Knyphausen

HENRI KNYPHAUSEN

Partner at Singulier [Ex-BCG]

Singulier

I recently engaged NEXTMSC.com for a commercial due diligence project within the intralogistics sector, and I am pleased to provide a reference based on my experience. In utilizing NEXTMSC.com's services, I found their report to offer valuable insights into market dynamics and key industry players. The initial report provided a solid foundation for our analysis. However, as we were investigating a smaller target in the market, and I had specific customization requests requiring additional research. These requests included detailed information on product portfolios of various players and sub-market sizes, both inclusive and exclusive of certain product categories. NEXTMSC.com demonstrated commendable responsiveness and agility in accommodating these customization requests. Within a timeframe of 1-2 weeks, they delivered a revised report that met our specific needs. Furthermore, they were receptive to my follow-up inquiries, ensuring clarity and understanding of the data provided. The final deliverable significantly contributed to our due diligence efforts. One of NEXTMSC.com's notable strengths lies in their qualitative research capabilities. However, for future engagements, I would recommend the inclusion of a quantified market model in Excel format. Such a model would offer the ability to conduct in-depth analyses and explore various market segments, including country-specific data and subcomponent breakdowns. Based on my positive experience, I would not hesitate to work with NEXTMSC.com again. Their responsiveness, willingness to accommodate customization requests, and commitment to delivering actionable insights make them a reliable partner for commercial research projects.

Custom Market Research Services

We will customize the research for you if the listed report does not fully match your requirements.

Get 30% Free Customization

Select License

This website uses cookies to ensure you get the best experience on our website. Learn more

✖