Traction Elevator Market Global Industry Analysis and Forecast (2026–2035)

The global Traction Elevator Market size was valued at USD 28.4 billion in 2025 and is estimated at USD 29.9 billion in 2026, forecast to reach USD 51.38 billion by 2035, expanding at a 6.2% CAGR from 2026 to 2035. Key drivers include rising high-rise construction activity across Asia-Pacific and accelerating adoption of IoT-enabled predictive maintenance, with Asia-Pacific leading the global market.
Download Free Sample PDF
Base Year (2025)
$28.40 Billion
Forecast (2035)
$51.38 Billion
CAGR (2026-2035)
6.2%
Top Region
Asia-Pacific

What Is the Traction Elevator Market Size?
The global traction elevator market size was valued at USD 28.4 billion in 2025 and is estimated at USD 29.9 billion in 2026, forecast to reach USD 51.38 billion by 2035, expanding at a 6.2% CAGR between 2026 and 2035. Asia-Pacific leads with approximately 52% share, while Machine Room-Less Traction Elevators dominate all other types with approximately 63% share.

We observed that growth is broad-based across every segmentation axis, with gearless machine adoption and high-rise construction activity driving the dominant structural shifts through 2035.

Traction Elevator Market Global Industry Analysis and Forecast (2026–2035) Revenue Forecast
Values in USD Billion

2025 $28.40 Billion
2025
2026 $30.16 Billion
2026
2027 $32.03 Billion
2027
2028 $34.02 Billion
2028
2029 $36.13 Billion
2029
2030 $38.37 Billion
2030
2031 $40.74 Billion
2031
2032 $43.27 Billion
2032
2033 $45.95 Billion
2033
2034 $48.80 Billion
2034
2035 $51.38 Billion
2035

Key Takeaways

By Type: Machine Room-Less Traction Elevator held the largest share of approximately 63% (USD 17.89 billion) in 2025; Machine Room-Less Traction Elevator is also the fastest-growing type at 7.5% CAGR from 2026–2035.

By Machine Type: Gearless Traction Machine held the largest share of approximately 68% (USD 19.31 billion) in 2025; Gearless Traction Machine is also the fastest-growing machine type at 7.4% CAGR from 2026–2035.

By Capacity: 1001 to 2000 Kg held the largest share of approximately 47% (USD 13.35 billion) in 2025; Above 2000 Kg is the fastest-growing capacity band at 7.9% CAGR from 2026–2035.

By Speed: 1.0 to 2.5 MPS held the largest share of approximately 52% (USD 14.77 billion) in 2025; Above 2.5 MPS is the fastest-growing speed band at 9.3% CAGR from 2026–2035.

By Application: Residential held the largest share of approximately 41% (USD 11.64 billion) in 2025; Industrial is the fastest-growing application at 7.2% CAGR from 2026–2035.

Dominant Region: Asia-Pacific dominated with approximately 52% revenue share (USD 14.77 billion) in 2025.

Fastest-Growing Region: Latin America is expected to register the highest CAGR of 8.4% during 2026–2035.

Dominant Country: China led with approximately USD 6.50 billion in 2025.

Fastest-Growing Country: India is the fastest-growing country at approximately 9.8% CAGR from 2026–2035.

Market Opportunity: The traction elevator market is expected to create an absolute dollar opportunity of USD 21.48 billion between 2026 and 2035, presenting significant investment potential across the gearless machine and high-rise construction value chain.

According to NMSC analysis, OEMs are increasingly bundling new equipment sales with connected IoT service platforms to lock in recurring maintenance revenue, a shift that favors vendors with established digital service infrastructure over smaller regional manufacturers as building owners prioritize predictive maintenance capability alongside upfront equipment cost through 2035.

What Does the Traction Elevator Market Encompass?
The traction elevator market encompasses machine room and machine room-less elevator systems that use steel ropes or belts running over a motor-driven sheave to move a car within a hoistway, spanning residential, commercial, institutional, and industrial buildings. Our assessment indicates that the scope covers geared and gearless traction machines across multiple capacity and speed bands, supplied by original equipment manufacturers to developers, general contractors, and building owners as part of new construction and modernization projects across low-rise, mid-rise, and high-rise structures.
Regulatory frameworks such as national building and elevator safety codes shape installation and inspection requirements, while industry standards bodies continue to update guidance on energy efficiency and accessibility compliance. We observed that technology adoption is shifting from standalone mechanical systems toward IoT-connected platforms supporting predictive maintenance and remote diagnostics. NMSC's analysis indicates that this connectivity shift, combined with rising high-rise construction activity across Asia-Pacific, is redefining vendor selection criteria across the traction elevator market.

Market Drivers & Dynamics

Interactive Dataset
Rising high-rise residential and commercial construction across Asia-Pacific driver +2.6% Asia-Pacific 2026–2035
Growing demand for IoT-enabled predictive maintenance and connected service platforms driver +1.9% Global 2026–2035
Expanding urbanization and vertical construction in emerging economies driver +1.7% Middle East & Africa, Latin America 2026–2035
Rising elevator modernization spending in aging building stock driver +1.4% North America, Europe 2026–2032
Growing adoption of gearless and energy-regenerative traction machines driver +1.1% Global 2027–2035
Expanding robotic and automated installation adoption on high-rise projects driver +0.8% Asia-Pacific, Middle East & Africa 2026–2033
Rising accessibility and building code mandates requiring elevator installation driver +0.6% Europe, North America 2026–2035
Volatility in steel and copper input costs affecting equipment pricing restraint −1.2% Global 2026–2030
Extended new-construction project delays in mature developed markets restraint −0.8% North America, Europe 2026–2032
Intense pricing competition among regional manufacturers in China restraint −0.6% Asia-Pacific 2026–2033
Source: Next Move Strategy Consulting

Growth Drivers

What Is the Primary Growth Driver of the Traction Elevator Market?

Rising high-rise construction activity across Asia-Pacific is the primary driver of the market. Otis Worldwide Corporation's 2025 annual report identifies hundreds of new equipment competitors operating globally, reflecting an industry structure shaped by sustained regional construction demand, particularly across China and India's rapidly urbanizing metropolitan areas. We observed that this construction pipeline, reinforced by continued vertical densification in major cities, continues to anchor baseline demand for new traction elevator installations across residential and commercial segments.

How Is IoT-Enabled Predictive Maintenance Driving Market Growth?

IoT-enabled predictive maintenance adoption is accelerating market growth by extending OEM relationships beyond initial equipment sales into long-term recurring service contracts. Otis Worldwide Corporation's Otis ONE platform, which connects more than 900,000 elevator units for real-time monitoring, exemplifies how connected service infrastructure creates switching costs that favor established manufacturers. Our assessment indicates that this digital service expansion is compressing the gap between new equipment revenue and recurring maintenance revenue across North America, Europe, and Asia-Pacific.

Growth Inhibitors

What Is Restraining Traction Elevator Market Expansion?
Volatility in steel and copper input costs restrains broader market expansion, as traction elevator manufacturing relies heavily on structural steel components and copper-wound electric motors. Fluctuating commodity prices can compress manufacturer margins and complicate long-term project pricing for large construction contracts. We found that smaller regional manufacturers face particular exposure, as limited procurement scale makes it harder to hedge against input cost volatility compared with large, multinational elevator producers.

Segmentation Analysis

2025 (USD Billion)
2035 (USD Billion)
Machine Room-Less Traction Elevator 2025: $17.89 Billion | 2035: $35.97 Billion
Machine Room
Machine Room Traction Elevator 2025: $10.51 Billion | 2035: $15.41 Billion
Machine Room
Machine Room-Less Traction Elevator $17.89 Billion $35.97 Billion 7.5%
Machine Room Traction Elevator $10.51 Billion $15.41 Billion 3.8%

Which Type Dominates the Traction Elevator Market?

Machine Room-Less Traction Elevator led the market with USD 17.89 billion in 2025, supported by growing preference for space-efficient designs that eliminate dedicated machine rooms in mid-rise and high-rise buildings. We observed that Machine Room-Less Traction Elevator is also the fastest-growing type, expanding at a 7.5% CAGR from 2026 to 2035, as developers increasingly prioritize usable building floor area and simplified installation over traditional machine room configurations.

2025 (USD Billion)
2035 (USD Billion)
Geared Tract
Gearless Tra
Segment Item 2025 (USD Billion) 2035 (USD Billion) CAGR
Geared Traction Machine $10.0 USD Billion $40.0 USD Billion 10.0%
Gearless Traction Machine $17.1 USD Billion $51.1 USD Billion 20.0%

Segment-wise data is locked

Unlock complete segment-wise numbers for By Machine Type.

Unlock Full Data
2025 (USD Billion)
2035 (USD Billion)
Up to 1000 K
1001 to 2000
Above 2000 K
Segment Item 2025 (USD Billion) 2035 (USD Billion) CAGR
Up to 1000 Kg $10.0 USD Billion $40.0 USD Billion 14.0%
1001 to 2000 Kg $17.1 USD Billion $51.1 USD Billion 24.0%
Above 2000 Kg $24.2 USD Billion $62.2 USD Billion 14.0%

Segment-wise data is locked

Unlock complete segment-wise numbers for By Capacity.

Unlock Full Data
2025 (USD Billion)
2035 (USD Billion)
Up to 1.0 MP
1.0 to 2.5 M
Above 2.5 MP
Segment Item 2025 (USD Billion) 2035 (USD Billion) CAGR
Up to 1.0 MPS $10.0 USD Billion $40.0 USD Billion 20.0%
1.0 to 2.5 MPS $17.1 USD Billion $51.1 USD Billion 14.0%
Above 2.5 MPS $24.2 USD Billion $62.2 USD Billion 24.0%

Segment-wise data is locked

Unlock complete segment-wise numbers for By Speed.

Unlock Full Data

Which Speed Band Leads Traction Elevator Market Adoption?

The 1.0 to 2.5 MPS speed band remained the leading category, valued at USD 14.77 billion in 2025 as most mid-rise residential and commercial installations specify this standard performance range. We found that Above 2.5 MPS is the fastest-growing speed band, registering a 9.3% CAGR from 2026 to 2035, as super-tall building programs across Asia-Pacific and the Middle East increasingly require high-speed traction elevator systems for efficient vertical transportation.

2025 (USD Billion)
2035 (USD Billion)
Residential
Commercial
Institutiona
Industrial
Other Applic
Segment Item 2025 (USD Billion) 2035 (USD Billion) CAGR
Residential $10.0 USD Billion $40.0 USD Billion 18.0%
Commercial $17.1 USD Billion $51.1 USD Billion 16.0%
Institutional $24.2 USD Billion $62.2 USD Billion 22.0%
Industrial $31.3 USD Billion $73.3 USD Billion 12.0%
Other Applications $38.4 USD Billion $84.4 USD Billion 19.0%

Segment-wise data is locked

Unlock complete segment-wise numbers for By Application.

Unlock Full Data

Which Application Leads Traction Elevator Market Demand?

Residential applications remained dominant, reaching USD 11.64 billion in 2025 due to sustained high-rise and mid-rise apartment construction across rapidly urbanizing economies. Our findings suggest that Industrial is the fastest-growing application, registering a 7.2% CAGR from 2026 to 2035, as manufacturing and logistics facilities increasingly specify traction freight elevator systems for multi-level material handling and personnel access within expanding industrial and warehousing developments.

Growth Opportunities

Our analysis shows that three forward-looking opportunities stand out for stakeholders positioning within the traction elevator market over the 2026-2035 forecast period.

How Can Connected Service Platforms Unlock Recurring Revenue for OEMs?

IoT-enabled connected service platforms present a whitespace opportunity for manufacturers to convert one-time equipment sales into recurring maintenance revenue streams. Vendors that expand IoT energy management and predictive diagnostics capability stand to capture long-term service contracts as building owners prioritize uptime guarantees over lowest-cost maintenance providers.

Where Does High-Speed Elevator Demand Create New Opportunity?

Super-tall building programs across Asia-Pacific and the Middle East represent an underpenetrated opportunity for manufacturers specializing in high-speed traction systems. Vendors that develop advanced rope and guide-rail technology for speeds above 2.5 MPS can secure premium-priced contracts tied to landmark skyscraper and mixed-use tower developments.

How Can Modernization Services Expand OEM Distribution Reach?

Elevator modernization services targeting aging building stock in North America and Europe create an opportunity for manufacturers to extend beyond new equipment sales into retrofit and upgrade contracts. Early movers that bundle modernization packages with connected service platforms can differentiate against third-party maintenance providers serving only reactive repair needs.

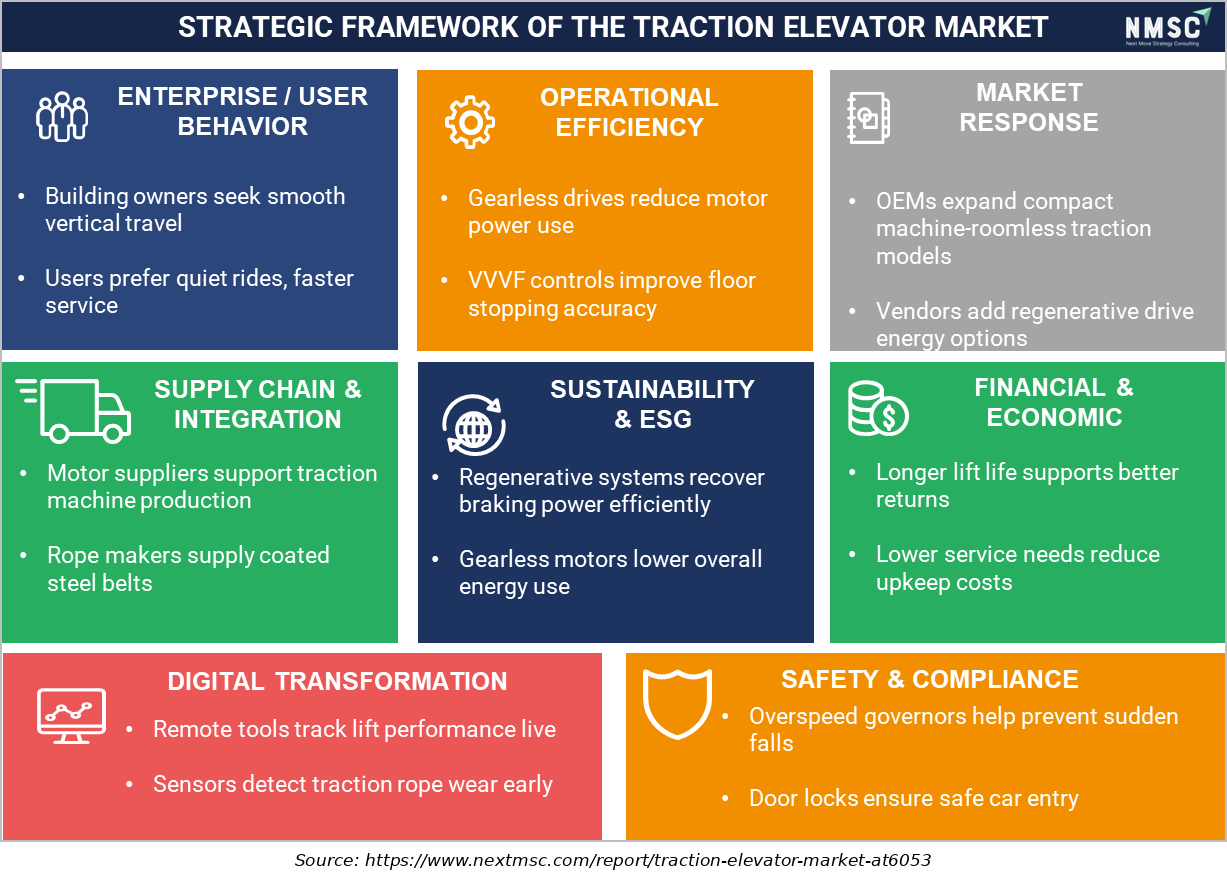
Strategic Framework of the Traction Elevator Market

Strategic Framework of the Traction Elevator Market

The traction elevator market is shaped by demand for efficient vertical transportation, reliable performance, and enhanced passenger comfort. Gearless drives and variable-frequency controls improve operational efficiency, while regenerative systems support energy recovery. Digital monitoring enables predictive maintenance, and manufacturers increasingly develop compact machine-roomless solutions. Safety systems, durable components, and modernization services further strengthen lifecycle value.

Regional Outlook

2025 (USD Billion)
2035 (USD Billion)
Asia-Pacific
Europe
North Americ
Middle East
Latin Americ
Region 2025 (USD Billion) 2035 (USD Billion) CAGR (%)
Asia-Pacific $10.0 USD Billion $40.0 USD Billion 9.0%
Europe $17.1 USD Billion $51.1 USD Billion 27.0%
North America $24.2 USD Billion $62.2 USD Billion 25.0%
Middle East & Africa $31.3 USD Billion $73.3 USD Billion 23.0%
Latin America $38.4 USD Billion $84.4 USD Billion 12.0%

Regional data is locked

Unlock complete regional numbers for this market.

Unlock Full Data

Competitive Landscape

We observed that the traction elevator market features a moderately consolidated competitive landscape, with global OEM majors competing alongside regional Asian manufacturers on connected service infrastructure, installation efficiency, and price competitiveness across the industry.

Dimension Description
Market Structure Moderately consolidated; a small group of global OEM majors hold significant installed base and service revenue, while numerous regional manufacturers, particularly in China and India, compete on price for new equipment sales.
Innovation Focus IoT-enabled predictive maintenance platforms, gearless energy-regenerative machines, and robotic installation systems dominate current innovation pipelines across leading manufacturers.
M&A Activity Selective ownership consolidation within regional joint ventures, exemplified by Otis Worldwide Corporation's October 2025 acquisition of the remaining noncontrolling shares of Otis Electric in China.

How Do Companies Compete in the Traction Elevator Market?

Companies compete primarily on connected service infrastructure, installation efficiency, and price competitiveness across the industry. Global majors such as Otis Worldwide Corporation and KONE Corporation leverage extensive installed bases and IoT platforms to secure recurring maintenance revenue, while regional Chinese and Indian manufacturers such as Canny Elevator Co., Ltd. and Johnson Lifts Private Limited compete on price and delivery speed for new equipment sales in fast-growing domestic construction markets.

Which Competitive Archetypes Dominate the Traction Elevator Market?

Two archetypes dominate the market: global OEM majors offering integrated new equipment, modernization, and connected maintenance services, and regional manufacturers offering price-competitive equipment for domestic construction demand. Otis Worldwide Corporation and Schindler Holding Ltd. exemplify the global OEM archetype through extensive digital service portfolios, while Canny Elevator Co., Ltd. and General Elevator Co., Ltd. exemplify the regional archetype through cost-focused manufacturing scale.

How Are Companies Differentiating Through Innovation in Traction Elevator Systems?

Innovation and differentiation strategy increasingly center on connected service platforms and installation automation. Otis Worldwide Corporation's Otis ONE platform and Schindler Holding Ltd.'s R.I.S.E. robotic installation system both extend competitive advantage beyond the core mechanical product into digital services and deployment efficiency. Our analysis shows that manufacturers unable to demonstrate credible IoT and predictive maintenance capability risk losing modernization and service contract renewals to more digitally advanced competitors.

What M&A and Ownership Activity Is Shaping the Traction Elevator Market?

Ownership consolidation and take-private transactions continue to shape competitive positioning within the industry. Otis Worldwide Corporation's acquisition of the remaining stake in its China joint venture Otis Electric illustrates how global manufacturers are simplifying regional ownership structures, while EQT's announced USD 2.7 billion tender offer to privatize Fujitec Co., Ltd. in 2025 reflects growing private equity interest in established elevator manufacturing platforms.

Key Market Players

Our assessment indicates that the following 20 companies are actively shaping product innovation, capacity expansion, and go-to-market strategy within the global traction elevator market.

KONE Corporation Schindler Holding Ltd. TK Elevator GmbH Mitsubishi Electric Corporation Hitachi, Ltd. Fujitec Co., Ltd. Hyundai Elevator Co., Ltd. Toshiba Elevator and Building Systems Corporation Canny Elevator Co., Ltd. Orona S. Coop. Kleemann Hellas S.A. Johnson Lifts Private Limited Escon Elevators Private Limited General Elevator Co., Ltd. Sicher Elevator Co., Ltd. Suzhou Dazen Electromechanical Technology Co., Ltd. Doppler Asansör Sanayi ve Ticaret A.Ş. Sabiem S.p.A. IFE Elevators Private Limited

Latest Developments

We found that recent product launches, capacity investments, and regulatory developments within the traction elevator market are concentrated on low-carbon formulations and expanding infrastructure demand, reflecting the industry's steady capitalization cycle.

Date Event
June 2026 TK Elevator launched EOX Rebuild for existing low-rise buildings, combining a full elevator replacement with the EOX platform’s digital and energy-efficient architecture. The traction-oriented solution supports capacities from 320–1,000kg, speeds up to 1.75m/s and travel heights to 75m while adapting to existing shafts.
April 2026 Hitachi’s Urban Ace HF Mirai went on sale in Japan in April 2026, incorporating a regenerative converter, real-time remote monitoring through the BUILLINK support tool, smartphone-authenticated non-contact elevator hailing and enhanced earthquake recovery. The elevator also integrates with BuilMirai, Hitachi’s digital building service, extending its smart-building and resilience capabilities.

Investment Opportunities

What Capital Inflows Are Targeting the Traction Elevator Market?

Capital inflows into the traction elevator market are increasingly directed toward digital service platform expansion and regional ownership consolidation. EQT's announced USD 2.7 billion tender offer to privatize Fujitec Co., Ltd. reflects growing private equity interest in established elevator manufacturing platforms with global brand equity. We observed that investors favor manufacturers demonstrating strong recurring service revenue, viewing installed base connectivity as a proxy for long-term cash flow stability.

How Is Infrastructure Investment Supporting Traction Elevator Deployment?

Government and private infrastructure investment is directly expanding demand for traction elevator deployment across high-rise residential, commercial, and transportation infrastructure projects. Our findings suggest that sustained urban construction investment across Asia-Pacific and Vision 2030-linked giga-project programs in the Middle East are supporting multi-year procurement visibility for major elevator manufacturers and their regional supply partners.

What ESG Considerations Are Shaping Traction Elevator Investment Decisions?

Environmental, social, and governance considerations are increasingly central to investment decisions across the industry, with energy efficiency and regenerative drive technology as key criteria. Manufacturer sustainability commitments, including energy-regenerative gearless machine adoption, continue to inform procurement evaluations by developers pursuing green building certifications. We found that investors increasingly favor manufacturers with credible energy efficiency roadmaps, treating regenerative drive adoption as a governance indicator alongside safety performance.

Key Benefits for Stakeholders

How Does This Report Benefit Enterprise and Industry Leaders?

Enterprise and industry leaders gain access to validated segmentation, competitive benchmarking, and regional demand forecasts that support vendor-selection and capacity-investment decisions across the traction elevator industry. Our analysis shows that detailed type, application, and speed breakdowns help procurement and product teams align specifications with construction and modernization requirements while identifying underserved industry segments for expansion.

How Does This Report Benefit Investors and Financial Analysts?

Investors and financial analysts benefit from consistent, single-point market size and CAGR estimates that support valuation and capital-allocation decisions across the traction elevator supply chain. We observed that the report's regional and segment-level growth differentials help identify which manufacturers are best positioned to capture above-market growth in Latin America and high-speed elevator categories through 2035.

How Does This Report Benefit Technology Vendors and Product Teams?

Technology vendors and product teams gain insight into emerging design requirements, including IoT-enabled predictive maintenance, gearless energy-regenerative machines, and robotic installation systems, that are reshaping the industry. Our findings suggest that this analysis helps R&D teams prioritize development roadmaps around connected service infrastructure increasingly required by building owners and property managers.

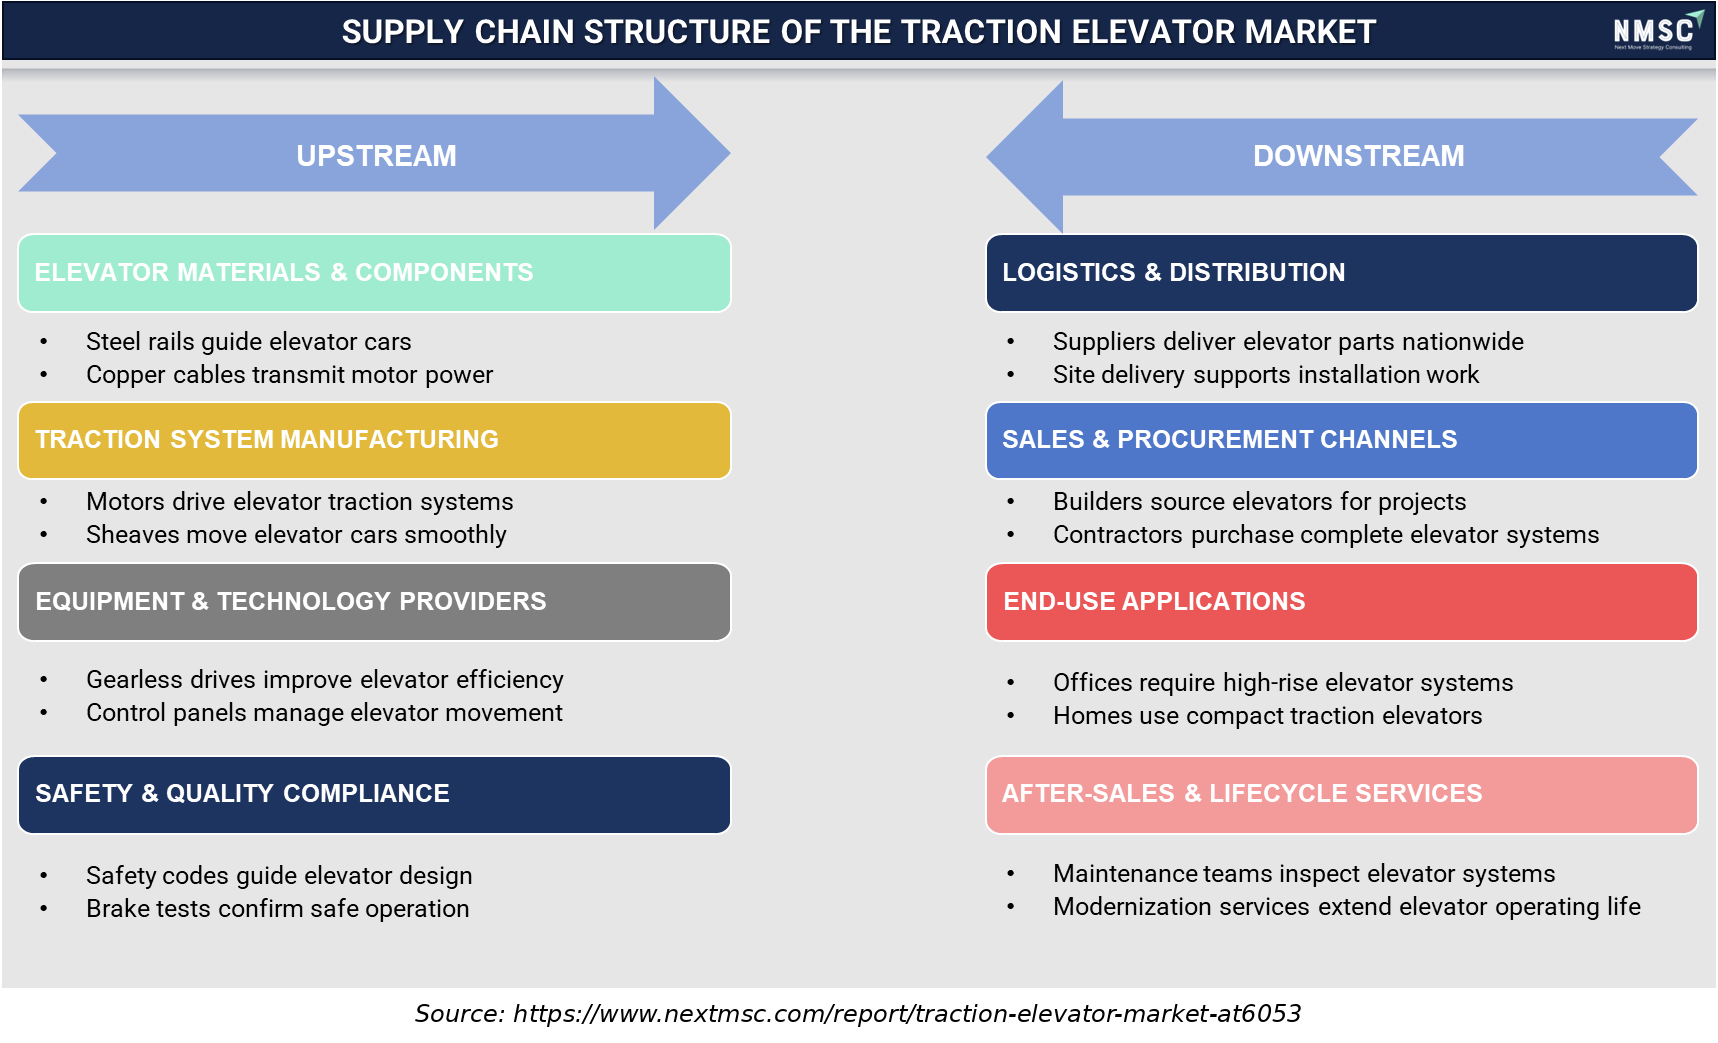
Supply Chain Structure of the Traction Elevator Market

Supply Chain Structure of the Traction Elevator Market

The traction elevator supply chain integrates material and component suppliers, traction-system manufacturers, technology providers, logistics networks, installation channels, and end-use customers. Steel rails, cables, motors, sheaves, and control systems support elevator production, while builders and contractors drive procurement. Maintenance, inspection, modernization, and lifecycle services remain essential for ensuring safety, reliability, and long-term system performance.

Key Market Segments Evaluated

By Type

  • Machine Room-Less Traction Elevator
  • Machine Room Traction Elevator

By Machine Type

  • Geared Traction Machine
  • Gearless Traction Machine

By Capacity

  • Up to 1000 Kg
  • 1001 to 2000 Kg
  • Above 2000 Kg

By Speed

  • 1.0 to 2.5 MPS
  • Up to 1.0 MPS
  • Above 2.5 MPS

By Application

  • Residential
  • Commercial
  • Institutional
  • Industrial
  • Other Applications

Conclusion & Recommendations

The long-term outlook for the market remains steadily positive, with global revenue projected to expand from USD 28.4 billion in 2025 to USD 51.38 billion by 2035 at a 6.2% CAGR. We observed that sustained high-rise construction across Asia-Pacific, growing IoT-enabled predictive maintenance adoption, and expanding modernization spending will continue underpinning demand across residential, commercial, and industrial applications through the forecast period.

What Strategic Positioning Should Traction Elevator Vendors Pursue?

Vendors should prioritize connected service platform expansion while pursuing gearless and energy-regenerative machine development to secure long-term modernization and maintenance contracts. Our assessment indicates that vendors investing early in IoT connectivity and robotic installation capability will be best positioned to capture premium pricing within the traction elevator market.

How Attractive Is the Traction Elevator Market for New Investment?

The traction elevator industry presents an attractive investment case, supported by a USD 21.48 billion absolute dollar opportunity between 2026 and 2035 and above-average growth in Latin America and high-speed elevator categories. We found that investment attractiveness is highest for manufacturers combining established global service infrastructure with regional manufacturing scale, positioning them to serve both mature modernization markets and fast-growing emerging construction markets simultaneously.

What Market Shifts and Key Risks Should Stakeholders Monitor?

Stakeholders should monitor input cost volatility, construction project delays in mature markets, and intense regional pricing competition as key risks to the traction elevator market. Our analysis shows that manufacturers unable to demonstrate differentiated digital service capability risk losing modernization and service contract renewals to competitors with more advanced connected maintenance platforms, particularly as building owners increasingly prioritize uptime guarantees.

What Are the Key Growth Pathways for the Traction Elevator Market?

Key growth pathways include expanding IoT-enabled connected service capability, scaling high-speed traction systems for super-tall building programs, and deepening penetration into industrial and modernization channels. NMSC's analysis indicates that vendors pursuing these pathways while maintaining broad regional manufacturing and service networks will be best positioned to capture the traction elevator market's projected growth through 2035.

FAQs

About the Author

Mihul Sharma

Mihul Sharma

Mihul Sharma is Research Associate at Next Move Strategy Consulting, where he has covered technology, industrial, and healthcare markets for 3 years. His work applies structured business research, market analysis, and secondary-source review to assess market trends, competitive developments, and growth opportunities. He supports report development by fully synthesizing industry data, company information, and market signals into concise findings for strategy and investment-focused research teams.

About the Reviewer

Supradip Baul

Supradip Baul

Supradip Baul is an accomplished business consultant and strategist with over a decade of rich experience in market intelligence, strategy, technology, and business transformation. His work has included rigorous qualitative and quantitative analysis across multiple industries, helping clients shape investment decisions and long-term roadmaps. Earlier in his career, he was associated with Gartner, where he contributed to industry-leading reports and market share analyses. He has worked with leading global companies and holds an MBA with a dual specialization in Marketing and Finance.

Download Free Sample

Ross J Mckenzie

ROSS J MCKENZIE

Business Insight Manager

Staysure Group

“Next MSC have been incredibly helpful in providing detailed & robust information on our market, alongside quantifying growth by different segments. The process to procure was simple and easy, with sample reports and regular contact to ensure we had what we needed. Succinct detail on their sources & methodologies is also greatly received, allowing transparency in this respect helps build trust in the detail you pay for. Joseph in particular was fantastic, and helped ensure efficient provision of the insight pack – thank you NMSC!”.

Nishant Awate

NISHANT AWATE

Business Development Global Sales

Zehnder Group Deutschland GmbH

Our experience working with Next Move Strategy Consulting was positive. The team was responsive, professional, and open to incorporating our specific requirements throughout the project. The India AHU market study was comprehensive and well structured, covering market value and volume forecasts, product and application segments, and key industry trends. The inclusion of both AHU and residential MVHR market insights made the study particularly relevant for our strategic market assessment. Overall, the report provides a solid foundation for evaluating market potential, identifying priority segments, and supporting business-development decisions in India.

Pratyush Kumar Das

PRATYUSH KUMAR DAS

Assistant Manager

Polycab India Limited

We would like to express our appreciation for the data and insights provided by nextmsc. We are very pleased with the quality and depth of the information, which has proven to be highly valuable and beneficial for our business decision-making.

Melanie Samko

MELANIE SAMKO

Director of Marketing

TOSOH BIOSCIENCE, INC.

The information provided by NMSC is incredibly valuable, thank you so much for such a excellent work. I really appreciate it. I will make sure to reference all of it, in my summary document.

Gustaf Hummel Burstrom

GUSTAF HUMMEL BURSTROM

Founder

Revline Tools AB

Joseph and the team at Next Move Strategy Consulting have been excellent to work with, in supplying us with relevant market data and forecasts for our specific category. We had some special requirements and they were able to do a custom package to suit our needs. We would definitely recommend them to any other company needing market data and forecasts

Custom Market Research Services

We will customize the research for you if the listed report does not fully match your requirements.

Get 30% Free Customization

Select License

This website uses cookies to ensure you get the best experience on our website. Learn more

✖