Vertical Farming Market by Crop Type (Leafy Green, Pollinated Plant and Nutraceutical) by Structure (Building-based Vertical Farms and Container-based Vertical Farms), by Component (Hardware, Software and Service), by Growth Mechanism (Hydroponics, Aeroponics, and Aquaponics) - Global Opportunity Analysis and Industry Forecast, 2022 – 2030 - Global Opportunity Analysis and Industry Forecast, 2022 – 2030

Vertical Farming Market

Industry:  Food & Beverages | Publish Date: Dec 2020 | No of Pages:  357 | No. Tables:  202 | No. Figures:  172

Market Definition

The global Vertical Farming Market size was valued at USD 3.52 billion in 2021 and is predicted to reach USD 30.58 billion by 2030 with a CAGR of 24.6% from 2022 to 2030.

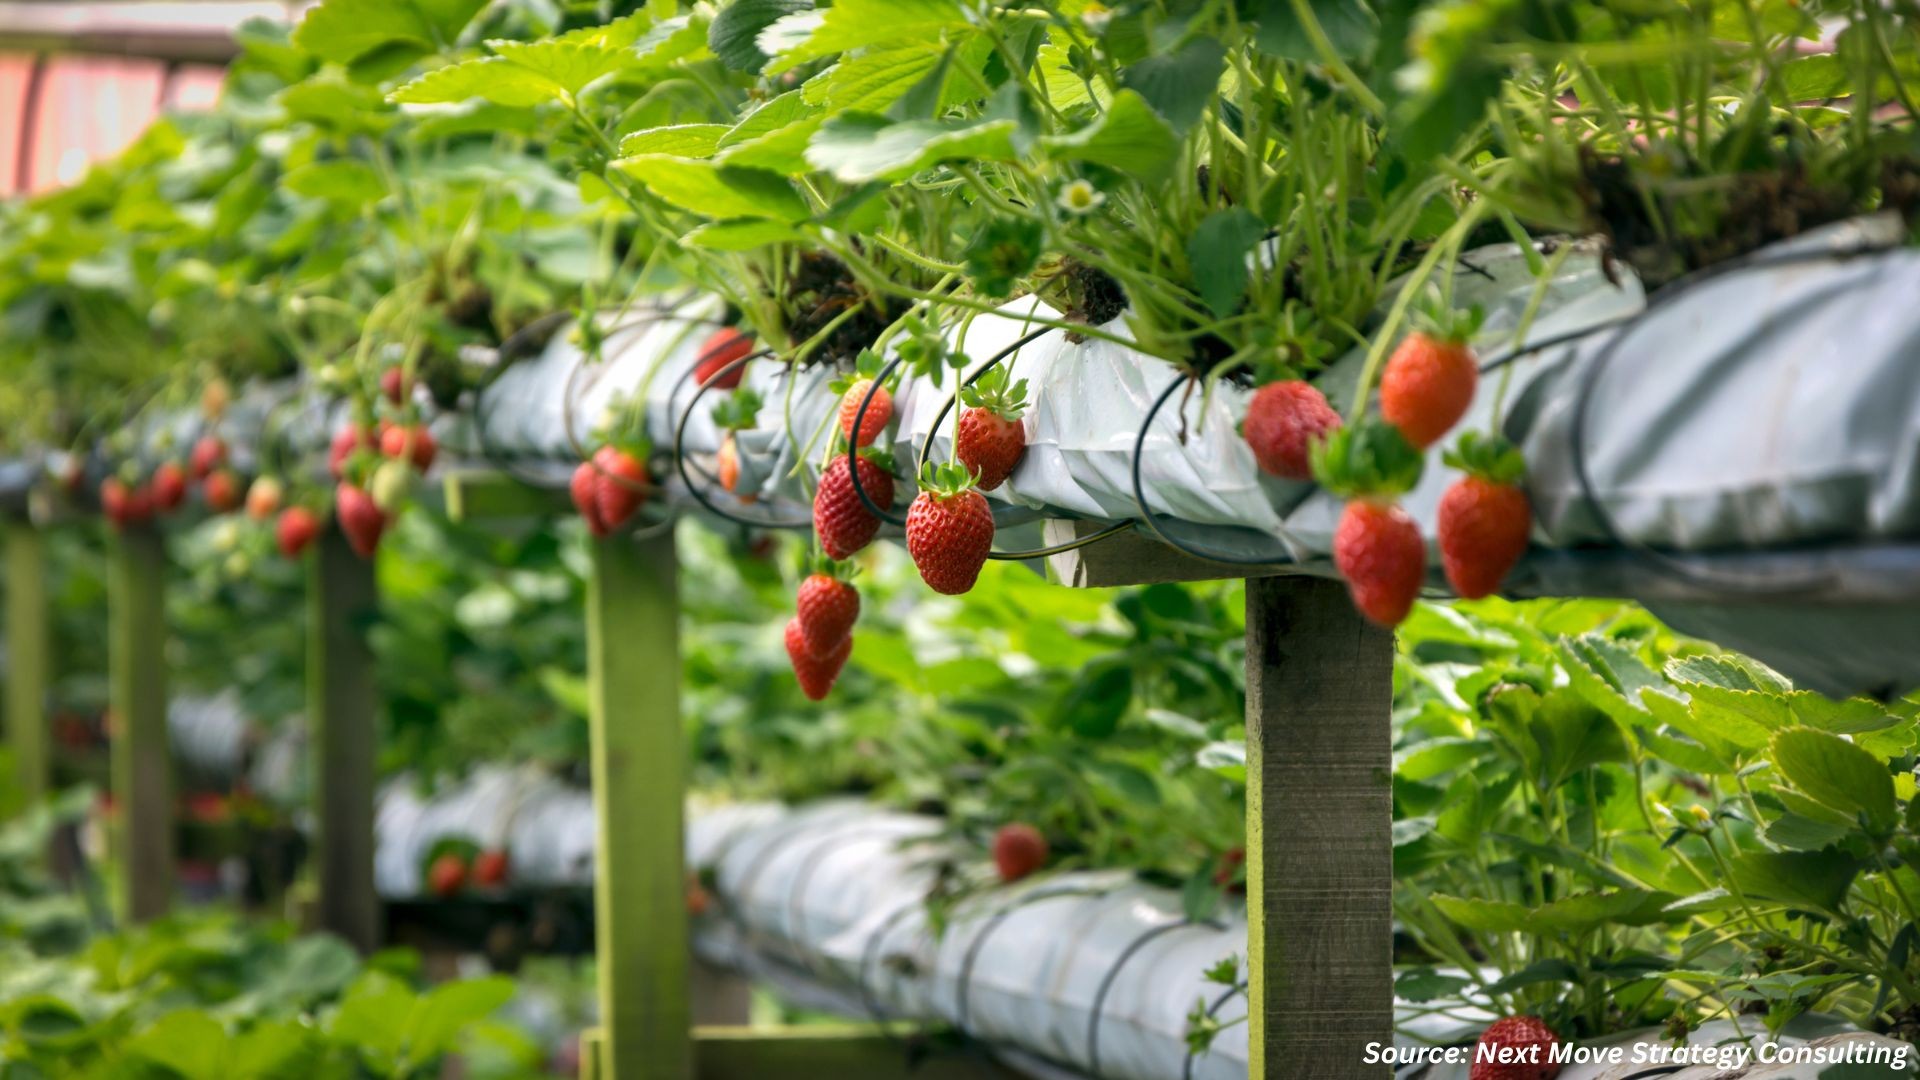
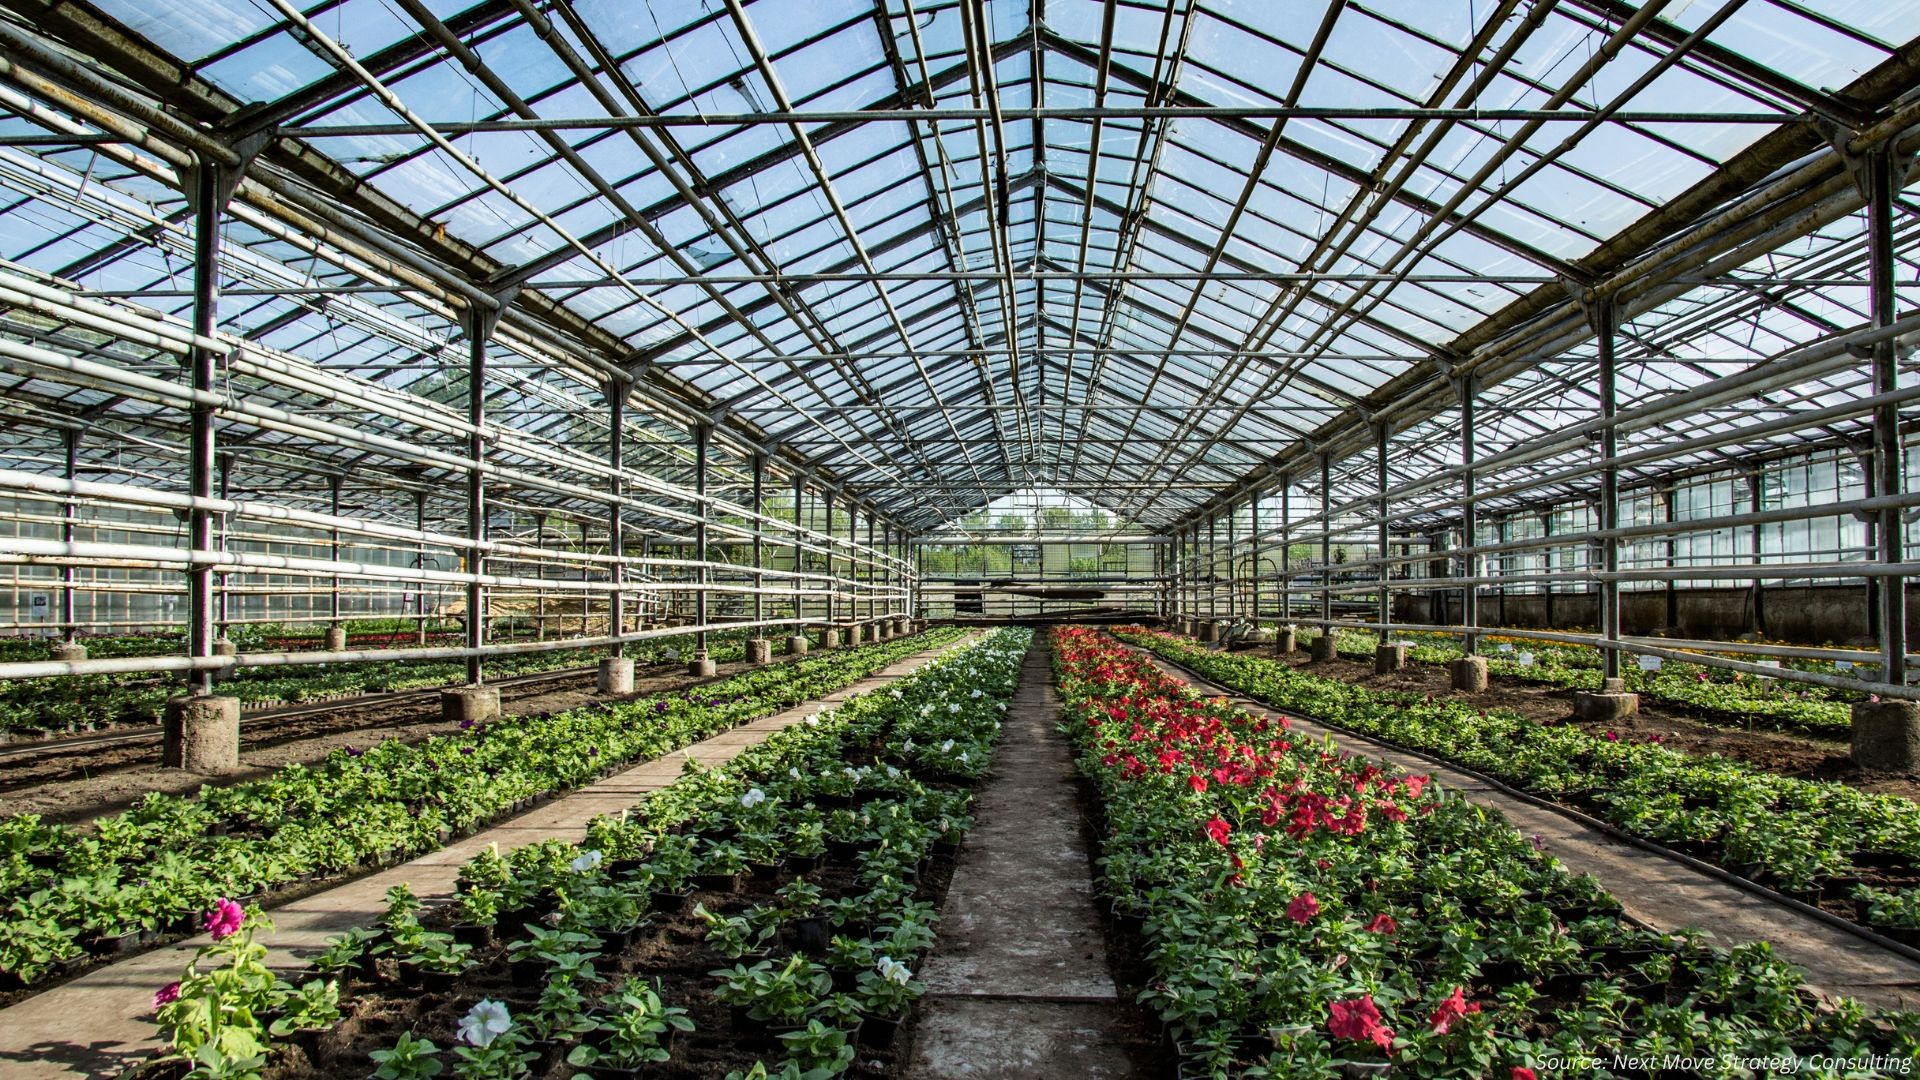
Vertical farming is a type of agriculture in which crops are produced vertically, rather than in horizontal rows. Crops grown in a vertical manner provide greater space, resulting in a higher crop yield per square foot of land used. This type of farming is mainly located in indoor areas where the farmers instead of using sunlight and rain, control the environmental conditions by using LED lighting. Thus, it is considered a highly efficient and sustainable way of producing food as plants are not grown directly in the soil outdoors.

Market Dynamics and Trends

Vertical framing does not depend on the natural environment for the production of crops rather it uses advanced technologies such as big data analytics, robotics, artificial intelligence (AI), and the internet of things (IoT) to control humidity and temperature so that the crops can be produced perfectly without any agronomic constrain. This is expected to support the growth of the vertical farming market. Also, vertical farming allows the farmers to produce crops with 70% to 95% less water than what is required for normal cultivation and the water used in this type of farming can be recycled. further boosting the market growth.

Moreover, the growing acceptance of vertical farming as a new sustainable method of cultivation by various governments is expected to further propel the vertical farming  growth in the forecasted period. For instance, in May 2022, the UK government recognized the role of vertical farming in the 'Spring Showcase' event and further exhibited Intelligent Growth Solutions (IGS). The IGS team illustrated a virtual tour by showcasing a wide range of crops that can be grown in its precision-controlled scenarios. This included herbs, leafy greens, chilies, and others. Thus, such initiatives are expected to further encourage people to adopt vertical farming which will, in turn, boost the market growth.

The high initial cost of vertical farming along with the lack of skilled labor are factors that are expected to restrain the growth of the market during the forecast period. On the contrary, the growing use of robotics in vertical farming with visual inspection technology that can monitor plants, chart their growth, and can forecast the time when they can be harvested is expected to create ample growth opportunities for the market in the coming years.


Market Segmentations and Scope of the Study

The global vertical farming market report is segmented on the basis of crop type, structure, component, growth mechanism, and geography. On the basis of crop type, the market is divided into leafy green, pollinated plants, and nutraceutical plants. On the basis of structure, the market is segmented into building-based vertical farms and container-based vertical farms. On the basis of components, the market is bifurcated into hardware, software, and services. The hardware sub-segment is further bifurcated into lighting, hydroponics components, sensors, and climate control. On the basis of growth mechanism, the market is divided into hydroponics, aeroponics, and aquaponics. Geographic breakdown and analysis of each of the aforesaid segments include regions comprising North America, Europe, Asia-Pacific, and Row.


Geographical analysis

Asia-Pacific held the predominant share of the vertical farming market in 2021 and is expected to continue its dominance during the forecast period. This is attributed to the factors such as the presence of a large population that demands alternative methods of farming with modern solutions that include robotics and AI to fulfill the requirement of food production and supplies, thereby boosting the market growth of the region.  Moreover, various government initiatives to expand vertical farming are expected to drive the market in this region.

For instance, in September 2021, under the Merian Fund programme, the Chinese Academy of Sciences (CAS) collaborated with Dutch Research Council to grant two joint research projects on vertical farming. This collaboration is aimed at solving the challenges faced in vertical farming including the reduction of energy use and optimization of crop yield. These contributions will further include developing a digital twin system and optimization of energy-efficient growth conditions.

Moreover, in January 2022, The Indian Institute of Horticultural Research (IIHR), Bengaluru, announced to buy and distribute Arka Vertical Garden structures to individuals living in urban areas around the state in order to boost urban farming. The structure is excellent for producing vegetables in a safe and convenient manner to satisfy the needs of families by providing alternative solutions to farming. Thus, the growing R&D activities in the region further boost the growth of the market.

North America is expected to exhibit steady growth in the market during the forecast period, due to the presence of key market players such as Aerofarms and Bowery Farming of vertical farming in the region. For instance, in May 2022, Bowery Farming announced to launch a new vertical farm in Bethlehem, Pennsylvania. The farm consists of 100% renewable energy and a water recapture and filtration system that is designed to ensure the highest-quality food safety standards.

Also, in August 2021, Cargill announced to partner with AeroFarms for a research agreement that aims at improving cocoa bean yields and developing more climate-resilient farming practices. The companies planned to experiment with different indoor growing technologies such as aeroponics & hydroponics, irrigation, nutrition, plant space, and pruning to identify the optimal conditions for cocoa growth.


Competitive Landscape

The vertical farming market comprises various market players such as Aerofarms, InFarm, Jones Food Company, Swegreen, Sky Greens, Agricool, Future Crops, Freight Farms Inc, Grow Up Farms Ltd, and 4D Bios Inc. among others. These market players are adopting joint venture strategies and planning business expansion across various regions to maintain their dominance in the vertical farming industry.

For instance, in March 2022, Future Crops announced an investment led by Tencent to accelerate growth to develop an advanced vertical farming solution from cutting-edge technology. This high-tech farm grows fresh, clean, ultra-sustainable, high-quality crops at a competitive price. The company is shaping the future of the agriculture and food system, making it safer, more resilient, and more efficient with indoor farming techniques.

Also, in October 2021, Jones Food Company announced to launch the world’s biggest vertical farm called JFC2.  JFC2 is expected to be three times bigger than its first farm JFC1, with a growing space of 148,000 sqft that can be utilized for the production of crops on a large scale.

KEY BENEFITS 

  • The vertical farming market report provides a quantitative analysis of the current market and estimations through 2022-2030 that assists in identifying the prevailing market opportunities to capitalize on.

  • The study comprises a deep dive analysis of the vertical farming market trend including the current and future trends for depicting the prevalent investment pockets in the market.

  • The information related to key drivers, restraints, and opportunities and their impact on the market is provided in the report.

  • The competitive analysis of the market players along with their market share in the market.

  • The SWOT analysis and Porter’s Five Forces model are elaborated in the study.

  • Value chain analysis in the market study provides a clear picture of the stakeholders’ roles.

Vertical Farming Market Key Segments

By Crop Type

  • Leafy Green

  • Pollinated Plants

  • Nutraceutical Plant 

By Structure

  • Building-based Vertical Farms

  • Container-based Vertical Farms

By Component

  • Hardware

    • Lighting

    • Hydroponics Components

    • Sensors

    • Climate Control

  • Software

  • Services

By Growth Mechanism

  • Hydroponics

  • Aeroponics

  • Aquaponics

By Geography

  • North America

    • U.S.

    • Canada

    • Mexico

  • Europe

    • UK

    • Germany

    • France

    • Italy

    • Spain

    • Rest of Europe

  • Asia-Pacific

    • China

    • India

    • Japan

    • South Korea

    • Australia

    • Rest of Asia-Pacific

  • RoW

    • UAE

    • Saudi Arabia

    • South Africa

    • Brazil

    • Remaining countries

REPORT SCOPE AND SEGMENTATION:

Parameters

Details

Analysis Period

2021–2030

Base Year Considered

2021

Forecast Period

2022–2030

Market Size Estimation

Billion (USD)

Market Segmentation

By Crop Type (Leafy Green, Pollinated Plants, Nutraceutical Plant) By Structure (Building-based Vertical Farms, Container-based Vertical Farms) By Component (Hardware, Software, Services) By Growth Mechanism (Hydroponics, Aeroponics, Aquaponics)

Geographical Segmentation

North America (U.S., Canada, Mexico) Europe (UK, Germany, France, Italy, Spain, Rest of Europe), Asia-Pacific (China, India, Japan, South Korea, Australia, Rest of Asia-Pacific), RoW (UAE, Saudi Arabia, South Africa, Brazil, Remaining countries)

Companies Profiled

Aerofarms, InFarm, Jones Food Company, Swegreen, Sky Greens, Agricool, Future Crops, Freight Farms, Inc., GrowUp Farms Ltd, 4D Bios Inc.

Test

1.    INTRODUCTION

1.1.           REPORT DESCRIPTION

1.2.           Research Methodology

1.2.1             Secondary Research

1.2.2             Data Analysis Framework

1.2.3             Market size estimation

1.2.4             Forecasting

1.2.5             Primary Research and Data Validation

2.    MARKET SNAPSHOT, 2019-2030 Million USD

2.1.           MARKET SNAPSHOT

3.    PORTER’S FIVE FORCE MODEL ANALYSIS

4.    MARKET DYNAMICS

4.1.           GROWTH DRIVERS

4.1.1             DRIVER 1

4.1.2             DRIVER 2

4.1.3             DRIVER 3

4.1.4             DRIVER 4

4.2.           CHALLENGES

4.2.1             CHALLENGE 1

4.2.2             CHALLENGE 2

4.3.           OPPORTUNITIES

4.3.1             OPPORTUNITY 1

4.3.2             OPPORTUNITY 2

5.    Global  Vertical Farming Market, By Structure

5.1.           Overview

5.2.           Building-based vertical farms

5.2.1             Building-based vertical farms Market, By Region

5.2.1.1        North America Building-based vertical farms Market, By Country

5.2.1.2        Europe Building-based vertical farms Market, By Country

5.2.1.3        Asia-Pacific Building-based vertical farms Market, By Country

5.2.1.4        Rest of World Building-based vertical farms Market, By Country

5.3.           Shipping-container-based vertical farms

5.3.1             Shipping-container-based vertical farms Market, By Region

5.3.1.1        North America Shipping-container-based vertical farms Market, By Country

5.3.1.2        Europe Shipping-container-based vertical farms Market, By Country

5.3.1.3        Asia-Pacific Shipping-container-based vertical farms Market, By Country

5.3.1.4        Rest of World Shipping-container-based vertical farms Market, By Country

6.    Global  Vertical Farming Market, By Growth Mechanism

6.1.           Overview

6.2.           Hydroponics

6.2.1             Hydroponics Market, By Region

6.2.1.1        North America Hydroponics Market, By Country

6.2.1.2        Europe Hydroponics Market, By Country

6.2.1.3        Asia-Pacific Hydroponics Market, By Country

6.2.1.4        Rest of World Hydroponics Market, By Country

6.3.           Aeroponics

6.3.1             Aeroponics Market, By Region

6.3.1.1        North America Aeroponics Market, By Country

6.3.1.2        Europe Aeroponics Market, By Country

6.3.1.3        Asia-Pacific Aeroponics Market, By Country

6.3.1.4        Rest of World Aeroponics Market, By Country

6.4.           Aquaponics

6.4.1             Aquaponics Market, By Region

6.4.1.1        North America Aquaponics Market, By Country

6.4.1.2        Europe Aquaponics Market, By Country

6.4.1.3        Asia-Pacific Aquaponics Market, By Country

6.4.1.4        Rest of World Aquaponics Market, By Country

7.    Global  Vertical Farming Market, By Component

7.1.           Overview

7.2.           Irrigation components

7.2.1             Irrigation components Market, By Region

7.2.1.1        North America Irrigation components Market, By Country

7.2.1.2        Europe Irrigation components Market, By Country

7.2.1.3        Asia-Pacific Irrigation components Market, By Country

7.2.1.4        Rest of World Irrigation components Market, By Country

7.3.           Lighting

7.3.1             Lighting Market, By Region

7.3.1.1        North America Lighting Market, By Country

7.3.1.2        Europe Lighting Market, By Country

7.3.1.3        Asia-Pacific Lighting Market, By Country

7.3.1.4        Rest of World Lighting Market, By Country

7.4.           Sensor

7.4.1             Sensor Market, By Region

7.4.1.1        North America Sensor Market, By Country

7.4.1.2        Europe Sensor Market, By Country

7.4.1.3        Asia-Pacific Sensor Market, By Country

7.4.1.4        Rest of World Sensor Market, By Country

7.5.           Climate control

7.5.1             Climate control Market, By Region

7.5.1.1        North America Climate control Market, By Country

7.5.1.2        Europe Climate control Market, By Country

7.5.1.3        Asia-Pacific Climate control Market, By Country

7.5.1.4        Rest of World Climate control Market, By Country

7.6.           Building materials

7.6.1             Global Building materials Market, By Component

7.6.1.1        Glass greenhouse Market, By Region

7.6.1.1.1        North America Glass greenhouse Market, By Country

7.6.1.1.2        Europe Glass greenhouse Market, By Country

7.6.1.1.3        Asia-Pacific Glass greenhouse Market, By Country

7.6.1.1.4        Rest of World Glass greenhouse Market, By Country

7.6.1.2        Plastic greenhouse Market, By Region

7.6.1.2.1        North America Plastic greenhouse Market, By Country

7.6.1.2.2        Europe Plastic greenhouse Market, By Country

7.6.1.2.3        Asia-Pacific Plastic greenhouse Market, By Country

7.6.1.2.4        Rest of World Plastic greenhouse Market, By Country

7.6.2             Building materials Market, By Region

7.6.2.1        North America Building materials Market, By Country

7.6.2.2        Europe Building materials Market, By Country

7.6.2.3        Asia-Pacific Building materials Market, By Country

7.6.2.4        Rest of World Building materials Market, By Country

7.7.           Other Component

7.7.1             Other Component Market, By Region

7.7.1.1        North America Other Component Market, By Country

7.7.1.2        Europe Other Component Market, By Country

7.7.1.3        Asia-Pacific Other Component Market, By Country

7.7.1.4        Rest of World Other Component Market, By Country

8.    Global  Vertical Farming Market, By Region

8.1.           Overview

8.2.           North America

8.2.1             North America Vertical Farming Market, By Structure

8.2.2             North America Vertical Farming Market, By Growth Mechanism

8.2.3             North America Vertical Farming Market, By Component

8.2.3.1        North AMERICA BUILDING materials Market, By Component

8.2.4             North America Vertical Farming, Market By Country

8.2.4.1        U.S.

8.2.4.1.1        U.S. Vertical Farming Market, By Structure

8.2.4.1.2        U.S. Vertical Farming Market, By Growth Mechanism

8.2.4.1.3        U.S. Vertical Farming Market, By Component

8.2.4.1.3.1. U.S. Building materials Market, By Component

8.2.4.2        Canada

8.2.4.2.1        Canada Vertical Farming Market, By Structure

8.2.4.2.2        Canada Vertical Farming Market, By Growth Mechanism

8.2.4.2.3        Canada Vertical Farming Market, By Component

8.2.4.2.3.1. Canada Building materials Market, By Component

8.2.4.3        Mexico

8.2.4.3.1        Mexico Vertical Farming Market, By Structure

8.2.4.3.2        Mexico Vertical Farming Market, By Growth Mechanism

8.2.4.3.3        Mexico Vertical Farming Market, By Component

8.2.4.3.3.1. Mexico Building materials Market, By Component

8.3.           Europe

8.3.1             Europe Vertical Farming Market, By Structure

8.3.2             Europe Vertical Farming Market, By Growth Mechanism

8.3.3             Europe Vertical Farming Market, By Component

8.3.3.1        Europe  Building materials Market, By Component

8.3.4             Europe Vertical Farming, Market By Country

8.3.4.1        UK

8.3.4.1.1        UK Vertical Farming Market, By Structure

8.3.4.1.2        UK Vertical Farming Market, By Growth Mechanism

8.3.4.1.3        UK Vertical Farming Market, By Component

8.3.4.1.3.1. UK Building materials Market, By Component

8.3.4.2        Germany

8.3.4.2.1        Germany Vertical Farming Market, By Structure

8.3.4.2.2        Germany Vertical Farming Market, By Growth Mechanism

8.3.4.2.3        Germany Vertical Farming Market, By Component

8.3.4.2.3.1. Germany Building materials Market, By Component

8.3.4.3        France

8.3.4.3.1        France Vertical Farming Market, By Structure

8.3.4.3.2        France Vertical Farming Market, By Growth Mechanism

8.3.4.3.3        France Vertical Farming Market, By Component

8.3.4.3.3.1. France Building materials Market, By Component

8.3.4.4        Italy

8.3.4.4.1        Italy Vertical Farming Market, By Structure

8.3.4.4.2        Italy Vertical Farming Market, By Growth Mechanism

8.3.4.4.3        Italy Vertical Farming Market, By Component

8.3.4.4.3.1. Italy Building materials Market, By Component

8.3.4.5        Netherlands

8.3.4.5.1 Netherlands Vertical Farming Market, By Structure

8.3.4.5.2 Netherlands Vertical Farming Market, By Growth Mechanism

8.3.4.5.3 Netherlands Vertical Farming Market, By Component

8.3.4.5.3.1. Netherlands Building materials Market, By Component

8.3.4.6        Rest of Europe

8.3.4.6.1        Rest of Europe Vertical Farming Market, By Structure

8.3.4.6.2        Rest of Europe Vertical Farming Market, By Growth Mechanism

8.3.4.6.3        Rest of Europe Vertical Farming Market, By Component

8.3.4.6.3.1. Rest of Europe Building materials Market, By Component

8.4.           Asia-Pacific

8.4.1             Asia-Pacific Vertical Farming Market, By Structure

8.4.2             Asia-Pacific Vertical Farming Market, By Growth Mechanism

8.4.3             Asia-Pacific Vertical Farming Market, By Component

8.4.3.1        Asia-Pacific  Building materials Market, By Component

8.4.4             Asia-Pacific Vertical Farming, Market By Country

8.4.4.1        India

8.4.4.1.1        India Vertical Farming Market, By Structure

8.4.4.1.2        India Vertical Farming Market, By Growth Mechanism

8.4.4.1.3        India Vertical Farming Market, By Component

8.4.4.1.3.1. India Building materials Market, By Component

8.4.4.2        China

8.4.4.2.1        China Vertical Farming Market, By Structure

8.4.4.2.2        China Vertical Farming Market, By Growth Mechanism

8.4.4.2.3        China Vertical Farming Market, By Component

8.4.4.2.3.1. China Building materials Market, By Component

8.4.4.3        Australia

8.4.4.3.1        Australia Vertical Farming Market, By Structure

8.4.4.3.2        Australia Vertical Farming Market, By Growth Mechanism

8.4.4.3.3        Australia Vertical Farming Market, By Component

8.4.4.3.3.1. Australia Building materials Market, By Component

8.4.4.4        Japan

8.4.4.4.1        Japan Vertical Farming Market, By Structure

8.4.4.4.2        Japan Vertical Farming Market, By Growth Mechanism

8.4.4.4.3        Japan Vertical Farming Market, By Component

8.4.4.4.3.1. Japan Building materials Market, By Component

8.4.4.5        Singapore

8.4.4.5.1        Singapore Vertical Farming Market, By Structure

8.4.4.5.2        Singapore Vertical Farming Market, By Growth Mechanism

8.4.4.5.3        Singapore Vertical Farming Market, By Component

8.4.4.5.3.1. Singapore Building materials Market, By Component

8.4.4.6        Rest of Asia-Pacific

8.4.4.6.1        Rest of Asia-Pacific Vertical Farming Market, By Structure

8.4.4.6.2        Rest of Asia-Pacific Vertical Farming Market, By Growth Mechanism

8.4.4.6.3        Rest of Asia-Pacific Vertical Farming Market, By Component

8.4.4.6.3.1. Rest of Asia-Pacific Building materials Market, By Component

8.5.           Rest of World

8.5.1             Rest of World Vertical Farming Market, By Structure

8.5.2             Rest of World Vertical Farming Market, By Growth Mechanism

8.5.3             Rest of World Vertical Farming Market, By Component

8.5.3.1        Rest of World  Building materials Market, By Component

8.5.4             Rest of World Vertical Farming, Market By Country

8.5.4.1        Brazil

8.5.4.1.1        Brazil Vertical Farming Market, By Structure

8.5.4.1.2        Brazil Vertical Farming Market, By Growth Mechanism

8.5.4.1.3        Brazil Vertical Farming Market, By Component

8.5.4.1.3.1. Brazil Building materials Market, By Component

8.5.4.2        Saudi Arabia

8.5.4.2.1        Saudi Arabia Vertical Farming Market, By Structure

8.5.4.2.2        Saudi Arabia Vertical Farming Market, By Growth Mechanism

8.5.4.2.3        Saudi Arabia Vertical Farming Market, By Component

8.5.4.2.3.1. Saudi Arabia Building materials Market, By Component

8.5.4.3        South Africa

8.5.4.3.1        South Africa Vertical Farming Market, By Structure

8.5.4.3.2        South Africa Vertical Farming Market, By Growth Mechanism

8.5.4.3.3        South Africa Vertical Farming Market, By Component

8.5.4.3.3.1. South Africa Building materials Market, By Component

8.5.4.4        Remaining Countries

8.5.4.4.1        Remaining Countries Vertical Farming Market, By Structure

8.5.4.4.2        Remaining Countries Vertical Farming Market, By Growth Mechanism

8.5.4.4.3        Remaining Countries Vertical Farming Market, By Component

8.5.4.4.3.1. Remaining Countries Building materials Market, By Component

9.    COMPANY PROFILES

9.1.D BIOS INC.

9.1.1             COMPANY OVERVIEW

9.1.2             COMPANY SNAPSHOT

9.1.3             OPERATING BUSINESS SEGMENTS

9.1.4             PRODUCT PORTFOLIO

9.1.5             BUSINESS PERFORMANCE

9.1.6             KEY STRATEGIC MOVES AND DEVELOPMENT

9.2.           AEROFARMS

9.2.1             COMPANY OVERVIEW

9.2.2             COMPANY SNAPSHOT

9.2.3             OPERATING BUSINESS SEGMENTS

9.2.4             PRODUCT PORTFOLIO

9.2.5             BUSINESS PERFORMANCE

9.2.6             KEY STRATEGIC MOVES AND DEVELOPMENT

9.3.           AGRILUTION

9.3.1             COMPANY OVERVIEW

9.3.2             COMPANY SNAPSHOT

9.3.3             OPERATING BUSINESS SEGMENTS

9.3.4             PRODUCT PORTFOLIO

9.3.5             BUSINESS PERFORMANCE

9.3.6             KEY STRATEGIC MOVES AND DEVELOPMENT

9.4.           AMHYDRO

9.4.1             COMPANY OVERVIEW

9.4.2             COMPANY SNAPSHOT

9.4.3             OPERATING BUSINESS SEGMENTS

9.4.4             PRODUCT PORTFOLIO

9.4.5             BUSINESS PERFORMANCE

9.4.6             KEY STRATEGIC MOVES AND DEVELOPMENT

9.5.           EVERLIGHT ELECTRONICS CO., LTD.

9.5.1             COMPANY OVERVIEW

9.5.2             COMPANY SNAPSHOT

9.5.3             OPERATING BUSINESS SEGMENTS

9.5.4             PRODUCT PORTFOLIO

9.5.5             BUSINESS PERFORMANCE

9.5.6             KEY STRATEGIC MOVES AND DEVELOPMENT

9.6.           HORT AMERICAS

9.6.1             COMPANY OVERVIEW

9.6.2             COMPANY SNAPSHOT

9.6.3             OPERATING BUSINESS SEGMENTS

9.6.4             PRODUCT PORTFOLIO

9.6.5             BUSINESS PERFORMANCE

9.6.6             KEY STRATEGIC MOVES AND DEVELOPMENT

9.7.           ILLUMITEX INC.

9.7.1             COMPANY OVERVIEW

9.7.2             COMPANY SNAPSHOT

9.7.3             OPERATING BUSINESS SEGMENTS

9.7.4             PRODUCT PORTFOLIO

9.7.5             BUSINESS PERFORMANCE

9.7.6             KEY STRATEGIC MOVES AND DEVELOPMENT

9.8.           KONINKLIJKE PHILIPS N.V.

9.8.1             COMPANY OVERVIEW

9.8.2             COMPANY SNAPSHOT

9.8.3             OPERATING BUSINESS SEGMENTS

9.8.4             PRODUCT PORTFOLIO

9.8.5             BUSINESS PERFORMANCE

9.8.6             KEY STRATEGIC MOVES AND DEVELOPMENT

9.9.           URBAN CROP SOLUTIONS

9.9.1             COMPANY OVERVIEW

9.9.2             COMPANY SNAPSHOT

9.9.3             OPERATING BUSINESS SEGMENTS

9.9.4             PRODUCT PORTFOLIO

9.9.5             BUSINESS PERFORMANCE

9.9.6             KEY STRATEGIC MOVES AND DEVELOPMENT

9.10.         SKY GREENS

9.10.1           COMPANY OVERVIEW

9.10.2           COMPANY SNAPSHOT

9.10.3           OPERATING BUSINESS SEGMENTS

9.10.4           PRODUCT PORTFOLIO

9.10.5           BUSINESS PERFORMANCE

9.10.6           KEY STRATEGIC MOVES AND DEVELOPMENT

LIST OF TABLES

TABLE 1.         Global  Vertical Farming Market Value, By Structure, 2019-2030, Million USD

TABLE 2.         Building-based vertical farms Market Value, By Region, 2019-2030, Million USD

TABLE 3.         North America Building-based vertical farms Market Value, By Country, 2019-2030, Million USD

TABLE 4.         Europe Building-based vertical farms Market Value, By Country, 2019-2030, Million USD

TABLE 5.         Asia-Pacific Building-based vertical farms Market Value, By Country, 2019-2030, Million USD

TABLE 6.         Rest of World Building-based vertical farms Market Value, By Country, 2019-2030, Million USD

TABLE 7.         Shipping-container-based vertical farms Market Value, By Region, 2019-2030, Million USD

TABLE 8.         North America Shipping-container-based vertical farms Market Value, By Country, 2019-2030, Million USD

TABLE 9.         Europe Shipping-container-based vertical farms Market Value, By Country, 2019-2030, Million USD

TABLE 10.       Asia-Pacific Shipping-container-based vertical farms Market Value, By Country, 2019-2030, Million USD

TABLE 11.       Rest of World Shipping-container-based vertical farms Market Value, By Country, 2019-2030, Million USD

TABLE 12.       Global  Vertical Farming Market Value, By Growth Mechanism, 2019-2030, Million USD

TABLE 13.       Hydroponics Market Value, By Region, 2019-2030, Million USD

TABLE 14.       North America Hydroponics Market Value, By Country, 2019-2030, Million USD

TABLE 15.       Europe Hydroponics Market Value, By Country, 2019-2030, Million USD

TABLE 16.       Asia-Pacific Hydroponics Market Value, By Country, 2019-2030, Million USD

TABLE 17.       Rest of World Hydroponics Market Value, By Country, 2019-2030, Million USD

TABLE 18.       Aeroponics Market Value, By Region, 2019-2030, Million USD

TABLE 19.       North America Aeroponics Market Value, By Country, 2019-2030, Million USD

TABLE 20.       Europe Aeroponics Market Value, By Country, 2019-2030, Million USD

TABLE 21.       Asia-Pacific Aeroponics Market Value, By Country, 2019-2030, Million USD

TABLE 22.       Rest of World Aeroponics Market Value, By Country, 2019-2030, Million USD

TABLE 23.       Aquaponics Market Value, By Region, 2019-2030, Million USD

TABLE 24.       North America Aquaponics Market Value, By Country, 2019-2030, Million USD

TABLE 25.       Europe Aquaponics Market Value, By Country, 2019-2030, Million USD

TABLE 26.       Asia-Pacific Aquaponics Market Value, By Country, 2019-2030, Million USD

TABLE 27.       Rest of World Aquaponics Market Value, By Country, 2019-2030, Million USD

TABLE 28.       Global  Vertical Farming Market Value, By Component, 2019-2030, Million USD

TABLE 29.       Irrigation components Market Value, By Region, 2019-2030, Million USD

TABLE 30.       North America Irrigation components Market Value, By Country, 2019-2030, Million USD

TABLE 31.       Europe Irrigation components Market Value, By Country, 2019-2030, Million USD

TABLE 32.       Asia-Pacific Irrigation components Market Value, By Country, 2019-2030, Million USD

TABLE 33.       Rest of World Irrigation components Market Value, By Country, 2019-2030, Million USD

TABLE 34.       Lighting Market Value, By Region, 2019-2030, Million USD

TABLE 35.       North America Lighting Market Value, By Country, 2019-2030, Million USD

TABLE 36.       Europe Lighting Market Value, By Country, 2019-2030, Million USD

TABLE 37.       Asia-Pacific Lighting Market Value, By Country, 2019-2030, Million USD

TABLE 38.       Rest of World Lighting Market Value, By Country, 2019-2030, Million USD

TABLE 39.       Sensor Market Value, By Region, 2019-2030, Million USD

TABLE 40.       North America Sensor Market Value, By Country, 2019-2030, Million USD

TABLE 41.       Europe Sensor Market Value, By Country, 2019-2030, Million USD

TABLE 42.       Asia-Pacific Sensor Market Value, By Country, 2019-2030, Million USD

TABLE 43.       Rest of World Sensor Market Value, By Country, 2019-2030, Million USD

TABLE 44.       Climate control Market Value, By Region, 2019-2030, Million USD

TABLE 45.       North America Climate control Market Value, By Country, 2019-2030, Million USD

TABLE 46.       Europe Climate control Market Value, By Country, 2019-2030, Million USD

TABLE 47.       Asia-Pacific Climate control Market Value, By Country, 2019-2030, Million USD

TABLE 48.       Rest of World Climate control Market Value, By Country, 2019-2030, Million USD

TABLE 49.       Global Building materials Market Value, By Component, 2019-2030, Million USD

TABLE 50.       Glass greenhouse Market Value, By Region, 2019-2030, Million USD

TABLE 51.       North America Glass greenhouse Market Value, By Country, 2019-2030, Million USD

TABLE 52.       Europe Glass greenhouse Market Value, By Country, 2019-2030, Million USD

TABLE 53.       Asia-Pacific Glass greenhouse Market Value, By Country, 2019-2030, Million USD

TABLE 54.       Rest of World Glass greenhouse Market Value, By Country, 2019-2030, Million USD

TABLE 55.       Plastic greenhouse Market Value, By Region, 2019-2030, Million USD

TABLE 56.       North America Plastic greenhouse Market Value, By Country, 2019-2030, Million USD

TABLE 57.       Europe Plastic greenhouse Market Value, By Country, 2019-2030, Million USD

TABLE 58.       Asia-Pacific Plastic greenhouse Market Value, By Country, 2019-2030, Million USD

TABLE 59.       Rest of World Plastic greenhouse Market Value, By Country, 2019-2030, Million USD

TABLE 60.       Building materials Market Value, By Region, 2019-2030, Million USD

TABLE 61.       North America Building materials Market Value, By Country, 2019-2030, Million USD

TABLE 62.       Europe Building materials Market Value, By Country, 2019-2030, Million USD

TABLE 63.       Asia-Pacific Building materials Market Value, By Country, 2019-2030, Million USD

TABLE 64.       Rest of World Building materials Market Value, By Country, 2019-2030, Million USD

TABLE 65.       Other Component Market Value, By Region, 2019-2030, Million USD

TABLE 66.       North America Other Component Market Value, By Country, 2019-2030, Million USD

TABLE 67.       Europe Other Component Market Value, By Country, 2019-2030, Million USD

TABLE 68.       Asia-Pacific Other Component Market Value, By Country, 2019-2030, Million USD

TABLE 69.       Rest of World Other Component Market Value, By Country, 2019-2030, Million USD

TABLE 70.       Global  Vertical Farming Market Value, By Region, 2019-2030, Million USD

TABLE 71.       North America Vertical Farming Market Value, By Structure, 2019-2030, Million USD

TABLE 72.       North America Vertical Farming Market Value, By Growth Mechanism, 2019-2030, Million USD

TABLE 73.       North America Vertical Farming Market Value, By Component, 2019-2030, Million USD

TABLE 74.       North AMERICA BUILDING materials Market Value, By Component, 2019-2030, Million USD

TABLE 75.       U.S. Vertical Farming Market Value, By Structure, 2019-2030, Million USD

TABLE 76.       U.S. Vertical Farming Market Value, By Growth Mechanism, 2019-2030, Million USD

TABLE 77.       U.S. Vertical Farming Market Value, By Component, 2019-2030, Million USD

TABLE 78.       U.S. Building materials Market Value, By Component, 2019-2030, Million USD

TABLE 79.       Canada Vertical Farming Market Value, By Structure, 2019-2030, Million USD

TABLE 80.       Canada Vertical Farming Market Value, By Growth Mechanism, 2019-2030, Million USD

TABLE 81.       Canada Vertical Farming Market Value, By Component, 2019-2030, Million USD

TABLE 82.       Canada Building materials Market Value, By Component, 2019-2030, Million USD

TABLE 83.       Mexico Vertical Farming Market Value, By Structure, 2019-2030, Million USD

TABLE 84.       Mexico Vertical Farming Market Value, By Growth Mechanism, 2019-2030, Million USD

TABLE 85.       Mexico Vertical Farming Market Value, By Component, 2019-2030, Million USD

TABLE 86.       Mexico Building materials Market Value, By Component, 2019-2030, Million USD

TABLE 87.       Europe Vertical Farming Market Value, By Structure, 2019-2030, Million USD

TABLE 88.       Europe Vertical Farming Market Value, By Growth Mechanism, 2019-2030, Million USD

TABLE 89.       Europe Vertical Farming Market Value, By Component, 2019-2030, Million USD

TABLE 90.       Europe  Building materials Market Value, By Component, 2019-2030, Million USD

TABLE 91.       UK Vertical Farming Market Value, By Structure, 2019-2030, Million USD

TABLE 92.       UK Vertical Farming Market Value, By Growth Mechanism, 2019-2030, Million USD

TABLE 93.       UK Vertical Farming Market Value, By Component, 2019-2030, Million USD

TABLE 94.       UK Building materials Market Value, By Component, 2019-2030, Million USD

TABLE 95.       Germany Vertical Farming Market Value, By Structure, 2019-2030, Million USD

TABLE 96.       Germany Vertical Farming Market Value, By Growth Mechanism, 2019-2030, Million USD

TABLE 97.       Germany Vertical Farming Market Value, By Component, 2019-2030, Million USD

TABLE 98.       Germany Building materials Market Value, By Component, 2019-2030, Million USD

TABLE 99.       France Vertical Farming Market Value, By Structure, 2019-2030, Million USD

TABLE 100.    France Vertical Farming Market Value, By Growth Mechanism, 2019-2030, Million USD

TABLE 101.    France Vertical Farming Market Value, By Component, 2019-2030, Million USD

TABLE 102.    France Building materials Market Value, By Component, 2019-2030, Million USD

TABLE 103.    Italy Vertical Farming Market Value, By Structure, 2019-2030, Million USD

TABLE 104.    Italy Vertical Farming Market Value, By Growth Mechanism, 2019-2030, Million USD

TABLE 105.    Italy Vertical Farming Market Value, By Component, 2019-2030, Million USD

TABLE 106.    Italy Building materials Market Value, By Component, 2019-2030, Million USD

TABLE 107.    Netherlands Vertical Farming Market Value, By Structure, 2019-2030, Million USD

TABLE 108.    Netherlands Vertical Farming Market Value, By Growth Mechanism, 2019-2030, Million USD

TABLE 109.    Netherlands Vertical Farming Market Value, By Component, 2019-2030, Million USD

TABLE 110.    Netherlands Building materials Market Value, By Component, 2019-2030, Million USD

TABLE 111.    Rest of Europe Vertical Farming Market Value, By Structure, 2019-2030, Million USD

TABLE 112.    Rest of Europe Vertical Farming Market Value, By Growth Mechanism, 2019-2030, Million USD

TABLE 113.    Rest of Europe Vertical Farming Market Value, By Component, 2019-2030, Million USD

TABLE 114.    Rest of Europe Building materials Market Value, By Component, 2019-2030, Million USD

TABLE 115.    Asia-Pacific Vertical Farming Market Value, By Structure, 2019-2030, Million USD

TABLE 116.    Asia-Pacific Vertical Farming Market Value, By Growth Mechanism, 2019-2030, Million USD

TABLE 117.    Asia-Pacific Vertical Farming Market Value, By Component, 2019-2030, Million USD

TABLE 118.    Asia-Pacific  Building materials Market Value, By Component, 2019-2030, Million USD

TABLE 119.    India Vertical Farming Market Value, By Structure, 2019-2030, Million USD

TABLE 120.    India Vertical Farming Market Value, By Growth Mechanism, 2019-2030, Million USD

TABLE 121.    India Vertical Farming Market Value, By Component, 2019-2030, Million USD

TABLE 122.    India Building materials Market Value, By Component, 2019-2030, Million USD

TABLE 123.    China Vertical Farming Market Value, By Structure, 2019-2030, Million USD

TABLE 124.    China Vertical Farming Market Value, By Growth Mechanism, 2019-2030, Million USD

TABLE 125.    China Vertical Farming Market Value, By Component, 2019-2030, Million USD

TABLE 126.    China Building materials Market Value, By Component, 2019-2030, Million USD

TABLE 127.    Australia Vertical Farming Market Value, By Structure, 2019-2030, Million USD

TABLE 128.    Australia Vertical Farming Market Value, By Growth Mechanism, 2019-2030, Million USD

TABLE 129.    Australia Vertical Farming Market Value, By Component, 2019-2030, Million USD

TABLE 130.    Australia Building materials Market Value, By Component, 2019-2030, Million USD

TABLE 131.    Japan Vertical Farming Market Value, By Structure, 2019-2030, Million USD

TABLE 132.    Japan Vertical Farming Market Value, By Growth Mechanism, 2019-2030, Million USD

TABLE 133.    Japan Vertical Farming Market Value, By Component, 2019-2030, Million USD

TABLE 134.    Japan Building materials Market Value, By Component, 2019-2030, Million USD

TABLE 135.    Singapore Vertical Farming Market Value, By Structure, 2019-2030, Million USD

TABLE 136.    Singapore Vertical Farming Market Value, By Growth Mechanism, 2019-2030, Million USD

TABLE 137.    Singapore Vertical Farming Market Value, By Component, 2019-2030, Million USD

TABLE 138.    Singapore Building materials Market Value, By Component, 2019-2030, Million USD

TABLE 139.    Rest of Asia-Pacific Vertical Farming Market Value, By Structure, 2019-2030, Million USD

TABLE 140.    Rest of Asia-Pacific Vertical Farming Market Value, By Growth Mechanism, 2019-2030, Million USD

TABLE 141.    Rest of Asia-Pacific Vertical Farming Market Value, By Component, 2019-2030, Million USD

TABLE 142.    Rest of Asia-Pacific Building materials Market Value, By Component, 2019-2030, Million USD

TABLE 143.    Rest of World Vertical Farming Market Value, By Structure, 2019-2030, Million USD

TABLE 144.    Rest of World Vertical Farming Market Value, By Growth Mechanism, 2019-2030, Million USD

TABLE 145.    Rest of World Vertical Farming Market Value, By Component, 2019-2030, Million USD

TABLE 146.    Rest of World  Building materials Market Value, By Component, 2019-2030, Million USD

TABLE 147.    Brazil Vertical Farming Market Value, By Structure, 2019-2030, Million USD

TABLE 148.    Brazil Vertical Farming Market Value, By Growth Mechanism, 2019-2030, Million USD

TABLE 149.    Brazil Vertical Farming Market Value, By Component, 2019-2030, Million USD

TABLE 150.    Brazil Building materials Market Value, By Component, 2019-2030, Million USD

TABLE 151.    Saudi Arabia Vertical Farming Market Value, By Structure, 2019-2030, Million USD

TABLE 152.    Saudi Arabia Vertical Farming Market Value, By Growth Mechanism, 2019-2030, Million USD

TABLE 153.    Saudi Arabia Vertical Farming Market Value, By Component, 2019-2030, Million USD

TABLE 154.    Saudi Arabia Building materials Market Value, By Component, 2019-2030, Million USD

TABLE 155.    South Africa Vertical Farming Market Value, By Structure, 2019-2030, Million USD

TABLE 156.    South Africa Vertical Farming Market Value, By Growth Mechanism, 2019-2030, Million USD

TABLE 157.    South Africa Vertical Farming Market Value, By Component, 2019-2030, Million USD

TABLE 158.    South Africa Building materials Market Value, By Component, 2019-2030, Million USD

TABLE 159.    Remaining Countries Vertical Farming Market Value, By Structure, 2019-2030, Million USD

TABLE 160.    Remaining Countries Vertical Farming Market Value, By Growth Mechanism, 2019-2030, Million USD

TABLE 161.    Remaining Countries Vertical Farming Market Value, By Component, 2019-2030, Million USD

TABLE 162.    Remaining Countries Building materials Market Value, By Component, 2019-2030, Million USD

TABLE 163.D BIOS INC.: COMPANY SNAPSHOT

TABLE 164.D BIOS INC.: OPERATING SEGMENTS

TABLE 165.D BIOS INC.: PRODUCT PORTFOLIO

TABLE 166.D BIOS INC.: KEY STRATERGY

TABLE 167.    AEROFARMS: COMPANY SNAPSHOT

TABLE 168.    AEROFARMS: OPERATING SEGMENTS

TABLE 169.    AEROFARMS: PRODUCT PORTFOLIO

TABLE 170.    AEROFARMS: KEY STRATERGY

TABLE 171.    AGRILUTION: COMPANY SNAPSHOT

TABLE 172.    AGRILUTION: OPERATING SEGMENTS

TABLE 173.    AGRILUTION: PRODUCT PORTFOLIO

TABLE 174.    AGRILUTION: KEY STRATERGY

TABLE 175.    AMHYDRO: COMPANY SNAPSHOT

TABLE 176.    AMHYDRO: OPERATING SEGMENTS

TABLE 177.    AMHYDRO: PRODUCT PORTFOLIO

TABLE 178.    AMHYDRO: KEY STRATERGY

TABLE 179.    EVERLIGHT ELECTRONICS CO., LTD.: COMPANY SNAPSHOT

TABLE 180.    EVERLIGHT ELECTRONICS CO., LTD.: OPERATING SEGMENTS

TABLE 181.    EVERLIGHT ELECTRONICS CO., LTD.: PRODUCT PORTFOLIO

TABLE 182.    EVERLIGHT ELECTRONICS CO., LTD.: KEY STRATERGY

TABLE 183.    HORT AMERICAS: COMPANY SNAPSHOT

TABLE 184.    HORT AMERICAS: OPERATING SEGMENTS

TABLE 185.    HORT AMERICAS: PRODUCT PORTFOLIO

TABLE 186.    HORT AMERICAS: KEY STRATERGY

TABLE 187.    ILLUMITEX INC.: COMPANY SNAPSHOT

TABLE 188.    ILLUMITEX INC.: OPERATING SEGMENTS

TABLE 189.    ILLUMITEX INC.: PRODUCT PORTFOLIO

TABLE 190.    ILLUMITEX INC.: KEY STRATERGY

TABLE 191.    KONINKLIJKE PHILIPS N.V.: COMPANY SNAPSHOT

TABLE 192.    KONINKLIJKE PHILIPS N.V.: OPERATING SEGMENTS

TABLE 193.    KONINKLIJKE PHILIPS N.V.: PRODUCT PORTFOLIO

TABLE 194.    KONINKLIJKE PHILIPS N.V.: KEY STRATERGY

TABLE 195.    URBAN CROP SOLUTIONS: COMPANY SNAPSHOT

TABLE 196.    URBAN CROP SOLUTIONS: OPERATING SEGMENTS

TABLE 197.    URBAN CROP SOLUTIONS: PRODUCT PORTFOLIO

TABLE 198.    URBAN CROP SOLUTIONS: KEY STRATERGY

TABLE 199.    SKY GREENS: COMPANY SNAPSHOT

TABLE 200.    SKY GREENS: OPERATING SEGMENTS

TABLE 201.    SKY GREENS: PRODUCT PORTFOLIO

TABLE 202.    SKY GREENS: KEY STRATERGY


 LIST OF FIGURES

FIGURE 1.       Global  Vertical Farming Market Value, By Structure, 2019-2030, Million USD

FIGURE 2.       Building-based vertical farms Market Value, By Region, 2019-2030, Million USD

FIGURE 3.       North America Building-based vertical farms Market Value, By Country, 2019-2030, Million USD

FIGURE 4.       Europe Building-based vertical farms Market Value, By Country, 2019-2030, Million USD

FIGURE 5.       Asia-Pacific Building-based vertical farms Market Value, By Country, 2019-2030, Million USD

FIGURE 6.       Rest of World Building-based vertical farms Market Value, By Country, 2019-2030, Million USD

FIGURE 7.       Shipping-container-based vertical farms Market Value, By Region, 2019-2030, Million USD

FIGURE 8.       North America Shipping-container-based vertical farms Market Value, By Country, 2019-2030, Million USD

FIGURE 9.       Europe Shipping-container-based vertical farms Market Value, By Country, 2019-2030, Million USD

FIGURE 10.     Asia-Pacific Shipping-container-based vertical farms Market Value, By Country, 2019-2030, Million USD

FIGURE 11.     Rest of World Shipping-container-based vertical farms Market Value, By Country, 2019-2030, Million USD

FIGURE 12.     Global  Vertical Farming Market Value, By Growth Mechanism, 2019-2030, Million USD

FIGURE 13.     Hydroponics Market Value, By Region, 2019-2030, Million USD

FIGURE 14.     North America Hydroponics Market Value, By Country, 2019-2030, Million USD

FIGURE 15.     Europe Hydroponics Market Value, By Country, 2019-2030, Million USD

FIGURE 16.     Asia-Pacific Hydroponics Market Value, By Country, 2019-2030, Million USD

FIGURE 17.     Rest of World Hydroponics Market Value, By Country, 2019-2030, Million USD

FIGURE 18.     Aeroponics Market Value, By Region, 2019-2030, Million USD

FIGURE 19.     North America Aeroponics Market Value, By Country, 2019-2030, Million USD

FIGURE 20.     Europe Aeroponics Market Value, By Country, 2019-2030, Million USD

FIGURE 21.     Asia-Pacific Aeroponics Market Value, By Country, 2019-2030, Million USD

FIGURE 22.     Rest of World Aeroponics Market Value, By Country, 2019-2030, Million USD

FIGURE 23.     Aquaponics Market Value, By Region, 2019-2030, Million USD

FIGURE 24.     North America Aquaponics Market Value, By Country, 2019-2030, Million USD

FIGURE 25.     Europe Aquaponics Market Value, By Country, 2019-2030, Million USD

FIGURE 26.     Asia-Pacific Aquaponics Market Value, By Country, 2019-2030, Million USD

FIGURE 27.     Rest of World Aquaponics Market Value, By Country, 2019-2030, Million USD

FIGURE 28.     Global  Vertical Farming Market Value, By Component, 2019-2030, Million USD

FIGURE 29.     Irrigation components Market Value, By Region, 2019-2030, Million USD

FIGURE 30.     North America Irrigation components Market Value, By Country, 2019-2030, Million USD

FIGURE 31.     Europe Irrigation components Market Value, By Country, 2019-2030, Million USD

FIGURE 32.     Asia-Pacific Irrigation components Market Value, By Country, 2019-2030, Million USD

FIGURE 33.     Rest of World Irrigation components Market Value, By Country, 2019-2030, Million USD

FIGURE 34.     Lighting Market Value, By Region, 2019-2030, Million USD

FIGURE 35.     North America Lighting Market Value, By Country, 2019-2030, Million USD

FIGURE 36.     Europe Lighting Market Value, By Country, 2019-2030, Million USD

FIGURE 37.     Asia-Pacific Lighting Market Value, By Country, 2019-2030, Million USD

FIGURE 38.     Rest of World Lighting Market Value, By Country, 2019-2030, Million USD

FIGURE 39.     Sensor Market Value, By Region, 2019-2030, Million USD

FIGURE 40.     North America Sensor Market Value, By Country, 2019-2030, Million USD

FIGURE 41.     Europe Sensor Market Value, By Country, 2019-2030, Million USD

FIGURE 42.     Asia-Pacific Sensor Market Value, By Country, 2019-2030, Million USD

FIGURE 43.     Rest of World Sensor Market Value, By Country, 2019-2030, Million USD

FIGURE 44.     Climate control Market Value, By Region, 2019-2030, Million USD

FIGURE 45.     North America Climate control Market Value, By Country, 2019-2030, Million USD

FIGURE 46.     Europe Climate control Market Value, By Country, 2019-2030, Million USD

FIGURE 47.     Asia-Pacific Climate control Market Value, By Country, 2019-2030, Million USD

FIGURE 48.     Rest of World Climate control Market Value, By Country, 2019-2030, Million USD

FIGURE 49.     Global Building materials Market Value, By Component, 2019-2030, Million USD

FIGURE 50.     Glass greenhouse Market Value, By Region, 2019-2030, Million USD

FIGURE 51.     North America Glass greenhouse Market Value, By Country, 2019-2030, Million USD

FIGURE 52.     Europe Glass greenhouse Market Value, By Country, 2019-2030, Million USD

FIGURE 53.     Asia-Pacific Glass greenhouse Market Value, By Country, 2019-2030, Million USD

FIGURE 54.     Rest of World Glass greenhouse Market Value, By Country, 2019-2030, Million USD

FIGURE 55.     Plastic greenhouse Market Value, By Region, 2019-2030, Million USD

FIGURE 56.     North America Plastic greenhouse Market Value, By Country, 2019-2030, Million USD

FIGURE 57.     Europe Plastic greenhouse Market Value, By Country, 2019-2030, Million USD

FIGURE 58.     Asia-Pacific Plastic greenhouse Market Value, By Country, 2019-2030, Million USD

FIGURE 59.     Rest of World Plastic greenhouse Market Value, By Country, 2019-2030, Million USD

FIGURE 60.     Building materials Market Value, By Region, 2019-2030, Million USD

FIGURE 61.     North America Building materials Market Value, By Country, 2019-2030, Million USD

FIGURE 62.     Europe Building materials Market Value, By Country, 2019-2030, Million USD

FIGURE 63.     Asia-Pacific Building materials Market Value, By Country, 2019-2030, Million USD

FIGURE 64.     Rest of World Building materials Market Value, By Country, 2019-2030, Million USD

FIGURE 65.     Other Component Market Value, By Region, 2019-2030, Million USD

FIGURE 66.     North America Other Component Market Value, By Country, 2019-2030, Million USD

FIGURE 67.     Europe Other Component Market Value, By Country, 2019-2030, Million USD

FIGURE 68.     Asia-Pacific Other Component Market Value, By Country, 2019-2030, Million USD

FIGURE 69.     Rest of World Other Component Market Value, By Country, 2019-2030, Million USD

FIGURE 70.     Global  Vertical Farming Market Value, By Region, 2019-2030, Million USD

FIGURE 71.     North America Vertical Farming Market Value, By Structure, 2019-2030, Million USD

FIGURE 72.     North America Vertical Farming Market Value, By Growth Mechanism, 2019-2030, Million USD

FIGURE 73.     North America Vertical Farming Market Value, By Component, 2019-2030, Million USD

FIGURE 74.     North America  Building materials Market Value, By Component, 2019-2030, Million USD

FIGURE 75.     U.S. Vertical Farming Market Value, By Structure, 2019-2030, Million USD

FIGURE 76.     U.S. Vertical Farming Market Value, By Growth Mechanism, 2019-2030, Million USD

FIGURE 77.     U.S. Vertical Farming Market Value, By Component, 2019-2030, Million USD

FIGURE 78.     U.S. Building materials Market Value, By Component, 2019-2030, Million USD

FIGURE 79.     Canada Vertical Farming Market Value, By Structure, 2019-2030, Million USD

FIGURE 80.     Canada Vertical Farming Market Value, By Growth Mechanism, 2019-2030, Million USD

FIGURE 81.     Canada Vertical Farming Market Value, By Component, 2019-2030, Million USD

FIGURE 82.     Canada Building materials Market Value, By Component, 2019-2030, Million USD

FIGURE 83.     Mexico Vertical Farming Market Value, By Structure, 2019-2030, Million USD

FIGURE 84.     Mexico Vertical Farming Market Value, By Growth Mechanism, 2019-2030, Million USD

FIGURE 85.     Mexico Vertical Farming Market Value, By Component, 2019-2030, Million USD

FIGURE 86.     Mexico Building materials Market Value, By Component, 2019-2030, Million USD

FIGURE 87.     Europe Vertical Farming Market Value, By Structure, 2019-2030, Million USD

FIGURE 88.     Europe Vertical Farming Market Value, By Growth Mechanism, 2019-2030, Million USD

FIGURE 89.     Europe Vertical Farming Market Value, By Component, 2019-2030, Million USD

FIGURE 90.     Europe  Building materials Market Value, By Component, 2019-2030, Million USD

FIGURE 91.     UK Vertical Farming Market Value, By Structure, 2019-2030, Million USD

FIGURE 92.     UK Vertical Farming Market Value, By Growth Mechanism, 2019-2030, Million USD

FIGURE 93.     UK Vertical Farming Market Value, By Component, 2019-2030, Million USD

FIGURE 94.     UK Building materials Market Value, By Component, 2019-2030, Million USD

FIGURE 95.     Germany Vertical Farming Market Value, By Structure, 2019-2030, Million USD

FIGURE 96.     Germany Vertical Farming Market Value, By Growth Mechanism, 2019-2030, Million USD

FIGURE 97.     Germany Vertical Farming Market Value, By Component, 2019-2030, Million USD

FIGURE 98.     Germany Building materials Market Value, By Component, 2019-2030, Million USD

FIGURE 99.     France Vertical Farming Market Value, By Structure, 2019-2030, Million USD

FIGURE 100.  France Vertical Farming Market Value, By Growth Mechanism, 2019-2030, Million USD

FIGURE 101.  France Vertical Farming Market Value, By Component, 2019-2030, Million USD

FIGURE 102.  France Building materials Market Value, By Component, 2019-2030, Million USD

FIGURE 103.  Italy Vertical Farming Market Value, By Structure, 2019-2030, Million USD

FIGURE 104.  Italy Vertical Farming Market Value, By Growth Mechanism, 2019-2030, Million USD

FIGURE 105.  Italy Vertical Farming Market Value, By Component, 2019-2030, Million USD

FIGURE 106.  Italy Building materials Market Value, By Component, 2019-2030, Million USD

FIGURE 107.  Netherlands Vertical Farming Market Value, By Structure, 2019-2030, Million USD

FIGURE 108.  Netherlands Vertical Farming Market Value, By Growth Mechanism, 2019-2030, Million USD

FIGURE 109.  Netherlands Vertical Farming Market Value, By Component, 2019-2030, Million USD

FIGURE 110.  Netherlands Building materials Market Value, By Component, 2019-2030, Million USD

FIGURE 111.  Rest of Europe Vertical Farming Market Value, By Structure, 2019-2030, Million USD

FIGURE 112.  Rest of Europe Vertical Farming Market Value, By Growth Mechanism, 2019-2030, Million USD

FIGURE 113.  Rest of Europe Vertical Farming Market Value, By Component, 2019-2030, Million USD

FIGURE 114.  Rest of Europe Building materials Market Value, By Component, 2019-2030, Million USD

FIGURE 115.  Asia-Pacific Vertical Farming Market Value, By Structure, 2019-2030, Million USD

FIGURE 116.  Asia-Pacific Vertical Farming Market Value, By Growth Mechanism, 2019-2030, Million USD

FIGURE 117.  Asia-Pacific Vertical Farming Market Value, By Component, 2019-2030, Million USD

FIGURE 118.  Asia-Pacific  Building materials Market Value, By Component, 2019-2030, Million USD

FIGURE 119.  India Vertical Farming Market Value, By Structure, 2019-2030, Million USD

FIGURE 120.  India Vertical Farming Market Value, By Growth Mechanism, 2019-2030, Million USD

FIGURE 121.  India Vertical Farming Market Value, By Component, 2019-2030, Million USD

FIGURE 122.  India Building materials Market Value, By Component, 2019-2030, Million USD

FIGURE 123.  China Vertical Farming Market Value, By Structure, 2019-2030, Million USD

FIGURE 124.  China Vertical Farming Market Value, By Growth Mechanism, 2019-2030, Million USD

FIGURE 125.  China Vertical Farming Market Value, By Component, 2019-2030, Million USD

FIGURE 126.  China Building materials Market Value, By Component, 2019-2030, Million USD

FIGURE 127.  Australia Vertical Farming Market Value, By Structure, 2019-2030, Million USD

FIGURE 128.  Australia Vertical Farming Market Value, By Growth Mechanism, 2019-2030, Million USD

FIGURE 129.  Australia Vertical Farming Market Value, By Component, 2019-2030, Million USD

FIGURE 130.  Australia Building materials Market Value, By Component, 2019-2030, Million USD

FIGURE 131.  Japan Vertical Farming Market Value, By Structure, 2019-2030, Million USD

FIGURE 132.  Japan Vertical Farming Market Value, By Growth Mechanism, 2019-2030, Million USD

FIGURE 133.  Japan Vertical Farming Market Value, By Component, 2019-2030, Million USD

FIGURE 134.  Japan Building materials Market Value, By Component, 2019-2030, Million USD

FIGURE 135.  Singapore Vertical Farming Market Value, By Structure, 2019-2030, Million USD

FIGURE 136.  Singapore Vertical Farming Market Value, By Growth Mechanism, 2019-2030, Million USD

FIGURE 137.  Singapore Vertical Farming Market Value, By Component, 2019-2030, Million USD

FIGURE 138.  Singapore Building materials Market Value, By Component, 2019-2030, Million USD

FIGURE 139.  Rest of Asia-Pacific Vertical Farming Market Value, By Structure, 2019-2030, Million USD

FIGURE 140.  Rest of Asia-Pacific Vertical Farming Market Value, By Growth Mechanism, 2019-2030, Million USD

FIGURE 141.  Rest of Asia-Pacific Vertical Farming Market Value, By Component, 2019-2030, Million USD

FIGURE 142.  Rest of Asia-Pacific Building materials Market Value, By Component, 2019-2030, Million USD

FIGURE 143.  Rest of World Vertical Farming Market Value, By Structure, 2019-2030, Million USD

FIGURE 144.  Rest of World Vertical Farming Market Value, By Growth Mechanism, 2019-2030, Million USD

FIGURE 145.  Rest of World Vertical Farming Market Value, By Component, 2019-2030, Million USD

FIGURE 146.  Rest of World  Building materials Market Value, By Component, 2019-2030, Million USD

FIGURE 147.  Brazil Vertical Farming Market Value, By Structure, 2019-2030, Million USD

FIGURE 148.  Brazil Vertical Farming Market Value, By Growth Mechanism, 2019-2030, Million USD

FIGURE 149.  Brazil Vertical Farming Market Value, By Component, 2019-2030, Million USD

FIGURE 150.  Brazil Building materials Market Value, By Component, 2019-2030, Million USD

FIGURE 151.  Saudi Arabia Vertical Farming Market Value, By Structure, 2019-2030, Million USD

FIGURE 152.  Saudi Arabia Vertical Farming Market Value, By Growth Mechanism, 2019-2030, Million USD

FIGURE 153.  Saudi Arabia Vertical Farming Market Value, By Component, 2019-2030, Million USD

FIGURE 154.  Saudi Arabia Building materials Market Value, By Component, 2019-2030, Million USD

FIGURE 155.  South Africa Vertical Farming Market Value, By Structure, 2019-2030, Million USD

FIGURE 156.  South Africa Vertical Farming Market Value, By Growth Mechanism, 2019-2030, Million USD

FIGURE 157.  South Africa Vertical Farming Market Value, By Component, 2019-2030, Million USD

FIGURE 158.  South Africa Building materials Market Value, By Component, 2019-2030, Million USD

FIGURE 159.  Remaining Countries Vertical Farming Market Value, By Structure, 2019-2030, Million USD

FIGURE 160.  Remaining Countries Vertical Farming Market Value, By Growth Mechanism, 2019-2030, Million USD

FIGURE 161.  Remaining Countries Vertical Farming Market Value, By Component, 2019-2030, Million USD

FIGURE 162.  Remaining Countries Building materials Market Value, By Component, 2019-2030, Million USD

FIGURE 163.D BIOS INC.: NET SALES,2017-2019

FIGURE 164.  AEROFARMS: NET SALES,2017-2019

FIGURE 165.  AGRILUTION: NET SALES,2017-2019

FIGURE 166.  AMHYDRO: NET SALES,2017-2019

FIGURE 167.  EVERLIGHT ELECTRONICS CO., LTD.: NET SALES,2017-2019

FIGURE 168.  HORT AMERICAS: NET SALES,2017-2019

FIGURE 169.  ILLUMITEX INC.: NET SALES,2017-2019

FIGURE 170.  KONINKLIJKE PHILIPS N.V.: NET SALES,2017-2019

FIGURE 171.  URBAN CROP SOLUTIONS: NET SALES,2017-2019

FIGURE 172.  SKY GREENS: NET SALES,2017-2019

KEY PLAYERS

  • Aerofarms

  • InFarm

  • Jones Food Company

  • Swegreen

  • Sky Greens 

  • Agricool

  • Future Crops

  • Freight Farms, Inc.

  • GrowUp Farms Ltd

  • 4D Bios Inc


Frequently Asked Questions
What will be the worth of global vertical farming market by the end of 2030?

According to the report published by Next Move Strategy Consulting, the vertical farming market business is expected to hit at $24.99 billion (USD) by 2030.

Which region is expected to hold the highest market share in the vertical farming market?

Asia Pacific is expected to hold the highest market share in the global market. The region is expected to witness remarkable growth as it houses the major key players in the market.

Which are the top companies in the vertical farming industry?

Aerofarms, InFarm, Jones Food Company Swegreen, Sky Greens, Agricool Future Crops, Freight Farms, Inc., GrowUp Farms Ltd, 4D Bios Inc.

What are the market segmentations and scope of the study?

The global vertical farming market share analysis is based on crop type, structure, component, growth mechanism, and geography.

What are the factors restraining the growth of the vertical farming market?

The high initial cost of vertical farming along with the lack of skilled labor are factors that are expected to restrain the growth of the market.