Waveguide Display Market Size, Share, Trends and Growth Analysis, By Offering Tier (Waveguide Combiner Components, Optical Engines, Integrated Display Modules, Intellectual Property and Licensing, NRE and Manufacturing Services), By End Device Form Factor, By End User Industry (Consumer Electronics, Automotive, Commercial Aerospace, Defense and Military, Healthcare, Industrial and Manufacturing, Research and Education, and Other Industries), By Region, and Segment Forecasts, 2026-2035
Industry: Semiconductor & Electronics | Publishing Date: August 11, 2026 | Last Updated: September 30, 2026 | No of Pages: N/A | No. of Tables: N/A | No. of Figures: N/A | Format: PDF | Report Code: SE683
What Is the Waveguide Display Market Size?
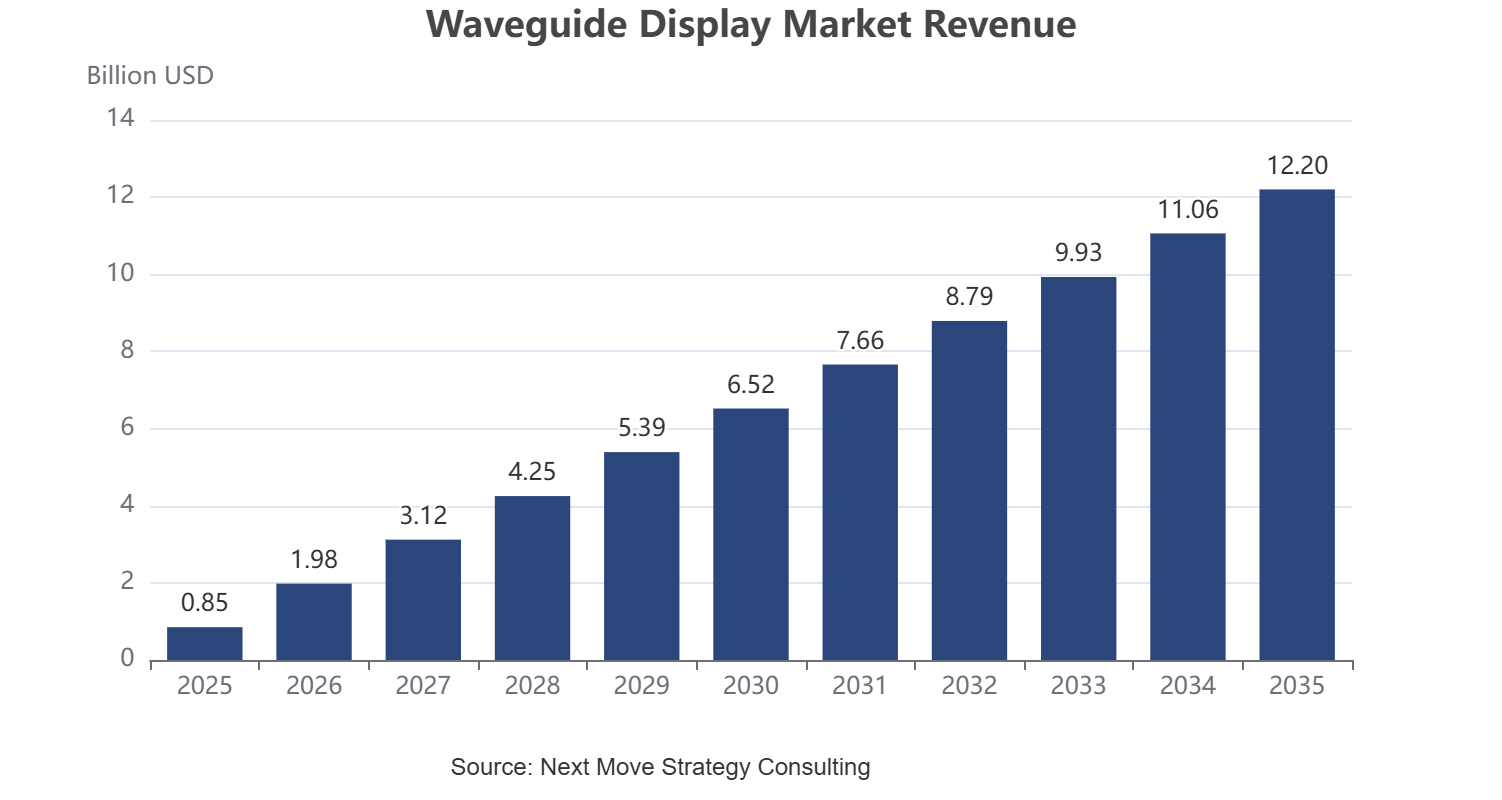
The global waveguide display market size was valued at USD 0.85 billion in 2025 and is estimated at USD 1.15 billion in 2026, projected to reach USD 12.20 billion by 2035, expanding at a CAGR of 30.00% between 2026 and 2035, with Asia-Pacific holding approximately 44.7% share and Waveguide Combiner Components accounting for nearly 49.4% of 2025 revenue.
We observed that demand is broadening across AR smart glasses, mixed reality headsets, and automotive head-up display applications as consumer electronics brands and automakers integrate compact optical combiners into next-generation wearable and in-vehicle display platforms.
|
Key Takeaways |
|
By Offering Tier: Waveguide Combiner Components held the largest share of approximately 49.4% (USD 0.42 Billion) in 2025; Integrated Display Modules is the fastest-growing sub-segment at 32.6% CAGR from 2026-2035. |
|
By End Device Form Factor: AR Smart Glasses held the largest share of approximately 44.7% (USD 0.38 Billion) in 2025; AR Smart Glasses is also the fastest-growing sub-segment at 32.1% CAGR from 2026-2035. |
|
By End User Industry: Consumer Electronics held the largest share of approximately 51.8% (USD 0.44 Billion) in 2025; Consumer Electronics is also the fastest-growing sub-segment at 32.1% CAGR from 2026-2035. |
|
Dominant Region: Asia-Pacific dominated with approximately 44.7% revenue share (USD 0.38 Billion) in 2025. |
|
Fastest-Growing Region: North America is expected to register the highest CAGR of 32.5% during 2026-2035. |
|
Dominant Country: China led with approximately USD 0.16 Billion in 2025. |
|
Fastest-Growing Country: United States is the fastest-growing country at approximately 32.9% CAGR from 2026-2035. |
Market Opportunity: The waveguide display market is expected to create an absolute dollar opportunity of USD 11.05 billion between 2026 and 2035, positioning diffractive waveguide and integrated display module manufacturers as priority allocations for consumer AR infrastructure investors.
According to Next Move Strategy Consulting analysis, consumer electronics brands are increasingly vertically integrating waveguide combiner production with optical engine design, reflecting stakeholder demand for tighter form-factor and weight optimization across smart glasses platforms.
What Does the Waveguide Display Market Encompass?
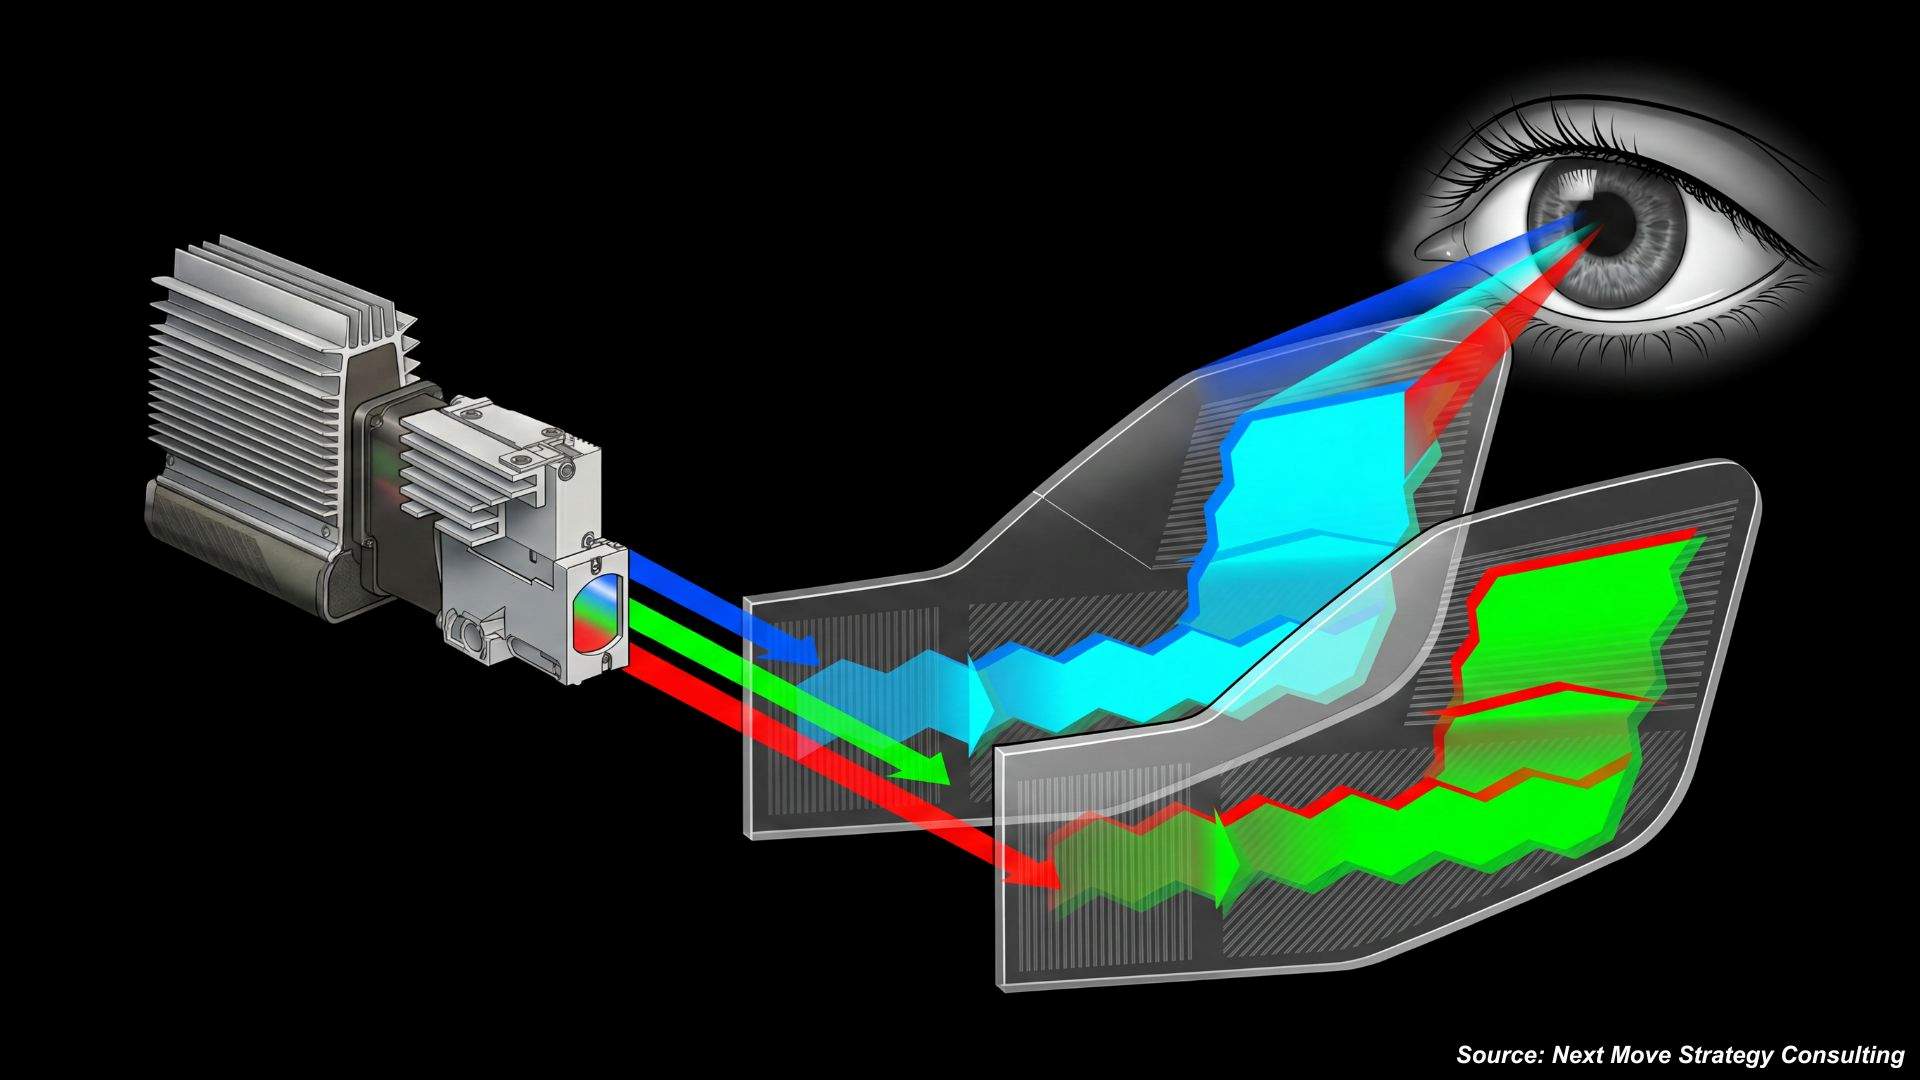
The waveguide display market encompasses reflective, diffractive, and hybrid waveguide combiner components, optical engines, and integrated display modules deployed across AR smart glasses, mixed reality headsets, automotive head-up displays, and defense visualization systems. Our analysis shows that the market has evolved from early defense and aerospace head-up display applications toward mainstream consumer AR smart glasses as optical manufacturing yields improve and unit costs decline.
Regulatory frameworks including U.S. Federal Communications Commission device certification requirements and European Union eyewear safety directives shape waveguide product compliance across covered geographies. We found that technology adoption trends, including surface relief grating manufacturing scale-up and micro-LED optical engine integration, are accelerating differentiation among established optics vendors and specialty waveguide fabricators.
|
Parameters |
Details |
|
Market Size in 2025 |
USD 0.85 Billion |
|
Market Size in 2026 |
USD 1.15 Billion |
|
Revenue Forecast in 2035 |
USD 12.20 Billion |
|
Growth Rate |
CAGR of 30.00% from 2026 to 2035 |
|
Analysis Period |
2025-2035 |
|
Base Year Considered |
2025 |
|
Forecast Period |
2026-2035 |
|
Market Size Estimation |
Revenue (USD Billion) |
|
Companies Profiled |
20 |
|
Countries Covered |
38 |
|
Market Share |
Available for Top 10 Companies |
Key Emerging Trends
Based on research conducted by Next Move Strategy Consulting, we found that four structural trends are reshaping how device makers select waveguide display technologies.
How Is Surface Relief Grating Manufacturing Scale-Up Transforming Cost Structures?
Surface relief grating manufacturing scale-up is transforming cost structures by enabling higher wafer-level production yields for diffractive waveguide combiners. We observed that Dispelix Oy has expanded its nanoimprint lithography production capacity, reducing per-unit optical component costs for consumer AR customers. This transformation is reshaping procurement economics across high-volume smart glasses programs.
Why Is Full Color Waveguide Adoption Accelerating Among Consumer AR Brands?
Full color waveguide adoption is accelerating as consumer AR brands seek richer visual experiences beyond monochrome notification displays. Our assessment indicates that device makers increasingly specify full color optical engines paired with waveguide combiners, directly impacting component sourcing decisions and vendor differentiation strategies across premium smart glasses tiers.
How Is Automotive Head-Up Display Integration Expanding Waveguide Demand?
Automotive head-up display integration is expanding waveguide demand as automakers embed wider field-of-view combiners into windshield-projected navigation and safety alert systems. Our findings suggest that automotive suppliers increasingly favor waveguide designs offering compact packaging, with WayRay AG reporting expanded automotive program engagements tied to holographic display integration.
What Role Does Micro-LED Optical Engine Integration Play in Display Innovation?
Micro-LED optical engine integration is emerging within waveguide display systems to deliver higher brightness and lower power consumption than traditional microdisplay engines. We noticed that LetinAR Co., Ltd. has expanded its pin-mirror optical engine compatibility with micro-LED light sources, reflecting broader stakeholder demand for brighter, more power-efficient AR display systems.
Supply Chain Structure of the Waveguide Display Market
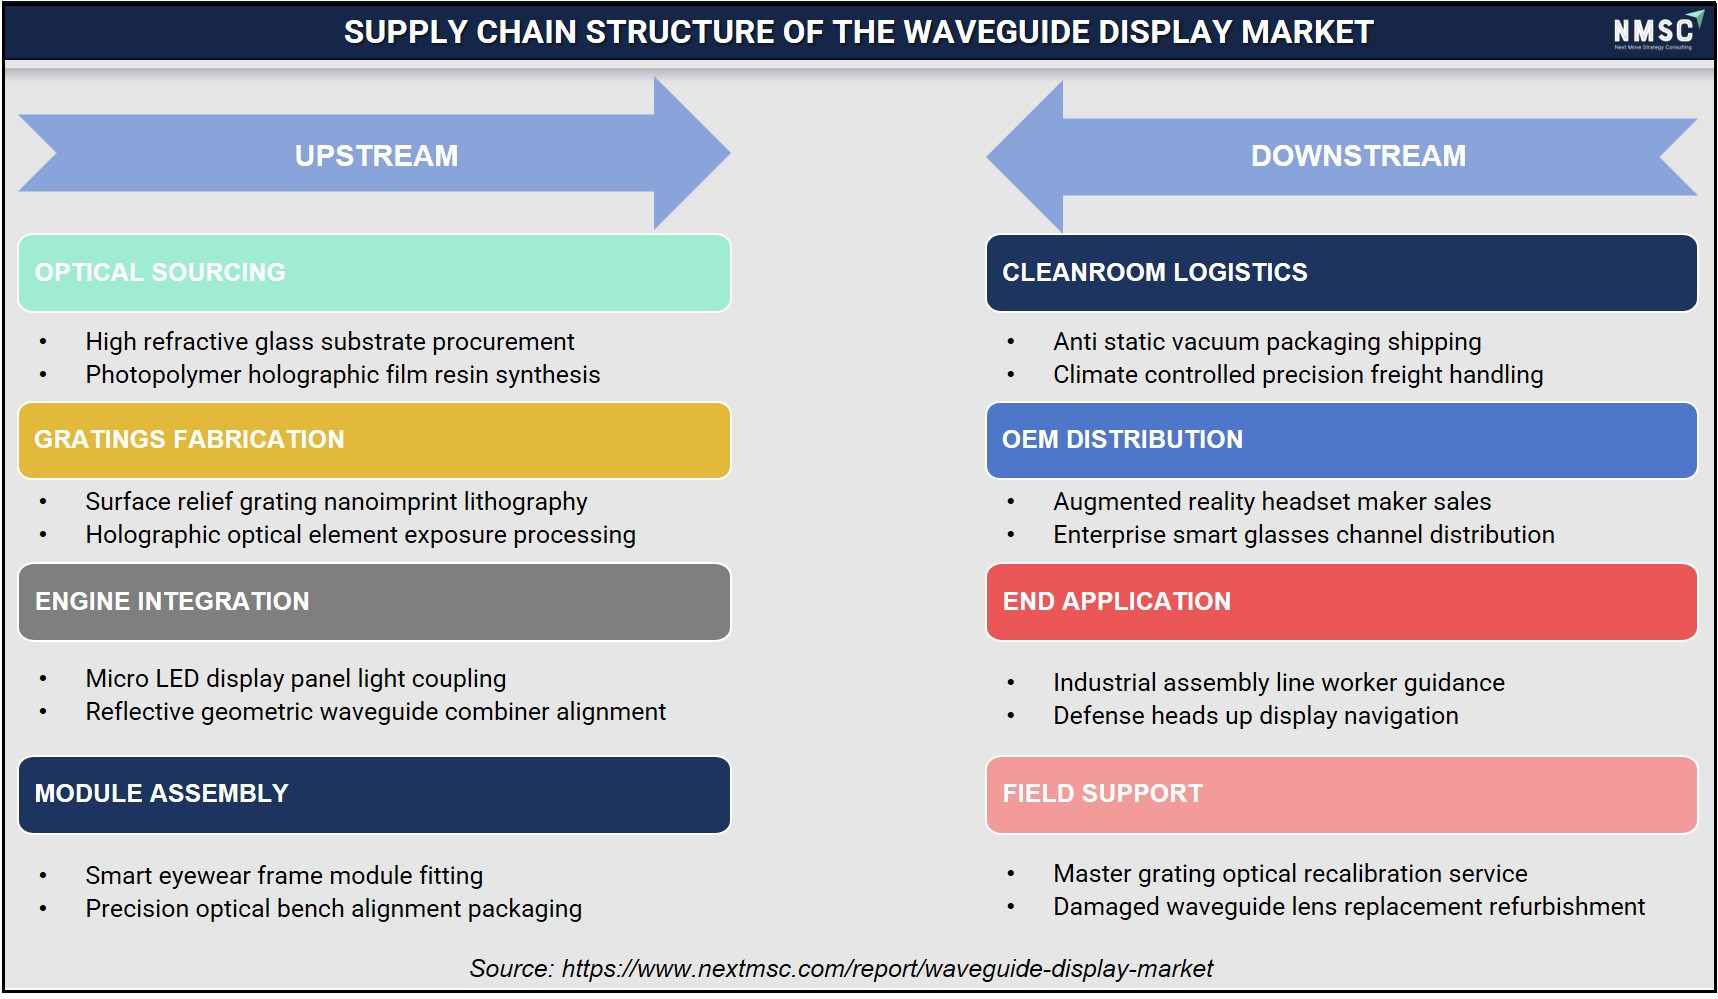
Based on research conducted by NMSC, we found that the supply chain structure of the Waveguide Display Market connects optical sourcing, nanoimprint gratings fabrication, Micro LED light coupling, and precision module assembly with climate-controlled cleanroom freight. Downstream, OEM distribution channels supply displays for industrial worker guidance and defense headsup navigation. Ultimately, master grating recalibration services and lens replacement refurbishments sustain long-term operational performance across field applications.
Growth Drivers and Restraints
Growth Catalyst and Risk Assessment Matrix
|
Factors |
Type |
(+/-) % Impact on CAGR |
Geographic Relevance |
Impact Timeline |
|
Rising consumer AR smart glasses adoption |
Driver |
+8.5% |
North America, Asia-Pacific |
2026-2035 |
|
Expanding automotive head-up display integration |
Driver |
+5.2% |
Europe, Asia-Pacific |
2026-2033 |
|
Growing defense and military visualization investment |
Driver |
+3.4% |
North America, Europe |
2026-2032 |
|
Improving diffractive waveguide manufacturing yields |
Driver |
+2.8% |
Asia-Pacific |
2026-2031 |
|
Rising mixed reality headset enterprise adoption |
Driver |
+2.1% |
North America, Europe |
2026-2035 |
|
High per-unit cost of full color diffractive waveguides |
Restraint |
-3.1% |
Global |
2026-2029 |
|
Limited field of view versus alternative AR display technologies |
Restraint |
-2.0% |
Global |
2026-2030 |
|
Optical component supply chain capacity constraints |
Restraint |
-1.5% |
Asia-Pacific |
2026-2029 |
|
Consumer eye comfort and vergence-accommodation concerns |
Restraint |
-1.1% |
North America, Europe |
2026-2028 |
What Is the Primary Growth Driver of the Waveguide Display Market?
Rising consumer AR smart glasses adoption is the primary driver of the market, as consumer electronics brands launch increasingly capable waveguide-based smart glasses products. The U.S. Federal Trade Commission has noted expanding wearable device disclosure filings across major consumer electronics manufacturers, prompting waveguide component vendors to fund capacity expansion aimed at meeting rising order volumes.
How Is Automotive Head-Up Display Integration Driving Market Growth?
Expanding automotive head-up display integration is driving market growth as automakers embed waveguide combiners into next-generation windshield display systems. The National Highway Traffic Safety Administration has noted increasing adoption of advanced driver assistance display technologies, industry-derived estimate indicating meaningful waveguide demand growth across premium and mid-tier vehicle segments.
What Is Restraining Waveguide Display Market Expansion?
High per-unit cost of full color diffractive waveguides is restraining market expansion, particularly across price-sensitive consumer device segments. The U.S. National Institute of Standards and Technology has noted precision nanofabrication cost pressures affecting optical component pricing, and industry-derived estimates indicate that cost sensitivity disproportionately affects mass-market smart glasses adoption.
Segmentation Analysis
Segment Sizing: By Offering Tier
|
Segment |
2025 (USD) |
2035 (USD) |
CAGR% (2026-2035) |
|
Waveguide Combiner Components |
USD 0.42 Billion |
USD 5.70 Billion |
29.2% |
|
Optical Engines |
USD 0.19 Billion |
USD 2.90 Billion |
30.9% |
|
Integrated Display Modules |
USD 0.14 Billion |
USD 2.40 Billion |
32.6% |
|
Intellectual Property and Licensing |
USD 0.06 Billion |
USD 0.70 Billion |
27.1% |
|
NRE and Manufacturing Services |
USD 0.04 Billion |
USD 0.50 Billion |
28.1% |
|
Total |
USD 0.85 Billion |
USD 12.20 Billion |
30.00% |
Which Offering Tier Segment Dominates the Waveguide Display Market?
Waveguide Combiner Components led the market, valued at USD 0.42 billion in 2025 and projected to reach USD 5.70 billion by 2035, supported by sustained demand for reflective and diffractive optical elements across all device categories. Integrated Display Modules is the fastest-growing sub-segment at a CAGR of 32.6%, driven by rising demand for pre-assembled smart glasses and headset modules among device makers seeking faster time-to-market.
Segment Sizing: By End Device Form Factor
|
Segment |
2025 (USD) |
2035 (USD) |
CAGR% (2026-2035) |
|
AR Smart Glasses |
USD 0.38 Billion |
USD 6.30 Billion |
32.1% |
|
Mixed Reality Headsets |
USD 0.19 Billion |
USD 2.60 Billion |
29.3% |
|
Automotive Head Up Displays |
USD 0.12 Billion |
USD 1.65 Billion |
29.4% |
|
Aerospace Head Up Displays |
USD 0.06 Billion |
USD 0.62 Billion |
25.4% |
|
Helmet Mounted Displays |
USD 0.04 Billion |
USD 0.45 Billion |
26.6% |
|
Medical Visualization Devices |
USD 0.03 Billion |
USD 0.30 Billion |
24.7% |
|
Industrial Wearables |
USD 0.02 Billion |
USD 0.18 Billion |
23.5% |
|
Other Devices |
USD 0.01 Billion |
USD 0.10 Billion |
24.9% |
|
Total |
USD 0.85 Billion |
USD 12.20 Billion |
30.00% |
Which End Device Form Factor Segment Is Growing Fastest?
AR Smart Glasses is both the dominant and fastest-growing end device form factor segment, expanding at a CAGR of 32.1% between 2026 and 2035, driven by accelerating consumer adoption of lightweight, all-day-wearable smart glasses. Mixed Reality Headsets and Automotive Head Up Displays continue to expand steadily through enterprise and automotive integration programs respectively.
Segment Sizing: By End User Industry
|
Segment |
2025 (USD) |
2035 (USD) |
CAGR% (2026-2035) |
|
Consumer Electronics |
USD 0.44 Billion |
USD 7.30 Billion |
32.1% |
|
Automotive |
USD 0.14 Billion |
USD 1.85 Billion |
28.8% |
|
Commercial Aerospace |
USD 0.07 Billion |
USD 0.75 Billion |
25.8% |
|
Defense and Military |
USD 0.09 Billion |
USD 1.15 Billion |
28.3% |
|
Healthcare |
USD 0.04 Billion |
USD 0.55 Billion |
29.4% |
|
Industrial and Manufacturing |
USD 0.03 Billion |
USD 0.30 Billion |
24.7% |
|
Research and Education |
USD 0.03 Billion |
USD 0.22 Billion |
20.5% |
|
Other Industries |
USD 0.01 Billion |
USD 0.08 Billion |
21.9% |
|
Total |
USD 0.85 Billion |
USD 12.20 Billion |
30.00% |
Which End User Industry Segment Leads the Market?
Consumer Electronics dominated the market, reaching USD 0.44 billion in 2025 and expanding at the fastest CAGR of 32.1%, driven by accelerating smart glasses commercialization among major device brands. Defense and Military maintains a stable, technology-driven demand base, while Healthcare is emerging as a notable growth contributor through surgical visualization applications.
Growth Opportunities
Our analysis shows that three forward-looking opportunities stand out for stakeholders positioning within the waveguide display market.
How Can Full Color Diffractive Waveguides Unlock Value for Premium Smart Glasses Brands?
Full color diffractive waveguide combiners offering wider color gamut present a whitespace opportunity for premium smart glasses brands seeking to differentiate visual experience quality against monochrome notification-only competitors.
Where Does Wide Field of View Waveguide Design Create Demand in Enterprise Mixed Reality?
Waveguide designs achieving 60-degree-and-above field of view create an underpenetrated opportunity across enterprise mixed reality headset applications, where immersive training and design visualization use cases require broader visual coverage than current consumer-oriented combiners provide.
How Can Foundry-Model Manufacturing Services Benefit Emerging Device Makers?
Foundry and contract manufacturing services offering pilot build and mass production support create an opportunity for emerging device makers lacking in-house optical fabrication capability to bring waveguide-based products to market faster.
Regional Outlook
Geographic Performance Snapshot
|
Region |
2025 (USD) |
2035 (USD) |
CAGR% (2026-2035) |
Key Driver |
|
Asia-Pacific |
USD 0.38 Billion |
USD 5.20 Billion |
29.3% |
Optical component manufacturing scale |
|
North America |
USD 0.24 Billion |
USD 4.10 Billion |
32.5% |
Consumer AR smart glasses commercialization |
|
Europe |
USD 0.13 Billion |
USD 1.90 Billion |
30.3% |
Automotive head-up display integration |
|
Middle East & Africa |
USD 0.06 Billion |
USD 0.60 Billion |
24.9% |
Defense visualization investment |
|
Latin America |
USD 0.04 Billion |
USD 0.40 Billion |
24.9% |
Expanding consumer electronics distribution |
Asia-Pacific Waveguide Display Market Outlook
Asia-Pacific leads the market with a concentrated optical component manufacturing ecosystem and established vendor base spanning Goertek Inc. and Sunny Optical Technology (Group) Company Limited. Regulatory support for domestic semiconductor and optics investment under national technology strategies shapes production capacity expansion, while consumer electronics assembly scale continues to anchor demand across the region.
North America Waveguide Display Market Outlook
North America is the fastest-growing region, propelled by accelerating consumer AR smart glasses commercialization among major device brands and expanding defense visualization program funding. Technology adoption is accelerating among consumer electronics and defense customers as domestic waveguide component sourcing gains strategic priority.
Europe Waveguide Display Market Outlook
Europe's market reflects an automotive-focused landscape shaped by expanding head-up display integration across premium vehicle manufacturers. Strategic outlook favors vendors demonstrating automotive-grade reliability certification, with TriLite Technologies GmbH maintaining a strong regional footprint across Germany and continental Europe.
Middle East & Africa Waveguide Display Market Outlook
The market in Middle East & Africa is expanding as governments invest in defense visualization and aerospace modernization programs. Regulatory support for expanded defense technology procurement in Saudi Arabia and the UAE is accelerating institutional waveguide adoption across the region.
Latin America Waveguide Display Market Outlook
Latin America's market is supported by expanding consumer electronics distribution alongside growing automotive head-up display interest in Brazil and Argentina. Strategic outlook favors vendors offering cost-efficient waveguide platforms tailored to the region's developing consumer AR and automotive markets.
U.S. Waveguide Display Market
Based on our estimates, the U.S. market was valued at approximately USD 0.18 billion in 2025 and is projected to reach USD 3.15 billion by 2035, expanding at a CAGR of 32.9%. Demand structure reflects strong consumer AR smart glasses commercialization, high technology penetration, and competitive intensity among established optics and device vendors, supported by a favorable regulatory environment for wearable device innovation.
Canada Waveguide Display Market
The market in Canada reached roughly USD 0.035 billion in 2025 and is forecast to hit USD 0.50 billion by 2035 at a CAGR of 30.0%. Adoption levels are rising within defense visualization and enterprise mixed reality programs, supported by federal technology funding and growing competitive intensity among regional and multinational optics vendors.
UK Waveguide Display Market
As per our estimate, the UK market stood at about USD 0.045 billion in 2025, advancing toward USD 0.68 billion by 2035 at a CAGR of 30.8%. Regulatory influence from eyewear safety directive statutes shapes vendor selection, while defense and aerospace customers show strong demand structure for head-up display waveguides amid rising technology penetration.
Germany Waveguide Display Market
According to our analysis, Germany's market was valued near USD 0.035 billion in 2025 and is set to reach USD 0.52 billion by 2035, growing at a CAGR of 30.5%. Strategic outlook favors vendors offering automotive-grade waveguide designs, with automotive suppliers showing strong adoption levels amid rising competitive intensity.
France Waveguide Display Market
Based on our estimates, France's market reached approximately USD 0.020 billion in 2025, projected to climb to USD 0.28 billion by 2035 at a CAGR of 29.6%. Demand structure reflects growing adoption of aerospace head-up display waveguides, supported by national aerospace funding and moderate competitive intensity.
China Waveguide Display Market
The market in China was valued at approximately USD 0.16 billion in 2025 and is projected to reach USD 2.30 billion by 2035 at a CAGR of 30.0%. Adoption levels are accelerating rapidly across domestic consumer electronics and optical component manufacturing, supported by strong government technology investment and intense competitive activity among domestic waveguide vendors.
India Waveguide Display Market
As per our estimate, India's market stood at roughly USD 0.04 billion in 2025, advancing toward USD 0.75 billion by 2035 at a CAGR of 33.9%, the fastest among covered countries. Demand structure reflects rapid consumer electronics-driven adoption, strong government digital technology policy support, and rising competitive intensity among domestic and multinational vendors.
Japan Waveguide Display Market
According to our analysis, Japan's market reached approximately USD 0.08 billion in 2025 and is forecast to reach USD 0.95 billion by 2035 at a CAGR of 27.3%. Technology penetration remains high, with optical component manufacturing adoption supported by precision engineering research initiatives amid moderate regulatory influence.
South Korea Waveguide Display Market
Based on our estimates, South Korea's market was valued at about USD 0.06 billion in 2025, projected to reach USD 0.75 billion by 2035 at a CAGR of 28.0%. Strong government display technology investment funding and strategic outlook favoring domestic optical component development support rising adoption levels across consumer electronics manufacturers.
Australia Waveguide Display Market
The market in Australia reached roughly USD 0.02 billion in 2025 and is expected to reach USD 0.22 billion by 2035 at a CAGR of 26.2%. Demand structure reflects growing enterprise mixed reality adoption, supported by favorable regulatory environment and moderate competitive intensity among regional distributors.
UAE Waveguide Display Market
As per our estimate, the UAE market stood at approximately USD 0.020 billion in 2025, advancing toward USD 0.20 billion by 2035 at a CAGR of 24.9%. Strategic outlook favors waveguide platforms aligned with national defense modernization goals, supported by strong government funding and rising technology penetration across regional defense programs.
Saudi Arabia Waveguide Display Market
According to our analysis, Saudi Arabia's market reached approximately USD 0.025 billion in 2025 and is projected to reach USD 0.25 billion by 2035 at a CAGR of 24.9%. Demand structure is shaped by Vision 2030 defense and technology modernization funding, supporting rising adoption levels across visualization and training programs.
South Africa Waveguide Display Market
Based on our estimates, South Africa's market was valued at about USD 0.010 billion in 2025, advancing toward USD 0.10 billion by 2035 at a CAGR of 24.9%. Adoption levels remain constrained by infrastructure gaps, though rising consumer electronics investment and government technology programs support gradual demand structure growth.
Brazil Waveguide Display Market
The market in Brazil reached approximately USD 0.028 billion in 2025 and is forecast to reach USD 0.28 billion by 2035 at a CAGR of 24.9%. Demand structure reflects growing consumer electronics distribution activity, supported by expanding automotive head-up display interest and moderate competitive intensity among regional distributors.
Argentina Waveguide Display Market
As per our estimate, Argentina's market stood at roughly USD 0.008 billion in 2025, advancing toward USD 0.08 billion by 2035 at a CAGR of 24.9%. Technology penetration is rising steadily, with consumer electronics distributors showing increasing adoption of waveguide-based devices amid a stabilizing regulatory environment.
Ecosystem Analysis of the Waveguide Display Market
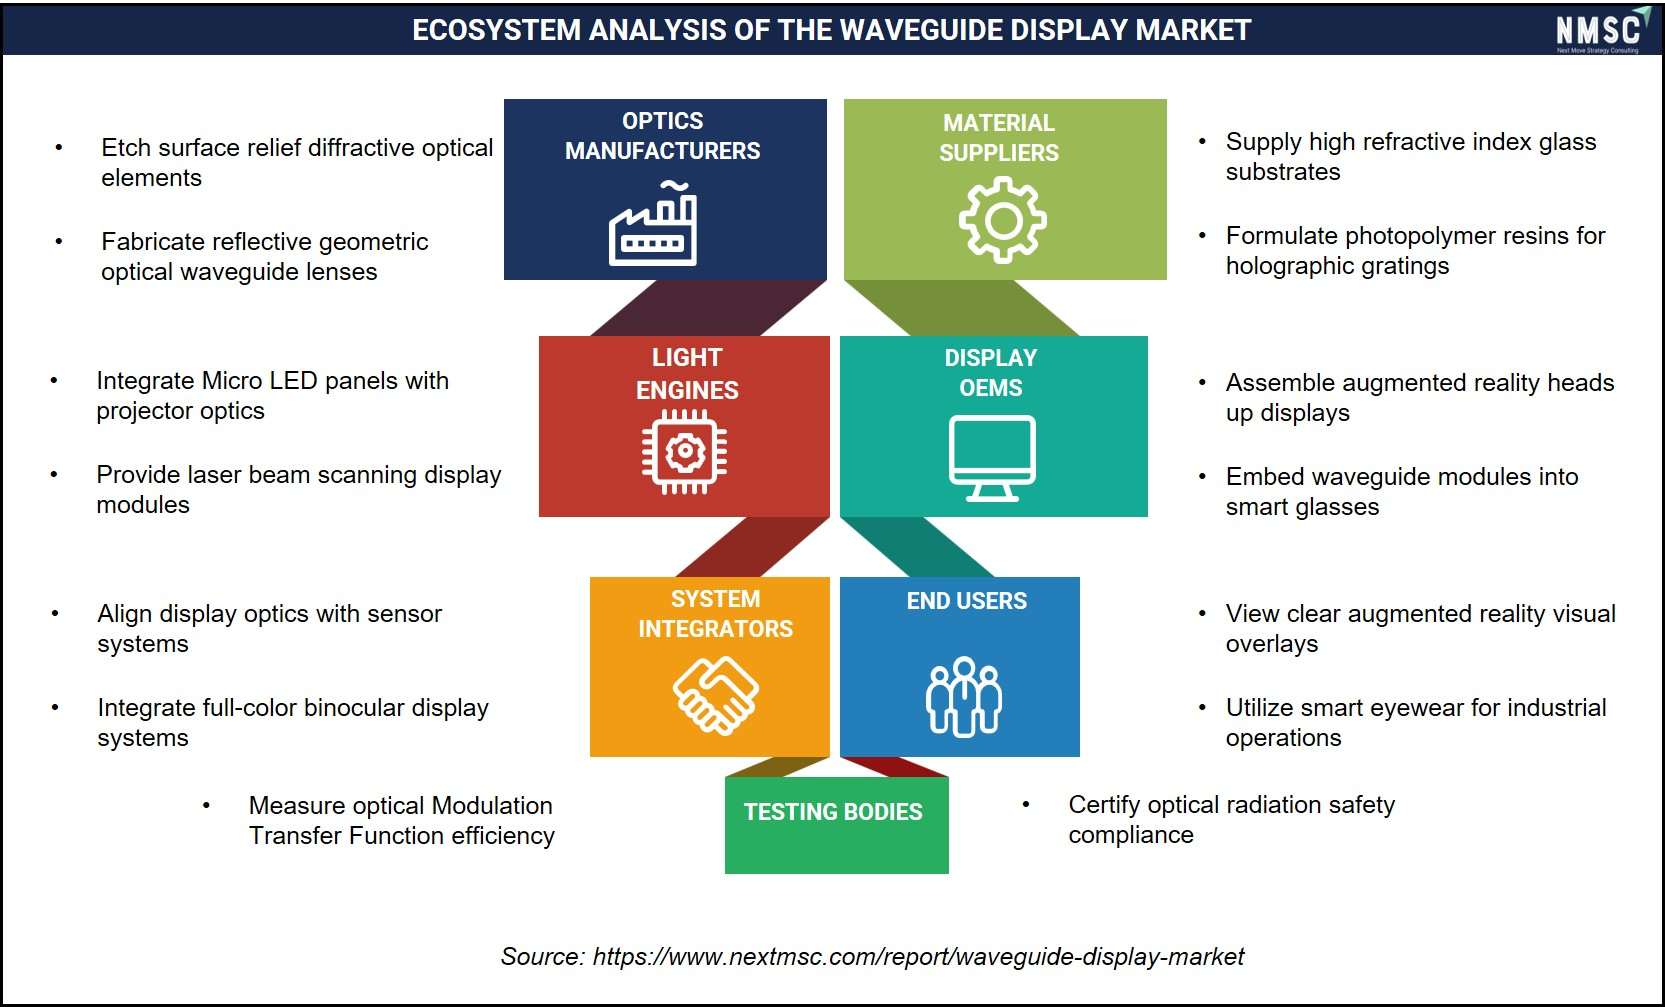
NMSC's analysis indicates that the Waveguide Display Market functions within an ecosystem uniting optics manufacturers, material suppliers, light engine developers, and display OEMs. System integrators align display optics with sensor systems to enable clear augmented reality overlays for end users. Ultimately, independent testing bodies measure Modulation Transfer Function efficiency and certify optical radiation safety compliance, ensuring product safety and performance across market applications.
Competitive Landscape
We found that the competitive landscape is moderately fragmented, with specialty optics designers competing alongside diversified consumer electronics component manufacturers across the Industry.
|
Dimension |
Details |
|
Market Structure |
Moderately fragmented, with 20 profiled vendors spanning specialty waveguide designers and diversified optical component manufacturers |
|
Innovation Focus |
Surface relief grating manufacturing scale-up, full color optical engine integration, and wide field-of-view combiner design |
|
M&A Activity |
Selective acquisitions of specialty waveguide design firms by larger optical component and consumer electronics manufacturers |
How Do Companies Compete in the Waveguide Display Market?
Companies compete primarily on optical efficiency and field-of-view performance, manufacturing yield and cost efficiency, and depth of integration support offered to consumer electronics and automotive customers. Pricing strategies increasingly favor volume-based supply agreements tied to multi-year device program contracts.
Which Competitive Archetypes Dominate the Waveguide Display Industry?
Three archetypes dominate the Industry: specialty waveguide design pioneers such as Lumus Ltd. offering proprietary reflective optics, diffractive waveguide fabricators such as Dispelix Oy focused on nanoimprint manufacturing scale, and diversified consumer electronics component manufacturers such as Goertek Inc. emphasizing integrated module production capacity.
What Innovation and Differentiation Strategies Are Vendors Pursuing?
Vendors are differentiating through proprietary grating design intellectual property, expanded full color optical engine compatibility, and manufacturing partnership programs with device brands, aiming to strengthen defensibility against commoditized generic waveguide offerings from smaller entrants.
What M&A Activity Is Shaping the Competitive Landscape?
M&A activity has concentrated on acquisitions of specialty waveguide design and nanofabrication technology firms by larger optical component manufacturers seeking to accelerate proprietary combiner capability development rather than build such functionality internally, reflecting broader industry consolidation trends.
Key Market Players
We found that the following companies represent the leading providers of waveguide displays based on market-specific revenue and scale of operations as of 2026.
-
Lumus Ltd.
-
Goertek Inc.
-
AAC Technologies Holdings Inc.
-
Sunny Optical Technology (Group) Company Limited
-
DigiLens Inc.
-
Dispelix Oy
-
Vuzix Corporation
-
Crystal-Optech Co., Ltd.
-
Cellid Inc.
-
LetinAR Co., Ltd.
-
North Ocean Photonics Technology Co., Ltd.
-
GreatAR Technology Co., Ltd.
-
HUYNEW Technology Co., Ltd.
-
Optinvent S.A.
-
Myrias Optics, Inc.
-
WayRay AG
-
TriLite Technologies GmbH
-
TruLife Optics Ltd.
-
Meta Materials Inc.
-
Sony Semiconductor Solutions Corporation
Latest Developments
We observed the following recent developments shaping vendor positioning and optical capability within the market.
|
Date |
Event |
|
April 2026 |
Vuzix Corporation secured a six-figure, customer-funded development order from a leading Tier-1 aerospace and defense supplier. The contract funds custom engineering and design services for a next-generation waveguide-based head-mounted display system, advancing the program toward a production-ready solution for tactical military applications. |
|
January 2026 |
Lumus unveiled its next-generation geometric waveguides at CES 2026, including ZOE, its first geometric waveguide to exceed a 70° field of view, while targeting high brightness, transparency, efficiency, and lightweight wearability for consumer AR glasses. |
|
November 2025 |
AAC Technologies Holdings Inc., through its subsidiary AAC Technologies Pte. Ltd., signed a definitive agreement to acquire all shares and equity securities of Dispelix Oy. Upon transaction completion in the first half of 2026, Dispelix will operate as a fully owned subsidiary under AAC Technologies. |
Investment Opportunities
What Capital Inflows Are Supporting Market Expansion?
Corporate and venture capital investment continues to flow into diffractive waveguide manufacturing and micro-LED optical engine startups. Our findings suggest that investor interest is concentrated on companies demonstrating measurable manufacturing yield improvements alongside recurring multi-year device brand supply agreements.
How Is Infrastructure Investment Shaping Waveguide Manufacturing Scalability?
Manufacturing capacity investment by established producers, including AAC Technologies Holdings Inc. and Crystal-Optech Co., Ltd., underpins waveguide scalability for expanding consumer electronics and automotive demand. This infrastructure investment supports consistent optical quality across geographically distributed production facilities.
What ESG Considerations Are Relevant to Market Investment?
Environmental, Social, and Governance considerations increasingly influence investment decisions, with device makers evaluating vendor rare material sourcing practices and manufacturing energy efficiency commitments. Government funding programs in several regions now require ESG disclosure as a condition of technology development grant eligibility.
Key Benefits for Stakeholders
How Does This Report Benefit Industry Leaders?
Industry leaders gain access to detailed segmentation, regional forecasts, and competitive benchmarking that support component investment and supply agreement decisions across consumer AR, automotive, and defense visualization markets.
How Does This Report Benefit Investors and Financial Analysts?
Investors and financial analysts benefit from validated market sizing, CAGR forecasts, and company-level competitive positioning that inform capital allocation decisions across the waveguide display value chain.
How Does This Report Benefit Technology Vendors and Product Teams?
Technology vendors and product teams gain insight into emerging trends, growth opportunities, and regional demand patterns that inform optical component development prioritization and go-to-market strategy across covered geographies.
Key Market Segments
By Offering Tier
-
Waveguide Combiner Components
-
Reflective Waveguide
-
Geometric Reflective
-
Mirror Array
-
Freeform Reflective
-
Prism Based
-
Other Reflective
-
-
Diffractive Waveguide
-
Surface Relief Grating (SRG)
-
Volume Holographic Grating (VHG)
-
Polarization Volume Grating (PVG)
-
Other Diffractive
-
-
Hybrid Waveguide
-
Reflective and Diffractive Hybrid
-
Other Hybrid
-
-
-
Optical Engines
-
Microdisplay Engine
-
Projection Engine
-
Laser Beam Scanning Engine
-
Other Optical Engines
-
-
Integrated Display Modules
-
Smart Glasses Module
-
Headset Module
-
Head Up Display Module
-
Other Modules
-
-
Intellectual Property and Licensing
-
Design IP
-
Process IP
-
Manufacturing License
-
Other Licensing
-
-
NRE and Manufacturing Services
-
Optical Design Services
-
Pilot Build Services
-
Mass Production Services
-
Test and Calibration Services
-
By Substrate Material
-
High Refractive Index Glass
-
Optical Polymer
-
Silicon Carbide
-
Hybrid Glass and Polymer
-
Other Materials
By Display Configuration
-
Monocular Display
-
Binocular Display
By Color Capability
-
Monochrome Display
-
Full Color Display
By Field of View
-
0°–29°
-
30°–39°
-
40°–49°
-
50°–59°
-
60° and Above
By Sales Channel
-
Direct OEM Sales
-
Foundry and Contract Manufacturing
-
Distributor Sales
By End Device Form Factor
-
AR Smart Glasses
-
Mixed Reality Headsets
-
Automotive Head Up Displays
-
Aerospace Head Up Displays
-
Helmet Mounted Displays
-
Medical Visualization Devices
-
Industrial Wearables
-
Other Devices
By End User Industry
-
Consumer Electronics
-
Automotive
-
Commercial Aerospace
-
Defense and Military
-
Healthcare
-
Industrial and Manufacturing
-
Research and Education
-
Other Industries
By Region
-
North America: U.S., Canada, Mexico
-
Europe: UK, Germany, France, Italy, Spain, Sweden, Denmark, Finland, Netherlands, Rest of Europe
-
Asia-Pacific: China, India, Japan, South Korea, Taiwan, Indonesia, Vietnam```html , Australia, Philippines, Malaysia, Rest of APAC
-
Middle East & Africa: Saudi Arabia, UAE, Egypt, Israel, Turkey, Nigeria, South Africa, Rest of MEA
-
Latin America: Brazil, Argentina, Chile, Colombia, Rest of LATAM
Conclusion and Recommendations
What Is the Long-Term Outlook for the Market?
The long-term outlook remains strongly positive, with the market projected to expand from USD 1.15 billion in 2026 to USD 12.20 billion by 2035 as consumer AR smart glasses and automotive head-up display integration deepen across device categories.
What Strategic Positioning Should Vendors Pursue?
Vendors should prioritize full color optical engine compatibility and manufacturing yield improvement to differentiate against monochrome legacy offerings, while pursuing strategic partnerships with consumer electronics brands to strengthen integrated module credibility.
How Attractive Is the Market for Investment?
Investment attractiveness remains high given sustained strong CAGR expectations and expanding consumer AR commercialization, though investors should weigh high per-unit component costs and optical supply chain capacity constraints affecting near-term scaling.
What Market Shifts and Key Risks Should Stakeholders Monitor?
Stakeholders should monitor evolving field-of-view performance benchmarks, optical component supply chain capacity, and potential shifts in consumer device adoption cycles, each of which could affect procurement timelines across covered geographies.
What Are the Primary Growth Pathways for Market Participants?
Primary growth pathways include expansion into underpenetrated enterprise mixed reality markets, deeper full color optical engine integration, and strategic acquisition of nanofabrication startups to accelerate proprietary manufacturing capability development.
About the Author
 Saista Faiyaz
— Saista Faiyaz is Research Associate at Next Move Strategy Consulting, where she has covered consumer markets and healthcare technologies for 3 years. Her work includes primary interview review, secondary-source validation, market sizing, and structured analysis of company and industry data. She supports research by comparing evidence across sources, organizing findings into market narratives, and documenting assumptions used in analysis. Her scope includes cross-market benchmarking, and reports.
Saista Faiyaz
— Saista Faiyaz is Research Associate at Next Move Strategy Consulting, where she has covered consumer markets and healthcare technologies for 3 years. Her work includes primary interview review, secondary-source validation, market sizing, and structured analysis of company and industry data. She supports research by comparing evidence across sources, organizing findings into market narratives, and documenting assumptions used in analysis. Her scope includes cross-market benchmarking, and reports.
About the Reviewer
 Supradip Baul
— Supradip Baul is an accomplished business consultant and strategist with over a decade of rich experience in market intelligence, strategy, technology, and business transformation. His work has included rigorous qualitative and quantitative analysis across multiple industries, helping clients shape investment decisions and long-term roadmaps. Earlier in his career, he was associated with Gartner, where he contributed to industry-leading reports and market share analyses. He has worked with leading global companies and holds an MBA with a dual specialization in Marketing and Finance.
Supradip Baul
— Supradip Baul is an accomplished business consultant and strategist with over a decade of rich experience in market intelligence, strategy, technology, and business transformation. His work has included rigorous qualitative and quantitative analysis across multiple industries, helping clients shape investment decisions and long-term roadmaps. Earlier in his career, he was associated with Gartner, where he contributed to industry-leading reports and market share analyses. He has worked with leading global companies and holds an MBA with a dual specialization in Marketing and Finance.
At Next Move Strategy Consulting, we understand that insightful market research is the cornerstone of successful business decisions. That's why we employ a robust and multifaceted approach, combining various methodologies to deliver the most accurate and actionable data for our clients.

Research Landscape
We navigate the world of research with two primary approaches:
Qualitative Approach
Our qualitative research methodologies involve immersive techniques such as in-depth interviews, focus groups, and observational studies. By engaging directly with individuals and stakeholders, we uncover valuable insights that quantitative data alone may overlook.

Quantitative Research
In tandem with qualitative methodologies, NMSC leverages the power of Quantitative Research to provide a robust foundation of numerical insights. Through systematic data collection and analysis, we quantify patterns, preferences, and market trends, offering a comprehensive view of the business landscape.
Our quantitative research approach employs diverse tools, including surveys, experiments, and statistical modelling. These methodologies enable us to gather data from a large and representative sample, ensuring the statistical significance of our findings. By employing structured questionnaires and standardized data collection methods, we guarantee the reliability and validity of the information we present to our clients.
Quantitative research is particularly effective in measuring the prevalence of trends, assessing market size, and gauging the impact of various factors on consumer behavior. The numerical precision attained through this approach equips our clients with actionable insights, facilitating data-driven decision-making and strategy formulation.


Our Specialized Toolbox for Industry-Specific Market Research
We deploy a specialized arsenal of techniques tailored to meet your unique requirements. Here's a glimpse into our comprehensive toolbox:

Information Procurement
The stage entails acquiring market data or relevant information through various sources and methodologies.


Market Research Approach
We utilize both top-down and bottom-up approaches in market research analysis to achieve a comprehensive understanding of the market dynamics, leveraging the broad perspective of industry trends and macroeconomic factors alongside detailed insights from specific segments and individual companies.

Porters Five Forces Analysis
We conduct Porter's Five Forces analysis to evaluate the competitive landscape of an industry, providing us with insights into factors that affect profitability and strategic positioning.

SWOT Analysis

Forecasting
We utilize a forecasting model to predict future consumption by considering parameters like population, economics, regulations, market competition, drivers, constraints, technology, and pricing. We also employ statistical techniques such as multilinear regression, exponential smoothing, moving average, ARIMA, and Monte Carlo simulations for accurate predictions. In econometric forecasting, we analyzed short-term and long-term event impacts, attributing values based on regulatory frameworks, economic factors, and market events.





 Speak to Our Analyst