Advanced Solar Technologies Market: Why Tandem Cells Meet Tariffs | NextMSC
Introduction
On July 16, 2026, LONGi Green Energy Technology announced that its crystalline silicon-perovskite tandem solar cell had reached a certified conversion efficiency of 35.5%, a result verified by the European Solar Test Installation and well above the 33.7% Shockley-Queisser limit that caps conventional single-junction cells. Three weeks later, on August 6, 2026, the United States signed a Section 232 proclamation that places a 15% tariff and minimum import prices on polysilicon and the products made from it. Laboratory physics and trade policy are now moving in opposite directions, and that collision defines the next phase of the advanced solar technologies market.
According to Next Move Strategy Consulting's Advanced Solar Technologies Market report, the market spans photovoltaic, solar thermal energy, concentrated solar power, passive solar energy and building-integrated photovoltaic technologies, with 2024 as the base year and 2025 to 2030 as the forecast period. NextMSC primary research and analysis identifies growth in solar power generation, expanding industrialization and rising electricity demand as the forces behind adoption, names high upfront cost as the main restraint, and finds North America holding the largest regional share. This article tests those findings against the latest external evidence on technology records, corporate earnings, trade policy and national deployment data.
For More Information: Download FREE Sample on Advanced Solar Technologies Market Report
From Record Cells to Order Books: What Four Recent Events Reveal About Advanced Solar Technologies
LONGi's 35.5% Tandem Record: Silicon-Perovskite Moves From Laboratory to Factory
LONGi Green Energy Technology's July 16, 2026 announcement was the latest step in a measurable sequence. Its tandem cell efficiency stood at 33.9% in November 2023 and 34.6% in June 2024, and a 35.2% result entered the 68th edition of the Solar Cell Efficiency Tables, compiled by a team led by Professor Martin Green, in May 2026. LONGi also reported two tandem module results, 31.4% and 29.4%, both certified by independent international institutions and listed in the efficiency tables. Module-level results matter more commercially than small-area records because they show the architecture surviving transfer to full-size products.
The mechanism is spectral. A silicon bottom cell absorbs longer wavelengths, while a perovskite top layer captures higher-energy light that silicon converts less efficiently, which is why LONGi cites a theoretical ceiling of up to 43% for the architecture against 33.7% for single junctions. For a utility-scale buyer, every additional point of efficiency raises output per module and spreads fixed land, structure and installation cost across more kilowatt-hours.
Chinese Academy of Sciences: A Flexible Perovskite-Organic Tandem Clears a Stability Hurdle
In July 2026, researchers at the Institute of Chemistry of the Chinese Academy of Sciences, led by academician Li Yongfang, reported in Nature a perovskite-organic tandem cell with a certified steady-state efficiency of 28.04%. The device kept 90% of its initial efficiency after 625 hours of continuous illumination, and its wide-bandgap perovskite subcell recorded an open-circuit voltage of 1.42 volts, a record for that class. The efficiency trails the silicon-perovskite record, but the cell is lightweight and mechanically flexible, which opens applications such as portable power and space systems where rigid silicon wafers cannot be used. The team's photo-transformable additive molecule, called TDB, works in two stages: it first stabilizes the perovskite layer and then, once the cell operates in sunlight, binds to microscopic grain boundaries where chemical separation otherwise creates defects. Laboratory efficiency of the full tandem peaked at 28.80%.
First Solar and Nextpower: Two Earnings Reports, Two Positions in the Advanced Solar Technologies Market
First Solar reported third-quarter 2026 net sales of USD 1.23 billion on October 29, 2026, down 23% year on year because it sold fewer modules to third parties, yet net income rose 25% to USD 571 million, or USD 5.30 per diluted share. The company cut full-year net sales guidance to USD 4.6 billion to USD 4.9 billion from USD 4.9 billion to USD 5.2 billion, lowered module volume guidance to 16 GW to 17 GW from 17 GW to 18.2 GW, and reported a contracted backlog of 44.0 GW with deliveries scheduled through 2030. According to pv magazine, Mark Widmar, chief executive officer of First Solar, told investors that developers are holding back module procurement for 2029 and 2030 while they contend with interconnection constraints and community pushback over data center projects.
Nextpower, the solar tracker company formerly known as Nextracker, reported fiscal second-quarter 2027 revenue of USD 1,109 million on October 28, 2026, up from USD 905 million a year earlier, with net income of USD 165 million and a backlog above USD 6 billion. Energy storage and complementary products represented about 22% of revenue, and the company signed a 1.1 GW inverter supply agreement with a Tier 1 independent power producer. Nextpower also raised its fiscal 2027 revenue guidance to a range of USD 4.2 billion to USD 4.45 billion.
The two reports describe different exposures. First Solar's U.S. factories ran at 98% utilization in the quarter and its gross margin reached 58%, about 20 percentage points above the prior-year quarter, according to pv magazine, even as customers deferred purchase decisions. Nextpower, which sells structures and electrical balance-of-system equipment, is extending a tracker franchise into storage, inverters and power conversion, so its revenue is tied to project construction rather than to any single cell technology.
NMSC Strategic Perspective: Efficiency Gains Now Pay Only If the Supply Chain Can Be Built Locally
NextMSC primary research and analysis reads these events as one shift: technology leadership in advanced solar technologies is separating from manufacturing location. A tandem cell that converts sunlight at 35.5% creates value only when it can be produced, certified and delivered at a landed price that clears the buyer's project economics. In the United States, the Section 232 price floors mean that this test is now set by policy rather than by the lowest global quotation, so an efficiency premium must be justified by measurable energy yield.
Three implications follow from NextMSC's assessment. First, perovskite-silicon tandem products are most likely to find early buyers where roof area, land or domestic sourcing carries a premium, because higher output per square meter offsets a higher module price. Second, thin-film and tracker suppliers with domestic production hold pricing power during the transition, as First Solar's margin and Nextpower's backlog indicate. Third, the restraint identified in NextMSC's report, high upfront cost, is shifting from the module itself toward the cost of qualifying a compliant, traceable supply chain.
Section Summary:
Record efficiencies, diverging earnings and new trade rules point to the same conclusion: in advanced solar technologies, performance is necessary but no longer sufficient for commercial success.
-
LONGi's certified 35.5% tandem cell and 31.4% module show silicon-perovskite scaling beyond the laboratory.
-
First Solar's 44.0 GW backlog and Nextpower's USD 6 billion backlog give two views of forward demand.
-
Supply-chain location is becoming a product attribute alongside efficiency.
Industry Impact Analysis: How Trade, Demand and Policy Are Reshaping the Advanced Solar Technologies Market
Section 232 Replaces the Safeguard With Price Floors
The proclamation signed on August 6, 2026 takes effect on December 4, 2026 and replaces the Section 201 safeguard tariff that expired in February 2026. According to White & Case, covered polysilicon derivatives face a 15% ad valorem tariff together with minimum import prices of USD 21 per kilogram for polysilicon, USD 100 per kilogram for ingots and wafers, USD 0.22 per watt for cells and USD 0.38 per watt for modules. Raw polysilicon is subject to the price floor alone, products of the United Kingdom carry a 10% tariff, and the duties stack with antidumping and countervailing duties. Importers whose first arm's-length sale falls below the applicable floor pay the shortfall as an additional duty, with a waiver for fixed-price contracts signed before August 6, 2026. The proclamation also directs the Department of Commerce to monitor for stockpiling of polysilicon and its derivatives ahead of the effective date, and it authorizes an incentive program for companies that invest in U.S. facilities producing polysilicon and its derivatives.
The price floor matters more than the headline tariff rate because it removes the discount that low-cost imported modules held over domestic supply. For context, First Solar reported that its recent U.S. bookings averaged about USD 0.36 per watt, according to pv magazine, which sits just below the USD 0.38 per watt module floor. The four-month window between signing and enforcement gives importers a reason to accelerate procurement before December 4, 2026. On August 26, 2026, The White House added Executive Order 14421, which declared a national emergency over the bulk-power system and restricted foreign-produced bulk-power equipment; the Solar Energy Industries Association said in its Q3 2026 report that the two actions will reshape the economics of a fully domestic solar supply chain.
U.S. Deployment Holds Up While Capacity Shifts Toward Storage
The Solar Energy Industries Association reported in its US Solar Market Insight Q3 2026 that the United States installed 11.4 GWdc of solar in the second quarter of 2026, up 45% year on year, with utility-scale installations of 9.6 GWdc rising 61%. Solar and battery storage together supplied 70% of all new generating capacity added in the first half of 2026, and solar alone supplied 45%. The association expects residential solar to contract 23% in 2026 and counts a safe-harbored project pipeline of more than 200 GWdc that supports annual additions of about 44 GWdc through 2031.
The U.S. Energy Information Administration's August 2026 Short-Term Energy Outlook shows the same pattern in output: solar generation grew 21% in the first half of 2026 compared with the first half of 2025, and utility-scale battery storage is projected to reach almost 65 GW by the end of 2026, up from 17 GW in the first quarter of 2024. The Solar Energy Industries Association lists 75.3 GW of operating U.S. module capacity against 10.6 GW of operating cell capacity, with 14.4 GW and 19.1 GW under construction respectively. That gap explains why the Section 232 action reaches upstream to cells, wafers and polysilicon.
China's Slower Installation Pace Reorders Global Supply
China's National Energy Administration reported on October 26, 2026 that the country added 110.83 GW AC of solar capacity from January to September 2026, 53.9% below the 240.27 GW AC added in the same period of 2025. TaiyangNews noted that the comparison base is inflated, because May 2025 alone saw more than 92 GW AC installed ahead of a pricing-mechanism deadline. September additions of 13.64 GW AC were 41.2% above September 2025. Cumulative solar capacity reached 1,312.87 GW, and by the end of July 2026 solar capacity of 1,286 GW had overtaken coal-fired capacity of 1,285 GW for the first time.
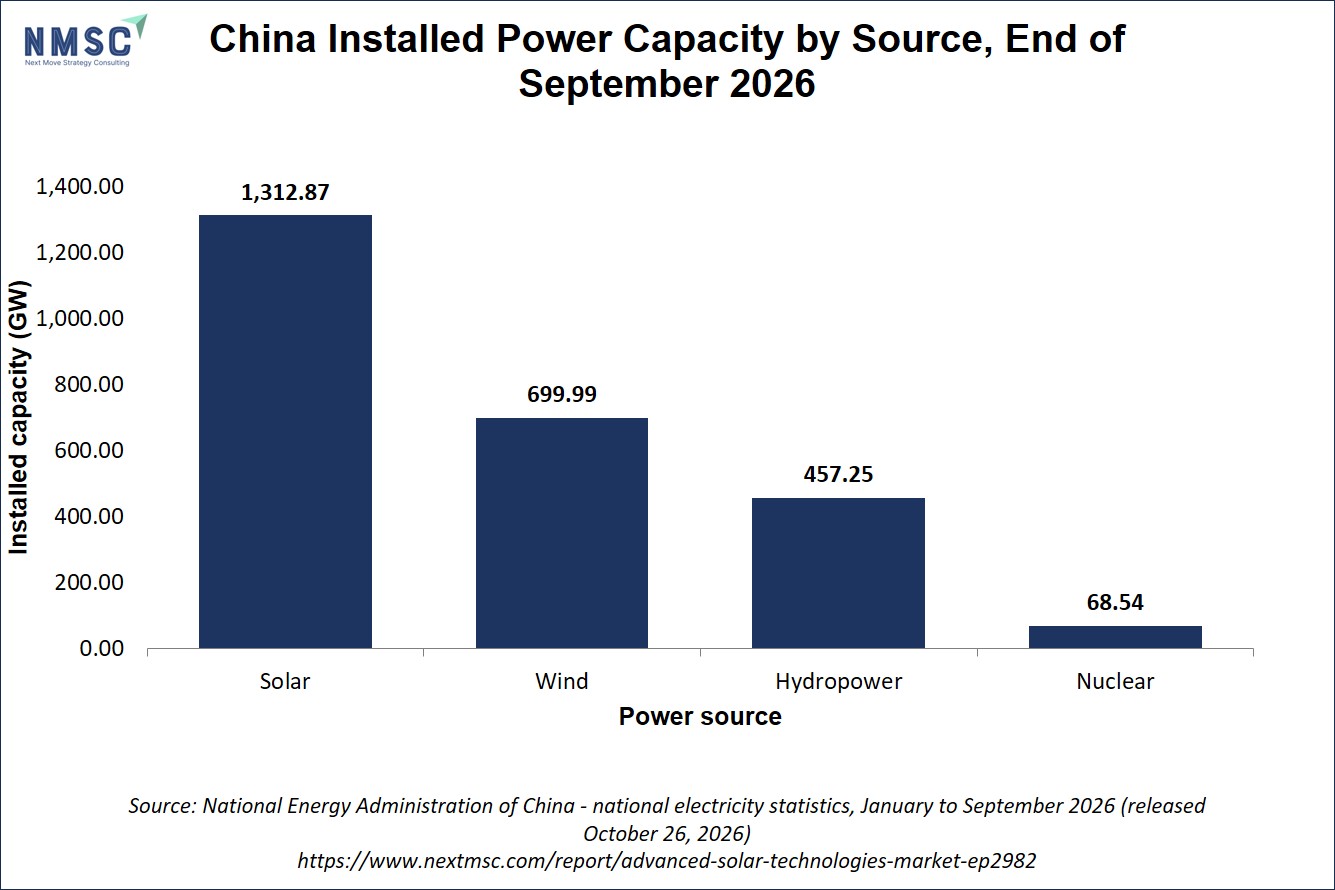
The National Energy Administration's statistics show that China's installed capacity at the end of September 2026 stood at 1,312.87 GW for solar, 699.99 GW for wind, 457.25 GW for hydropower and 68.54 GW for nuclear power. Solar capacity was 16.5% higher than a year earlier and wind capacity was 20.4% higher.
The International Energy Agency's Renewables 2026 report records that China's solar deployment was almost 55% lower in the first nine months of 2026 than a year earlier, and expects China's share of global renewable capacity expansion to fall from more than 60% in 2025 to an average of 53% over 2026 to 2031. NextMSC primary research and analysis expects a slower home market to leave Chinese manufacturers more reliant on technology differentiation and export channels, which links the tandem records announced in July to commercial strategy and not only to research prestige.
India's Cell Mandate Tests a Module-First Supply Chain
India's Ministry of New and Renewable Energy issued an order dated May 25, 2026 declining any blanket extension of the Approved List of Models and Manufacturers List-II deadline, so government-backed, net-metered and open-access projects commissioned from June 1, 2026 must use domestically made cells. Down To Earth reported enlisted module capacity of about 193 GW against enlisted cell capacity of about 31 GW. The International Energy Agency expects India to become the second-largest contributor to global renewable expansion through 2031 and the only country outside China able to manufacture every major component of the solar PV supply chain at scale. NextMSC's report points to the same Asia-Pacific momentum, and the cell gap shows where advanced solar technologies investment will concentrate.
Section Summary:
Policy is now a primary variable in advanced solar technologies, with the United States, China and India each reshaping how and where equipment is made and bought.
-
U.S. price floors take effect on December 4, 2026 and reach from polysilicon to modules.
-
China's nine-month additions fell 53.9% against a record base, while cumulative solar capacity passed 1,312 GW.
-
India's cell mandate exposes a gap of about 193 GW of module capacity against about 31 GW of cell capacity.
Pros and Cons of Recent Market Developments
The table below sets the strongest positive and negative signals for the advanced solar technologies market from the past six months side by side.
|
Pros |
Cons |
|
Certified 35.5% cell and 31.4% module efficiencies show tandem architecture scaling beyond laboratory area. |
Perovskite stability still needs proof beyond the 625 hours of illumination reported for the flexible tandem cell. |
|
Backlogs of 44.0 GW at First Solar and above USD 6 billion at Nextpower give delivery visibility. |
First Solar cut 2026 guidance as developers hold back 2029 and 2030 procurement. |
|
Solar and storage supplied 70% of new U.S. capacity in the first half of 2026. |
The Solar Energy Industries Association expects U.S. residential solar to contract 23% in 2026. |
|
U.S. price floors and India's cell mandate both reward local manufacturing investment. |
India lists about 31 GW of cell capacity against about 193 GW of module capacity. |
|
The International Energy Agency forecasts 3.6 TW of new solar PV additions by 2031. |
The same report warns that curtailment could exceed 800 TWh by 2031 without grid and storage investment. |
Key Data & Statistics
Two reference tables consolidate the trade and demand figures that matter most for planning. The first lists the minimum import prices announced under the Section 232 proclamation.
U.S. Section 232 Minimum Import Prices, Effective December 4, 2026
|
Product |
Minimum Import Price |
Additional 15% Tariff |
|
Polysilicon |
USD 21 per kilogram |
No |
|
Ingots and wafers |
USD 100 per kilogram |
Yes |
|
Solar cells |
USD 0.22 per watt |
Yes |
|
Solar modules |
USD 0.38 per watt |
Yes |
International Energy Agency Renewables 2026: Selected Forecast Metrics
|
Metric |
Value |
|
Global renewable capacity additions, 2026 to 2031 |
Almost 4,800 GW |
|
New solar PV additions, 2026 to 2031 |
3.6 TW |
|
Utility-scale solar PV additions |
2,075 GW |
|
Distributed solar PV additions |
1,530 GW |
|
China's share of renewable expansion |
60% in 2025 to 53% on average |
|
Renewable share of global electricity |
33% in 2025 to almost 45% in 2031 |
|
Wind and solar curtailment |
Almost 200 TWh in 2025; above 800 TWh by 2031 |
Future Outlook & Forecast: What the Advanced Solar Technologies Market Must Solve Before 2030
The International Energy Agency's Renewables 2026 report, published on November 6, 2026, forecasts almost 4,800 GW of new renewable capacity between 2026 and 2031, almost 60% more than in the previous six years, with solar PV accounting for three quarters of the increase. Fatih Birol, executive director of the International Energy Agency, said in the report's release that it is mainly energy security that is driving renewables expansion. For advanced solar technologies, that changes the buyer: governments and grid operators seeking domestic supply now sit alongside developers seeking the lowest cost.
The binding constraint is shifting from panels to the grid. The International Energy Agency reports that grid connection queues for advanced-stage renewable projects rose 60% over the past year to 3 TW, and that hybrid systems pairing solar with batteries can already deliver electricity below USD 75 per megawatt-hour in many regions. It also expects the U.S. to peak above 50 GW of annual solar additions in 2027 before easing to 40 GW in 2031, which matches the Solar Energy Industries Association's view that permitting and interconnection will cap growth.
NextMSC's report sets the forecast window for this market at 2025 to 2030 and identifies smart-grid integration as the main opportunity. The 2026 evidence supports that reading: storage, inverters and power conversion are the product lines gaining share inside Nextpower's revenue, and curtailment forecasts show why. NextMSC primary research and analysis therefore expects competitive advantage to move toward suppliers that combine high-efficiency cells with storage, power electronics and grid-ready software.
Section Summary:
The next growth phase will be set by energy security, grid capacity and storage integration as much as by cell efficiency.
-
The International Energy Agency forecasts 3.6 TW of new solar PV by 2031, of which 2,075 GW is utility-scale.
-
Grid queues of 3 TW and rising curtailment make storage and hybrid design central to project economics.
-
Suppliers that bundle cells, storage and power electronics are best placed to meet security-driven demand.
Next Steps for Stakeholders
The following actions follow from the evidence above and are written for executives, project developers and investors.
-
Manufacturers: map every product against the December 4, 2026 price floors and qualify cell and wafer sources early, because the U.S. module floor of USD 0.38 per watt now sets the competitive reference.
-
Technology developers: publish module-level and stability data, not only cell records, since 31.4% module efficiency and 625 hours of illumination are the figures buyers will test.
-
Developers and EPC firms: pair solar procurement with storage and interconnection planning, given 3 TW of connection queues and the 2029 and 2030 procurement hesitation First Solar described.
-
Investors: separate exposure to tracker, storage and power-conversion revenue from exposure to module price, as Nextpower's 22% share of storage and complementary revenue shows.
-
Policy teams in India and other manufacturing hubs: sequence cell, wafer and polysilicon incentives, since India's 193 GW module base and 31 GW cell base shows the cost of building downstream first.
Conclusion
The past six months show a advanced solar technologies market that is technically ahead of its supply chain. LONGi's certified 35.5% tandem cell and the Chinese Academy of Sciences' flexible tandem prove that the efficiency curve is still rising, while Section 232, India's cell mandate and China's reset determine where those products can be made and sold. NextMSC's report frames the opportunity around solar power generation, industrial demand and smart-grid integration, and the latest evidence confirms that grid-ready, locally producible systems will define winners. Stakeholders who plan for both physics and policy will be positioned to compete through 2030.
About the Author
 Priyanshu Das
— Priyanshu Das is SEO Executive at Next Move Strategy Consulting, where he has led on-page and off-page SEO, keyword research, and SEO audits for the firm's B2B market research publications for 2 years. His audit process combines technical crawl analysis, backlink profile review, and competitor keyword gap mapping — using tools including Screaming Frog and Google Search Console — to prioritize fixes by organic search-visibility impact, informed by his own prior in-house and agency SEO experience.
About the Reviewer
 Debashree Dey
— Debashree Dey is Assistant Manager at Next Move Strategy Consulting, where she supports cross-vertical market content and communications across diverse industries for 6 years. Her professional background includes senior content writing, communications, and published manuscript authorship, with experience developing audience-focused business narratives and maintaining clear, consistent messaging. Her role supports research-led content development and editorial quality across NextMSC publications.














Add Comment