Air Charter Services Market: How Jet Cards and Cargo Offset Fuel | NextMSC

Introduction
On August 6, 2026, Air Charter Service reported that revenue for the first six months of its financial year rose 38% to more than USD 840 million, while charter contracts grew only 16%. The gap matters more than the headline: customers are paying more per flight, for larger aircraft and longer sectors, at a time when jet fuel prices were 103.4% higher in September than a year earlier, according to the International Air Transport Association's data release of October 29, 2026. Charter demand has not retreated under that cost pressure. It has moved toward pre-paid jet cards, cargo missions and event logistics.
According to Next Move Strategy Consulting's Air Charter Services Market report, the global air charter services market was valued at USD 31.39 billion in 2021 and is projected to reach USD 43.43 billion by 2030, growing at a CAGR of 4.8% from 2022 to 2030. NextMSC primary research and analysis segments the market by passenger and cargo charter services, by jets, turboprops, helicopters and charter airliners, and by on-demand, block, fractional, jet card and empty-leg booking models. This article tests that trajectory against the 2026 evidence: which operators are growing, where cost and geopolitical pressure is building, and what investors and executives should monitor before 2030.
For More Information: Download FREE Sample on Air Charter Services Market Report
Air Charter Services Market in 2026: Fuel Doubled, Demand Held, and Revenue Per Contract Rose
Reuters, June 8: Wealthy Travellers Chose Charter Over Disrupted Airlines
On June 8, 2026, Reuters reporters Alessandro Parodi, Tassilo Hummel and Joanna Plucinska reported that private jet bookings were rising even though the Iran war had roughly doubled jet fuel costs since late February. The article cited aviation analytics firm Cirium for a 3% to 4% fall in overall global capacity and WINGX data showing private flights up about 4% worldwide so far in 2026. The mechanism is substitution, not new wealth. Amalfi Jets founder and CEO Kolin Jones told Reuters that requests for Cannes were up about a quarter and requests for the Monaco Grand Prix almost a third, because travellers who previously flew commercial were paying more for protection from cancellations. Platoon Aviation owner Deniz Weissenborn told Reuters that its clients are not bothered by fare increases of 1,000 or 2,000 euros per flight.
Air Charter Service, August 6: Larger Aircraft, Longer Sectors and Jet Cards
Air Charter Service's results for February to July 2026, announced on August 6, show where that substitution landed. Group revenue rose 38% to more than USD 840 million on 16% more charter contracts. Private jet revenue grew 26%, which Chairman and Founder Chris Leach attributed to a larger average aircraft and longer sectors. Jet Card sales rose 85% and Jet Card revenue rose almost 60%. Group charter contracts rose 34% and group revenue 48%, helped by hundreds of World Cup flights and the repatriation of almost 40% of the tournament squads. Cargo delivered the fastest growth in charter numbers: 49% more charters and 38% higher revenue, partly because of Iran-related supply chain disruption, port closures in Morocco after Storm Marta and Venezuelan relief flights. Margins were squeezed slightly because the company absorbed higher fuel costs, while EBITDA still rose 35% to 40%.
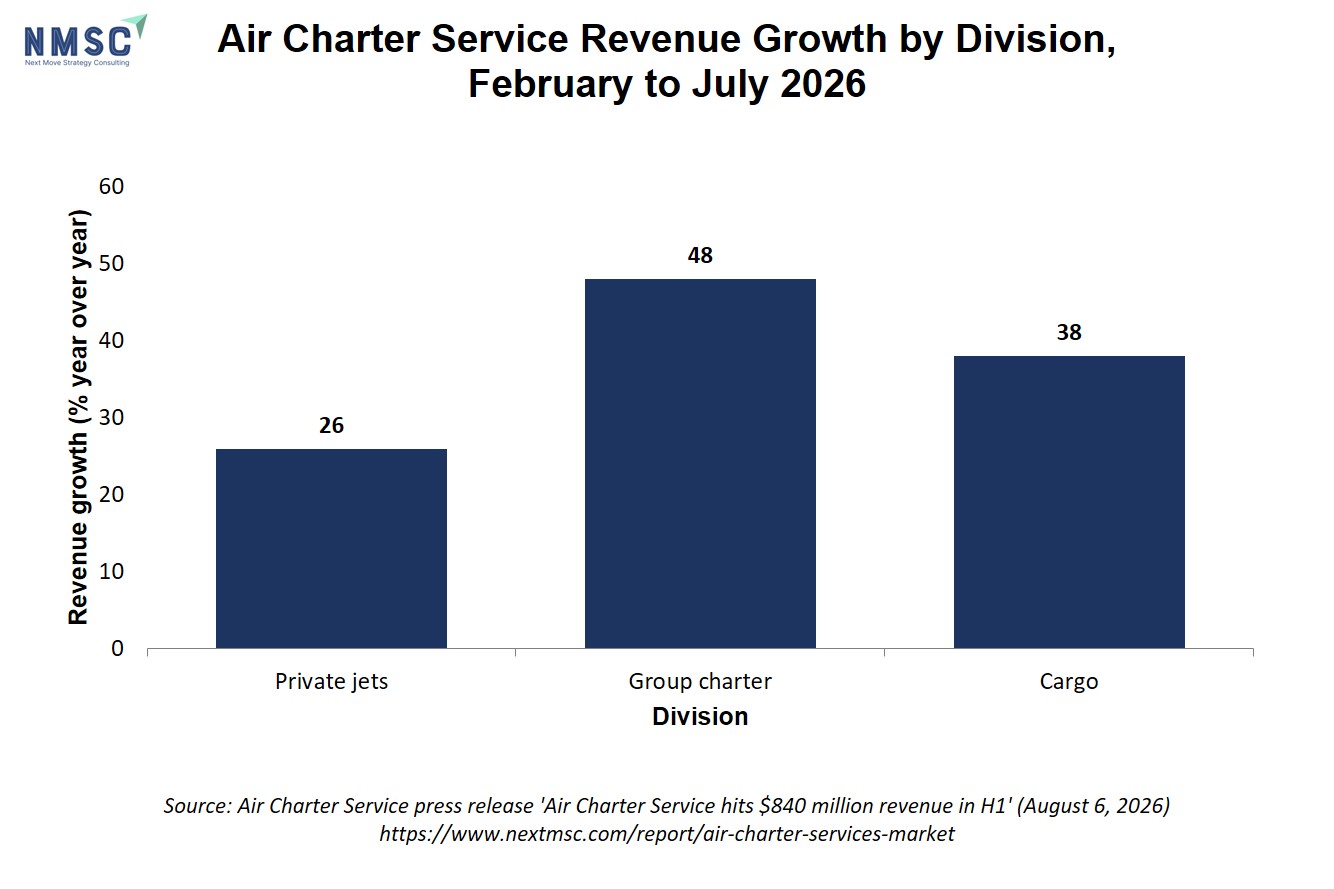
Air Charter Service's press release of August 6, 2026 reports revenue growth of 26% in private jets, 48% in group charter and 38% in cargo for February to July 2026. Group revenue rose 38% overall, and the company reported 49% more cargo charters, the strongest growth in charter numbers across its three main divisions.
Chris Leach, Chairman and Founder of Air Charter Service, said in the company's press release of August 6, 2026 that the group is being "called upon when there are spikes in demand with increasing regularity". The company also opened offices in Brussels, Monaco and Stuttgart in the past six months, bringing its network to 43 offices.
Wheels Up, November 5: Demand Is Intact, but the Operating Model Is Being Rebuilt
On November 5, 2026, Wheels Up Experience Inc. reported third-quarter GAAP revenue of USD 164.8 million, down 11% year over year, and total gross bookings of USD 225.4 million, down 15%, attributing the bookings decline primarily to lower group charter, cargo and on-demand charter volume. Yet adjusted contribution margin improved to 16.4% from 12.7%, and the adjusted EBITDAR loss narrowed 44% to USD 13.2 million as the operator wound down legacy programs and aircraft in favor of Embraer Phenom and Bombardier Challenger fleets. Aviation International News reported the same day that corporate bookings across membership and charter rose 28% in the quarter. Wheels Up also announced an order for six factory-new Embraer Phenom 300E jets for delivery in 2027 and an additional USD 100 million revolving credit facility from Delta Air Lines.
The 2026 FIFA World Cup: A Measurable Surge, Then a Soft Landing
The tournament, played across the United States, Canada and Mexico in June and July, was the sector's largest single demand event of the year. WINGX's Global Market Tracker, published in BlueSky Business Aviation News on July 30, 2026, reported that business jet movements in the 16 host metropolitan areas ran 17% above prior-year levels on match-related days, defined as the day before, the day of and the day after each match. The uplift built with each stage: 10% in the group stage, 44% in the Round of 16 and 68% across the two semi-finals, with the Final at 38%. Seattle rose 130% around the USA versus Belgium Round of 16 match. The same bulletin recorded a 1.8% year-over-year decline in global business jet activity in the week of July 20 to 26, the ninth down week of 2026, although year-to-date activity remained 3.5% ahead of 2025.
World Cup 2026 Business Jet Movement Surge by Tournament Stage
|
Tournament stage |
Business jet movements versus prior-year dates |
|
Group Stage |
+10% |
|
Round of 16 |
+44% |
|
Two Semi-Finals |
+68% |
|
Final |
+38% |
|
All match-related days |
+17% |
NMSC Strategic Perspective: Mix, Not Volume, Is Setting the Charter Growth Rate
NextMSC primary research and analysis draws three conclusions from these events. First, price realization is carrying growth. NextMSC's calculation from the Air Charter Service figures shows that 38% revenue growth on 16% contract growth implies average revenue per contract rose by about 19%, a gain from larger cabins, longer sectors and higher-value contracts rather than from a surge in flight counts. NextMSC's 4.8% CAGR is a value-based trajectory, and the 2026 evidence suggests that mix and pricing can contribute as much to that value as additional departures.
Second, the booking model determines resilience. Pre-paid programs convert fuel exposure into a pricing mechanism: Air Charter Service's Jet Card revenue rose almost 60% while it absorbed fuel costs, and the Wheels Up Signature Membership passed 1,500 members, up 130% year to date, as legacy memberships fell 62%. Operators with heavier exposure to spot group charter and cargo, as the Wheels Up results show, recorded lower volume in those lines.
Third, the same segments moved in opposite directions at two operators. Air Charter Service reported 49% more cargo charters and 34% more group contracts, while Wheels Up reported lower cargo and group charter volume. NextMSC primary research and analysis reads this as a redistribution of event and logistics work toward brokers with global sourcing reach, not as a contraction in end demand, although two company datasets cannot prove the point alone.
Section Summary:
Three 2026 developments show that revenue quality, not flight count, is driving value in the sector.
-
Reuters (June 8, 2026) documented substitution from disrupted airlines to charter despite jet fuel costs that had roughly doubled.
-
Air Charter Service (August 6, 2026) grew revenue 38% on 16% more contracts, with Jet Card sales up 85% and cargo charters up 49%.
-
Wheels Up (November 5, 2026) cut its EBITDAR loss 44% while gross bookings fell 15% during a deliberate shift to premium fleets and memberships.
-
WINGX data show World Cup match-related movements rising 17%, followed by a 1.8% decline in global activity in late July.
Industry Impact Analysis: Fuel, Geopolitics and Regional Divergence in the Air Charter Services Market
Fuel and Macroeconomics Compress Margins, Not Demand
The International Air Transport Association's release of October 29, 2026 reported that jet fuel prices rose 17.5% in September alone and stood 103.4% above the level of a year earlier. Marie Owens Thomsen, IATA's Senior Vice President Sustainability and Chief Economist, stated in the release that yields have not kept pace, which makes profitable operation harder even where goods are plentiful. Air Charter Service's slight margin squeeze shows the same pressure inside the charter sector. The International Monetary Fund's World Economic Outlook Update of July 8, 2026 cut 2026 global growth to 3.0%, 0.1 percentage point below April, and raised 2026 global headline inflation to 4.7%. Charter pricing power therefore rests on a customer base for which a 1,000 euro fare increase is immaterial, the base described in the Reuters report of June 8, 2026.
JETNET's Market Barometer, sixth edition (August 2026), explains why that base has held up. Drawing on Knight Frank data, it reports a record ultra-high-net-worth population of more than 684,000 people in 2025 and a correlation of 0.84 between that population and global business jet departures. It also reports record US corporate profits of USD 3.95 trillion in the first quarter of 2026 and 3.99 million global business jet departures in the twelve months to July 2026, up 4.9%. WINGX's Week 43 report, covered by GlobalAir.com on October 30, 2026, placed year-to-date departures 3.2% above 2025, a slower pace than the 3.5% recorded in the July 30 bulletin, which indicates a plateau rather than a reversal.
Regional Divergence: North America Leads, the Middle East Contracts
Geography is concentrated. JETNET's barometer shows North America generating 71.6% of global business jet departures in the twelve months to July 2026, Europe 14.3% and Latin America 7.5%. Growth was uneven: Africa rose 10.4% and Latin America 7.4%, while the Middle East fell 5.7% over the period and 15.7% year to date after the conflict began in February. JETNET noted tentative recovery, with July departures in the region down only 4.7% against declines above 20% earlier in the year. Fractional ownership grew 10.7% over the twelve months, while branded charter fell 0.6%, so program-based supply is expanding faster than traditional on-demand capacity.
JETNET also quantifies what charter buyers pay for. North American business jet departures ran more than 30% above 2019 levels in 2026, while scheduled airlines were not even 10% above, and business jets served more than 377,000 unique city pairs in the twelve months to July 2026 against 19,500 for the four largest airlines combined. NextMSC primary research and analysis treats that point-to-point reach as the core purchase when airline capacity tightens.
IATA's September data show the same regional split in cargo: the Europe to Middle East lane fell 18.0% and the Middle East to Asia lane fell 10.2%, while Asia to North America grew 17.0% and Europe to North America grew 9.3%. For charter operators, Gulf routes have moved from the evacuation demand that Air Charter Service described earlier in the year to a question of risk and capacity, not a growth engine.
Air Cargo Demand by Trade Lane, September 2026
|
Trade lane |
September 2026 demand change |
Share of industry traffic, 2025 |
|
Asia to North America |
+17.0% |
23.5% |
|
Within Asia |
+10.2% |
7.3% |
|
Europe to North America |
+9.3% |
13.5% |
|
Europe to Asia |
+6.0% |
21.5% |
|
Middle East to Asia |
-10.2% |
7.4% |
|
Europe to Middle East |
-18.0% |
5.2% |
Cargo Charter: Tight Scheduled Capacity Pulls Freight Toward Ad Hoc Lift
IATA reported that air cargo demand rose 7.7% year over year in September, accelerating from 4.4% in August, while available capacity rose only 2.7%, lifting the global cargo load factor 2.2 percentage points to 47.9%. That gap shows scheduled belly and freighter capacity is not keeping pace with demand, which is the condition under which shippers with urgent loads turn to ad hoc charters. IATA also attributed part of the double-digit Pacific growth to AI-related shipments. Air Charter Service's 49% increase in cargo charters is the operator-side evidence of this pull.
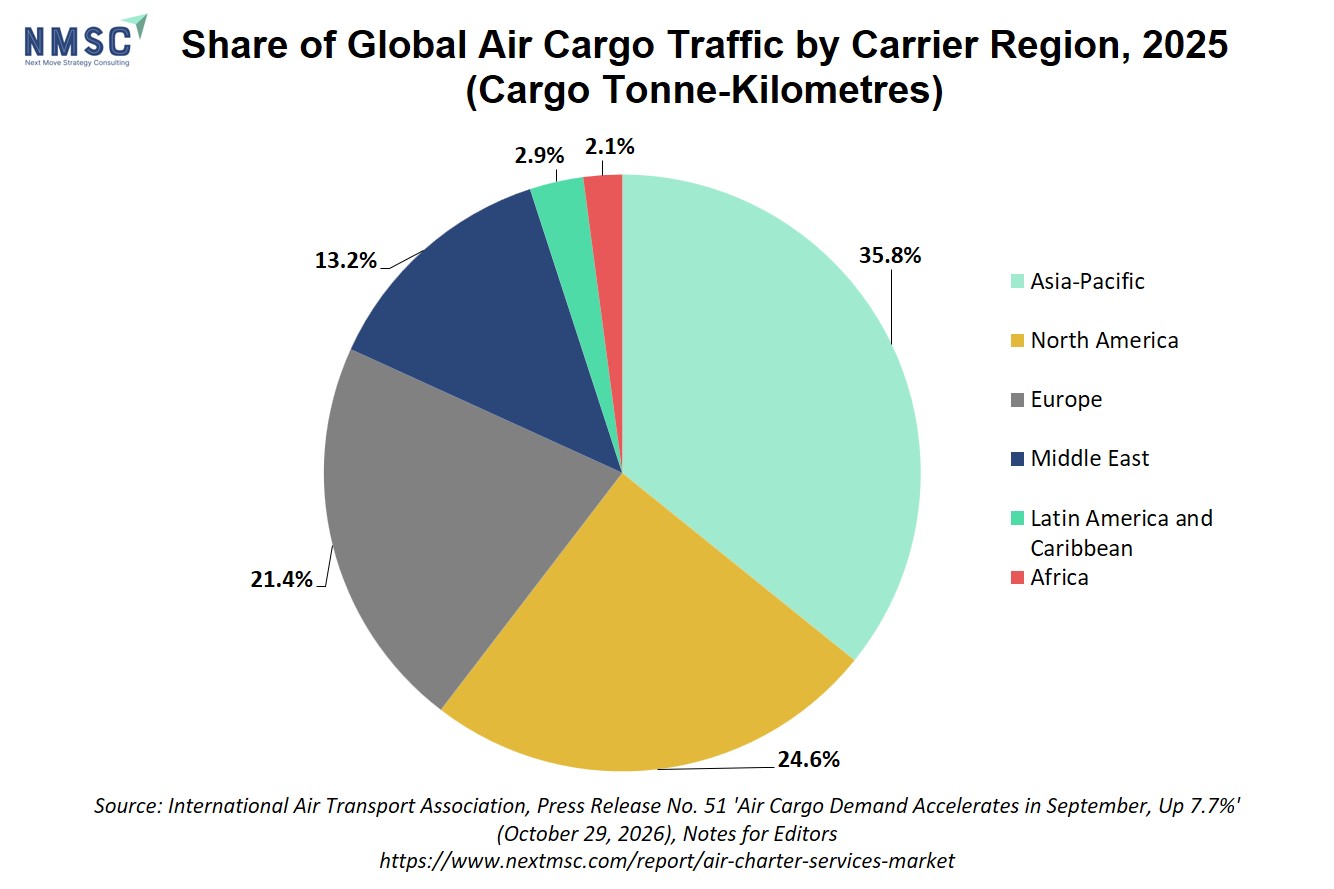
The International Air Transport Association's release of October 29, 2026 reports each carrier region's share of 2025 industry cargo tonne-kilometres: Asia-Pacific 35.8%, North America 24.6%, Europe 21.4%, Middle East 13.2%, Latin America and Caribbean 2.9% and Africa 2.1%. In September 2026, North American carriers recorded the fastest demand growth at 11.8%, while Middle Eastern carriers recorded the slowest at 3.8%.
Section Summary:
Cost and geography, not a weakening customer, are the main pressures on the sector.
-
Jet fuel stood 103.4% above its year-earlier level in September 2026, compressing margins at operators that absorb the increase.
-
The IMF's July 2026 cut to 3.0% global growth and 4.7% inflation raises the cost of capital for fleet expansion.
-
North America produced 71.6% of global business jet departures, while the Middle East contracted 15.7% year to date.
-
Air cargo demand outgrew capacity by 5.0 percentage points in September, which supports ad hoc cargo charter volume.
Pros and Cons of Recent Market Developments
The evidence from the past six months supports both optimism and caution. The table below pairs the most material strengths with the pressure points they sit beside.
|
Pros |
Cons |
|
Air Charter Service's Jet Card sales rose 85%, pre-paying demand before fuel costs move. |
Jet fuel stood 103.4% above its year-earlier level in September 2026, per IATA. |
|
Air Charter Service's cargo charters rose 49%, while IATA reports demand up 7.7% against capacity up 2.7%. |
Europe to Middle East cargo fell 18.0% in September; Middle East jet departures fell 15.7% year to date. |
|
World Cup match-related business jet movements ran 17% above prior-year dates, peaking at 68% in the semi-finals. |
Global business jet activity fell 1.8% in late July as the tournament ended, the ninth down week of 2026. |
|
JETNET reports more than 684,000 ultra-high-net-worth individuals, correlated 0.84 with departures. |
Wheels Up's gross bookings fell 15% and its net loss reached USD 89.4 million during its transition. |
|
Air Charter Service's revenue per contract rose about 19% on larger aircraft and longer sectors. |
The IMF cut 2026 global growth to 3.0% and raised inflation to 4.7%, weighing on corporate budgets. |
Key Data & Statistics for the Air Charter Services Market
Two company disclosures and one operating data set frame current performance. Wheels Up's quarter shows the cost of changing the operating model, while the cargo and event data show where demand is concentrating.
Wheels Up Third Quarter 2026 Results
|
Indicator |
Third quarter 2026 |
Change |
|
GAAP revenue |
USD 164.8 million |
Down 11% year over year |
|
Total gross bookings |
USD 225.4 million |
Down 15% year over year |
|
Adjusted contribution margin |
16.4% |
Up from 12.7% |
|
Adjusted EBITDAR loss |
USD 13.2 million |
44% improvement |
|
Signature members |
More than 1,500 |
Up 130% year to date |
JETNET's barometer adds fleet and order context. Active business jet hours per aircraft averaged 21.4 per month through July 2026, 1.2% above 2025, and the installed fleet reached about 25,700 aircraft. Order backlog among the four leading manufacturers reached USD 61.6 billion in the second quarter of 2026, up 20.2% year over year, with Gulfstream at USD 24.0 billion and Bombardier at USD 21.8 billion. Fleet orders equaled 56% of deliveries in 2026 to date, which shows that fractional and charter operators are committing capital to capacity ahead of demand. Fractional providers received 18% of new deliveries in 2026 to date, while Part 135 charter operators received about 2%.
Future Outlook & Forecast: Reading the 4.8% CAGR Against 2026 Evidence
NextMSC's forecast of USD 43.43 billion by 2030 at a 4.8% CAGR from 2022 depends on three observable conditions, each of which the 2026 data allow us to test. The first is a growing wealth base: JETNET, drawing on Knight Frank, projects the ultra-high-net-worth population to grow 4.3% in 2026 and at a 5.6% CAGR through 2031, which supports sustained premium demand. The second is fuel pass-through: operators with pre-paid programs and larger-cabin mixes protected revenue in 2026, while those absorbing fuel, such as Air Charter Service, reported margin compression. The third is geopolitical normalization: the IMF's July 2026 update projects growth recovering to 3.4% in 2027, and JETNET reports tentative recovery in Middle East departures, but IATA still shows Gulf cargo lanes contracting.
Near-term indicators point to a plateau, not a downturn. WINGX's year-to-date departure growth eased from 3.5% in late July to 3.2% by Week 43, and the World Cup comparison base will not repeat in 2027. NextMSC primary research and analysis expects event-led peaks to remain a feature of charter demand, given Air Charter Service's observation that spikes now arrive with increasing regularity, but expects year-on-year comparisons to normalize once the 2026 tournament and evacuation flights leave the base.
Section Summary:
The long-range case for the sector rests on wealth, pricing and fleet commitments, with geopolitics as the main swing factor.
-
JETNET projects 4.3% growth in the ultra-high-net-worth population in 2026 and a 5.6% CAGR through 2031.
-
Manufacturer backlog of USD 61.6 billion and fleet orders equal to 56% of 2026 deliveries show committed capacity expansion.
-
WINGX year-to-date growth of 3.2% at Week 43 indicates a plateau, so 2027 comparisons will be harder than 2026.
-
The IMF's 3.4% growth projection for 2027 supports a recovery case only if Middle East lanes stabilize.
Next Steps for Stakeholders
For C-level executives and institutional investors, the 2026 evidence translates into five actions.
-
Track revenue per contract alongside flight counts. Air Charter Service's implied 19% gain in revenue per contract shows that volume alone understates growth.
-
Shift the booking mix toward pre-paid programs where balance sheets allow. Jet Card sales up 85% at Air Charter Service contrast with the transition costs visible at Wheels Up.
-
Write explicit fuel pass-through terms into charter and cargo contracts, because jet fuel at 103.4% above its year-earlier level erodes margin when operators absorb it.
-
Secure standby cargo lift on Asia to North America and Europe to North America lanes, which grew 17.0% and 9.3% in September, and price Middle East exposure for risk.
-
Plan capacity for event peaks and the trough that follows, using the 68% semi-final surge and the 1.8% late-July decline as the range.
Conclusion
The air charter services market enters 2027 with strong pricing, a record wealth base and committed fleet expansion, but also with fuel at twice last year's level and a Middle East that has not recovered. The 2026 data show growth is being earned through larger cabins, longer sectors, pre-paid programs and cargo, rather than through volume alone. That supports NextMSC's USD 43.43 billion forecast for 2030 as a value-based trajectory, provided operators protect margin against fuel and manage the volatility of event-driven demand.
About the Author
 Priyanshu Das
— Priyanshu Das is SEO Executive at Next Move Strategy Consulting, where he has led on-page and off-page SEO, keyword research, and SEO audits for the firm's B2B market research publications for 2 years. His audit process combines technical crawl analysis, backlink profile review, and competitor keyword gap mapping — using tools including Screaming Frog and Google Search Console — to prioritize fixes by organic search-visibility impact, informed by his own prior in-house and agency SEO experience.
About the Reviewer
 Sanyukta Deb
— Sanyukta Deb is Digital Marketing Team Lead at Next Move Strategy Consulting, where she has led content strategy and technical SEO for the firm's B2B market research publications for over 2 years. Her editorial process translates NextMSC's primary and secondary research — spanning technology, industrial, and consumer sectors — into commercial narratives, backed by search-intent, keyword, and competitive analysis. She brings 5 years of overall experience in digital marketing and content strategy.














Add Comment