AI Power Management Market Global Industry Analysis and Forecast (2026–2035)

Escalating accelerator power draw and the shift to 800 V DC rack architectures lift this market from USD 15.80 Billion in 2025 to USD 96.00 Billion by 2035, an 18.2% CAGR over 2026 to 2035, with North America leading global demand

Download Free Sample PDF
Base Year (2025)
$15.80 Billion
Forecast (2035)
$96.00 Billion
CAGR (2026-2035)
18.2%
Top Region
North America

What Is the AI Power Management Market Size?

The global AI Power Management Market reached USD 15.80 Billion in 2025 and is estimated at USD 21.30 Billion in 2026, forecast to reach USD 96.00 Billion by 2035 at a CAGR of 18.2% between 2026 and 2035. North America leads with approximately 48% share in 2025, while rack power supplies and systems hold approximately 42% of revenue.
We observed that operators now treat rack power architecture as a core design decision rather than a downstream procurement item.

AI Power Management Market Global Industry Analysis and Forecast (2026–2035) Revenue Forecast
Values in USD Billion

2025 $15.80 Billion
2025
2026 $21.30 Billion
2026
2027 $25.18 Billion
2027
2028 $29.76 Billion
2028
2029 $35.17 Billion
2029
2030 $41.58 Billion
2030
2031 $49.14 Billion
2031
2032 $58.09 Billion
2032
2033 $68.66 Billion
2033
2034 $81.16 Billion
2034
2035 $96.00 Billion
2035

Key Takeaways

By Offering: Rack power supplies and systems held the largest share, expanding from USD 6.60 Billion in 2025 to USD 35.00 Billion by 2035; power distribution systems are the fastest-growing at 21.3% CAGR from 2026–2035.

By Rack Power Architecture: Up to 54 V DC held the largest share, expanding from USD 14.20 Billion in 2025 to USD 30.00 Billion by 2035; 800 V DC is the fastest-growing at 50.7% CAGR from 2026–2035.

By End User: Hyperscale cloud providers held the largest share, expanding from USD 8.90 Billion in 2025 to USD 47.00 Billion by 2035; colocation and neocloud providers is the fastest-growing at 19.8% CAGR from 2026–2035.

Dominant Region: North America dominated with approximately 48% revenue share in 2025, anchored by hyperscale campus buildouts and early 800 V DC platform launches.

Fastest-Growing Region: Middle East & Africa is expected to register the highest CAGR of 21.0% during 2026–2035, driven by greenfield AI campuses designed around higher voltage distribution.

Dominant Country: The U.S. led the market with an estimated USD 6.70 Billion in 2025, supported by the largest base of hyperscale and neocloud AI capacity.

Fastest-Growing Country: India is among the fastest-growing major countries at 27.2% CAGR during 2026–2035, rising from a small base as cloud regions and AI campuses scale.

Investor insight: the AI Power Management Market adds an absolute revenue opportunity of USD 74.70 Billion between 2026 and 2035, rewarding vendors that secure design wins before 800 V DC platforms reach volume.
According to NMSC analysis, 800 V DC revenue rises from USD 1.20 Billion in 2026 to USD 48.00 Billion by 2035, lifting its share of total revenue from about 6% to 50% as row power centers and solid-state transformers reach volume.

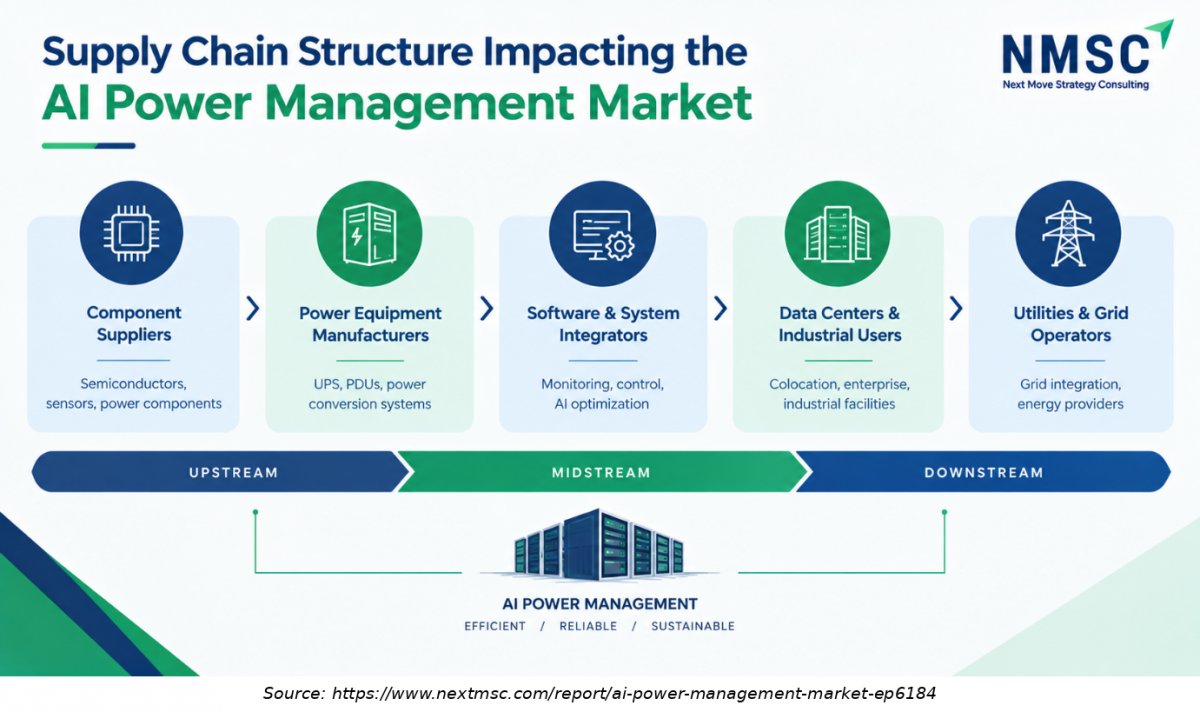
Supply Chain Structure Impacting the AI Power Management Market
Supply Chain Structure Impacting the AI Power Management Market
The AI Power Management Market supply chain connects component suppliers, power equipment manufacturers, software and system integrators, data centers, industrial users, and utility providers. Semiconductor components, sensors, UPS systems, and power distribution units support the development of intelligent power management solutions. AI-powered monitoring and optimization software helps improve energy efficiency, power distribution, and system reliability. A well-integrated supply chain is essential to meeting the growing power demands of AI infrastructure while supporting efficient and reliable operations.

What Does the AI Power Management Market Encompass?

The AI Power Management Market covers the hardware, silicon and software that convert, distribute, monitor and control electrical power inside facilities that train and run AI models. This market report measures vendor revenue across power semiconductors and ICs, rack power supplies and systems, power distribution systems, and management software and services. It excludes cooling, onsite generation and utility grid equipment upstream of the data hall.

We found that the AI Power Management Market has moved from 12 V and 48 V server power toward 54 V rack shelves, 400 V DC pilots and 800 V DC platforms as accelerator power climbs. The IEA reports that data centers consumed about 415 TWh in 2024 and projects around 945 TWh by 2030, which keeps grid capacity and efficiency at the centre of policy attention. NVIDIA expects an MGX compatible 800 VDC power rack in the second half of 2026 and row power centers in 2027.

Market Drivers & Dynamics

Interactive Dataset
Escalating accelerator and rack power draw driver +4.8% Global; strongest in North America and Asia-Pacific 2026–2035
Shift to 400 V DC and 800 V DC architectures driver +3.9% North America, Asia-Pacific 2026–2032
Hyperscale and neocloud capital spending driver +3.2% North America, Middle East & Africa 2026–2030
Efficiency and operating cost pressure driver +2.1% Global 2026–2035
Wide bandgap device adoption driver +1.6% Global 2026–2033
Grid interconnection and power availability limits restraint −3.4% North America, Europe 2026–2030
Supply chain concentration and capacity constraints restraint −1.8% Global 2026–2028
Standards fragmentation for high voltage DC safety restraint −1.4% Global 2026–2029
Volatility in AI capital spending cycles restraint −1.2% Global 2027–2035
Source: Next Move Strategy Consulting

Growth Drivers

What Is the Primary Growth Driver in the AI Power Management Industry?

Our assessment indicates that rising accelerator and rack power demand is the primary growth driver. The IEA reports that data centers consumed around 415 TWh in 2024, about 1.5% of world electricity, and projects around 945 TWh by 2030. It also expects electricity demand from AI optimized data centers to more than quadruple by 2030. Each added megawatt of AI capacity requires conversion, distribution and control equipment, which sustains demand and growth for the AI Power Management Market.

How Is Hyperscale and Neocloud Spending Driving Market Growth?

NMSC's analysis indicates that hyperscale, colocation and neocloud operators are the main buyers, and they procure power systems alongside accelerators. We estimate hyperscale operators generated USD 11.60 Billion of 2026 revenue, about 54% of the total, as an industry derived estimate. The IEA expects United States data centers to account for almost half of national electricity demand growth to 2030, which concentrates orders in North America and supports repeat equipment purchasing.

Growth Inhibitors

What Is Restraining the AI Power Management Market?

Our findings suggest that grid capacity and demand uncertainty restrain faster growth. The IEA notes that 2035 data center electricity demand spans 700 TWh to 1,700 TWh across its cases, so equipment orders depend on how quickly utilities connect new load. We estimate, as an industry derived estimate, that interconnection delays and standards fragmentation for high voltage DC reduce 2026–2035 growth by about 3.4% and 1.4% respectively.

What Are the Growth Opportunities?

Can Row Power Centers Create a New Revenue Pool for Power Distribution Vendors?

Row power centers convert grid power to 800 VDC once for a full rack row and distribute it by overhead busway, with NVIDIA targeting availability in 2027 and up to 2 MW per row. The mechanism replaces many rack level power supplies with centralized equipment. Power distribution systems vendors and the hyperscale cloud providers building dedicated AI factories benefit most, with the segment growing at 21.3% from 2026 to 2035.

Will Hybrid Retrofit Power Racks Unlock Upgrades in Existing Facilities?

NVIDIA says its MGX compatible 800 VDC power rack, arriving in the second half of 2026, adds DC equipment to facilities that already run on AC. This retrofit path lets operators raise rack power without rebuilding the electrical room. Rack power supplies and systems vendors gain a replacement cycle, and enterprise and sovereign AI operators gain a lower risk route to higher density.

Can Management Software Turn Power Capacity into a Billable Service for Neoclouds?

Colocation and neocloud providers sell megawatts, so software that forecasts rack load and caps peaks lets them place more compute inside a fixed grid allocation. Firmware running edge AI models at rack level can anticipate load swings within milliseconds. Management software and services vendors earn recurring revenue, and the segment reaches USD 8.50 Billion in 2035 from USD 2.20 Billion in 2026.

Segmentation Analysis

2025 (USD Billion)
2035 (USD Billion)
Power semiconductors and ICs 2025: $4.30 Billion | 2035: $27.50 Billion
Power semico
Rack power supplies and systems 2025: $6.60 Billion | 2035: $35.00 Billion
Rack power s
Power distribution systems 2025: $3.30 Billion | 2035: $25.00 Billion
Power distri
Management software and services 2025: $1.60 Billion | 2035: $8.50 Billion
Management s
Power semiconductors and ICs $4.30 Billion $27.50 Billion 18.7%
Rack power supplies and systems $6.60 Billion $35.00 Billion 16.6%
Power distribution systems $3.30 Billion $25.00 Billion 21.3%
Management software and services $1.60 Billion $8.50 Billion 16.2%

Which Offering Segment Leads the AI Power Management Market?

Offering splits the AI Power Management Market by what vendors sell: power semiconductors and ICs, rack power supplies and systems, power distribution systems, and management software and services. Our analysis shows that rack power supplies and systems led in 2025 with USD 6.60 Billion, about 42% of revenue, because every AI server needs shelf level conversion. Power distribution systems grow fastest at 21.3% from 2026 to 2035 as row power centers and 800 VDC busways, planned for 2027, scale.

2025 (USD Billion)
2035 (USD Billion)
Up to 54 V D
400 V DC
800 V DC
Segment Item 2025 (USD Billion) 2035 (USD Billion) CAGR
Up to 54 V DC $10.0 USD Billion $40.0 USD Billion 15.0%
400 V DC $17.1 USD Billion $51.1 USD Billion 13.0%
800 V DC $24.2 USD Billion $62.2 USD Billion 23.0%

Segment-wise data is locked

Unlock complete segment-wise numbers for By Rack Power Architecture.

Unlock Full Data
2025 (USD Billion)
2035 (USD Billion)
Hyperscale c
Colocation a
Enterprise a
Segment Item 2025 (USD Billion) 2035 (USD Billion) CAGR
Hyperscale cloud providers $10.0 USD Billion $40.0 USD Billion 26.0%
Colocation and neocloud providers $17.1 USD Billion $51.1 USD Billion 16.0%
Enterprise and sovereign AI operators $24.2 USD Billion $62.2 USD Billion 18.0%

Segment-wise data is locked

Unlock complete segment-wise numbers for By End User.

Unlock Full Data

Growth Opportunities

Three whitespace opportunities stand out for vendors planning investment through 2035.

Can Row Power Centers Create a New Revenue Pool for Power Distribution Vendors?

Row power centers convert grid power to 800 VDC once for a full rack row and distribute it by overhead busway, with NVIDIA targeting availability in 2027 and up to 2 MW per row. The mechanism replaces many rack level power supplies with centralized equipment. Power distribution systems vendors and the hyperscale cloud providers building dedicated AI factories benefit most, with the segment growing at 21.3% from 2026 to 2035.

Will Hybrid Retrofit Power Racks Unlock Upgrades in Existing Facilities?

NVIDIA says its MGX compatible 800 VDC power rack, arriving in the second half of 2026, adds DC equipment to facilities that already run on AC. This retrofit path lets operators raise rack power without rebuilding the electrical room. Rack power supplies and systems vendors gain a replacement cycle, and enterprise and sovereign AI operators gain a lower risk route to higher density.

Can Management Software Turn Power Capacity into a Billable Service for Neoclouds?

Colocation and neocloud providers sell megawatts, so software that forecasts rack load and caps peaks lets them place more compute inside a fixed grid allocation. Firmware running edge AI models at rack level can anticipate load swings within milliseconds. Management software and services vendors earn recurring revenue, and the segment reaches USD 8.50 Billion in 2035 from USD 2.20 Billion in 2026.

Regional Outlook

2025 (USD Billion)
2035 (USD Billion)
North Americ
Europe
Asia-Pacific
Middle East
Latin Americ
Region 2025 (USD Billion) 2035 (USD Billion) CAGR (%)
North America $10.0 USD Billion $40.0 USD Billion 9.0%
Europe $17.1 USD Billion $51.1 USD Billion 27.0%
Asia-Pacific $24.2 USD Billion $62.2 USD Billion 25.0%
Middle East & Africa $31.3 USD Billion $73.3 USD Billion 23.0%
Latin America $38.4 USD Billion $84.4 USD Billion 12.0%

Regional data is locked

Unlock complete regional numbers for this market.

Unlock Full Data

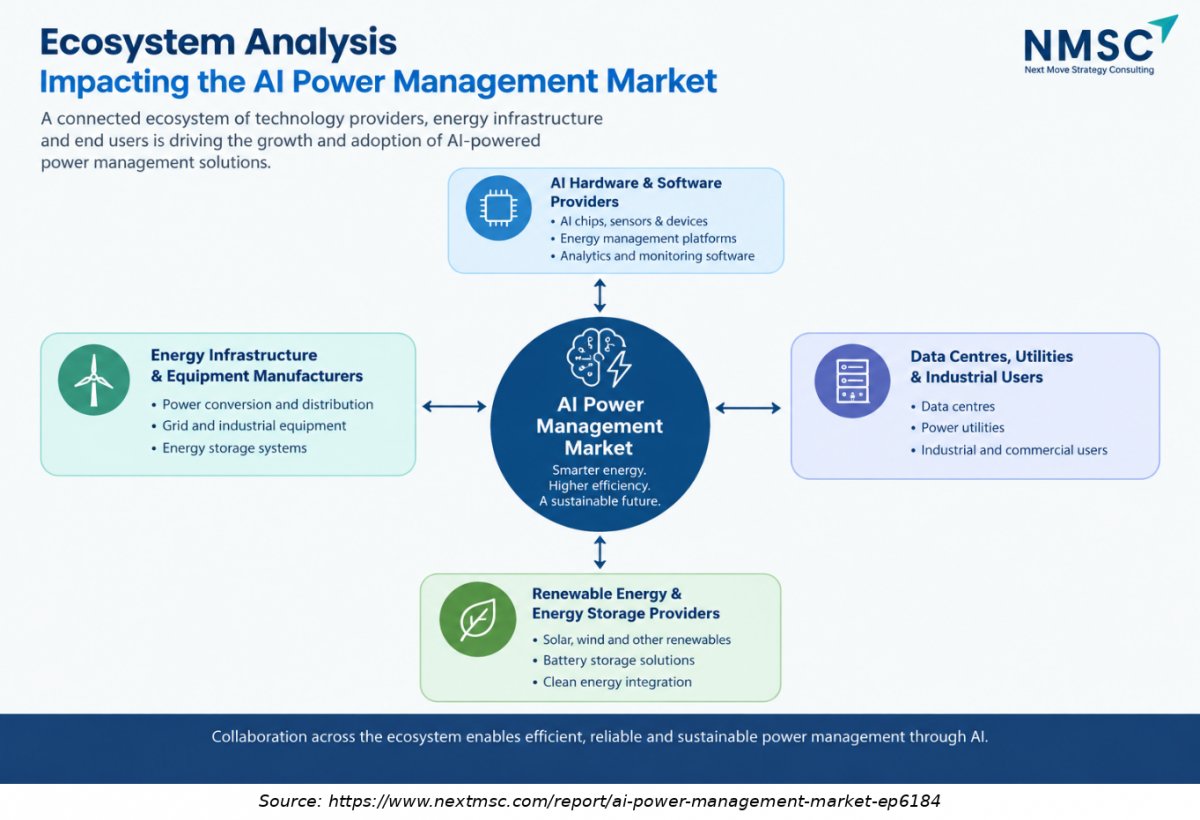
Ecosystem Analysis

Competitive Landscape

How Do Companies Compete in the AI Power Management Market?

Vendors compete on conversion efficiency, power density, qualification against NVIDIA reference designs, and delivery capacity. Silicon suppliers such as Infineon, Monolithic Power Systems, Texas Instruments and STMicroelectronics win socket level design positions, while Delta Electronics, Vertiv, Eaton and Schneider Electric compete on systems and project delivery. Pricing favors long-term supply agreements with hyperscalers, and geographic expansion follows operator campuses in North America, Asia-Pacific and the Gulf.

Which Competitive Archetypes Dominate the AI Power Management Market?

Our assessment indicates that three archetypes dominate: semiconductor specialists that sell conversion stages, power system makers that sell shelves and racks, and infrastructure groups that sell distribution and services. Dominance rests on reference design alignment, manufacturing scale, installed base access and end to end portfolios. Monolithic Power Systems reported USD 0.38 Billion of Enterprise Data revenue in the second quarter of 2026, up 164.3% year on year, which shows how design wins translate into scale.

What Innovation and Differentiation Strategies Are Companies Pursuing?

Innovation concentrates on 800 V DC conversion stages, gallium nitride and silicon carbide devices, and modular power racks. Texas Instruments and STMicroelectronics released 800 VDC reference designs in March 2026, and Monolithic Power Systems began sampling high voltage AC to DC products for 800 V architectures with its second quarter 2026 results. Vertiv and Eaton differentiate through integrated power and thermal portfolios, while Schneider Electric emphasizes software and lifecycle services.

What M&A and Partnership Activity Is Shaping the Market?

We observed that deal activity favors software, thermal and capacity additions rather than large power platform mergers. Acquisitions contributed USD 0.13 Billion to Vertiv's second quarter 2026 net sales, and Schneider Electric proposed acquiring Cognite and AiDASH. Partnerships matter as much as deals, because a broad group of NVIDIA ecosystem partners supports the 800 VDC roadmap. Expect further alliances between silicon suppliers and rack power makers as designs approach volume.

Competitive Dynamics and M&A Landscape

Recent strategic moves, partnerships, and acquisitions shaping the AI Power Management Market Global Industry Analysis and Forecast (2026–2035).

October 2026 Infineon introduced Infineon introduced a 27 kW three-phase power-supply reference design for AI servers
September 2026 Schneider Electric introduced Schneider Electric introduced prefabricated power modules and skids delivering 2–2.5 MW per module for hyperscale, neocloud and colocation data centers
August 2026 Trane Technologies and Eaton announced Trane Technologies and Eaton announced an integrated power-and-cooling reference design for NVIDIA’s DSX AI Factory
March 2026 STMicroelectronics expanded STMicroelectronics expanded its NVIDIA-aligned 800 VDC data-center portfolio with 800 VDC-to-12 V and 800 VDC-to-6 V conversion architectures, complementing an earlier 800 VDC-to-50 V stage

Key Market Players

Our analysis shows that eight validated vendors currently lead the market, ranked here on the scale of their verifiable AI power operations.

Delta Electronics, Inc. Vertiv Holdings Co Eaton Corporation plc Schneider Electric SE (ranked on data center portfolio breadth) Infineon Technologies AG Monolithic Power Systems, Inc. Texas Instruments Incorporated (ranked on reference design breadth; AI specific revenue is not disclosed) STMicroelectronics N.V. (ranked on conversion stage breadth; AI specific revenue is not disclosed)

Expert Insights

Jeffrey Morroni

Director of Power Management Research and Development at Kilby Labs and TI Fellow | Texas Instruments

"AI data centers are pushing the limits of power to previously unimaginable levels."

Analyst Interpretation

The statement highlights the increasing power demands of AI data centers and the limitations of conventional low-voltage distribution architectures as computing density rises. The transition toward 800 VDC creates opportunities for advanced power-conversion systems, power-management ICs, sensing technologies and high-efficiency semiconductor solutions. These developments are expected to play an important role in improving power-delivery efficiency and supporting next-generation AI infrastructure

Investment Opportunities

Where Are Capital Inflows Concentrating in the AI Power Management Market?

Our findings suggest that capital flows toward manufacturing capacity for power semiconductors and rack power supplies and systems. Infineon raised planned fiscal 2026 investment to about EUR 2.7 billion, with an extra EUR 0.5 billion for data center power supply capacity, and expects AI data center revenue of about EUR 1.5 billion in fiscal 2026. Investors should track design wins, backlog growth and capacity ramps as leading indicators for the USD 74.70 Billion opportunity between 2026 and 2035.

How Is Infrastructure Investment Shaping Market Capacity?

We found that spending on grids, campuses and factories sets the ceiling for AI Power Management Market demand. The IEA Base Case sees data center electricity use reaching around 1,200 TWh by 2035, and utilities must connect that load. Vertiv ended the second quarter of 2026 with USD 5.60 Billion of liquidity and continuing capacity expansions, and Eaton reported Electrical sector backlog growth of 43%, which signals multiyear supply visibility.

What ESG Considerations Are Influencing Market Investment?

Our analysis shows that environmental performance increasingly decides vendor selection. The IEA projects that renewables meet half of global data center demand growth to 2035, and it urges higher data center efficiency and grid investment. Efficient conversion lowers wasted energy and heat, and fewer copper busbars reduce material demand, which matters because the IEA flags concentrated critical mineral supply. Governance expectations include transparent power usage reporting.

Key Benefits for Stakeholders

How Does This Report Benefit Enterprise and Industry Leaders?

Enterprise and industry leaders gain a segmentation by offering, rack power architecture and end user that shows where USD 96.00 Billion of 2035 revenue concentrates. The analysis compares 54 V DC, 400 V DC and 800 V DC adoption paths, so planners can time facility designs against platform launches. Regional and country forecasts help procurement teams anticipate supply tightness and negotiate capacity commitments before demand peaks.

How Does This Report Benefit Investors and Financial Analysts?

Investors and financial analysts receive a base year of USD 15.80 Billion in 2025, a 2026 estimate of USD 21.30 Billion and an 18.2% CAGR through 2035 built on a smooth deceleration path. The report separates fast growing pools, such as 800 V DC at 50.7%, from larger but slower ones, such as up to 54 V DC at 6.1%. Competitive and development tables help screen vendors by design win exposure and capacity readiness.

How Does This Report Benefit Technology Vendors and Product Teams?

Technology vendors and product teams obtain a view of how conversion stages, rack power supplies and systems, distribution and software fit together across voltage tiers. The report profiles eight key players and shows where reference designs, partnerships and acquisitions shape positioning. Product teams can prioritize wide bandgap devices, modular racks and monitoring features in the fastest growing segments, including power distribution systems at 21.3% from 2026 to 2035.

Key Market Segments Evaluated

By Offering

  • Power semiconductors and ICs
  • Rack power supplies and systems
  • Power distribution systems
  • Management software and services

By Rack Power Architecture

  • Up to 54 V DC
  • 400 V DC
  • 800 V DC

By End User

  • Hyperscale cloud providers
  • Colocation and neocloud providers
  • Enterprise and sovereign AI operators

By Region

  • North America 
    • U.S.
    • Canada
    • Mexico.
  • Europe 
    • UK
    • Germany
    • France
    • Italy
    • Spain
    • Sweden
    • Denmark
    • Finland
    • Netherlands
    • Rest of Europe.
  • Asia-Pacific 
    • China
    • India
    • Japan
    • South Korea
    • Taiwan
    • Indonesia
    • Vietnam
    • Australia
    • Philippines
    • Malaysia
    • Rest of APAC.
  • Middle East & Africa 
    • Saudi Arabia
    • UAE
    • Egypt
    • Israel
    • Turkey
    • Nigeria
    • South Africa
    • Rest of MEA.
  • Latin America 
    • Brazil
    • Argentina
    • Chile
    • Colombia
    • Rest of LATAM.

Conclusion & Recommendations

Our analysis shows that revenue grows from USD 21.30 Billion in 2026 to USD 96.00 Billion in 2035, an 18.2% CAGR, with annual growth easing from about 29% in 2027 to about 8% in 2035 as the market matures. 800 V DC reaches half of revenue by 2035, and the USD 74.70 Billion opportunity favors vendors with scale, qualification and delivery capacity.

What Strategic Positioning Recommendations Does NMSC Offer?

NMSC recommends that silicon suppliers secure reference design status for 800 V conversion stages, that power system makers qualify modular racks for both 54 V DC and 800 V DC, and that infrastructure groups invest in row power centers and busway capacity ahead of 2027. Vendors should pursue colocation and neocloud customers, which grow at 19.8% from 2026 to 2035, and pair hardware with monitoring software to defend margins.

How Strong Is Investment Attractiveness in the AI Power Management Market?

Our assessment indicates that investment attractiveness in the AI Power Management Market is high but uneven. Power distribution systems at 21.3% and 800 V DC at 50.7% offer the fastest growth, while rack power supplies and systems offer the largest base at USD 6.60 Billion in 2025. Capacity constrained suppliers with visible backlog appear better placed than vendors dependent on one platform launch, and Middle East & Africa at 21.0% adds geographic upside.

What Are the Market Shifts and Key Risks in the AI Power Management Market?

We observed that the main shifts in the AI Power Management Market are the move from 54 V DC to higher voltage architectures, the integration of power and thermal systems, and the rise of software control. Key risks include grid interconnection delays, standards fragmentation for high voltage DC, supply concentration and a slowdown in AI capital spending, any of which could move orders between years. The IEA span of 700 TWh to 1,700 TWh for 2035 data center demand shows how wide the uncertainty remains.

What Are the Primary Growth Pathways Through 2035?

Growth pathways through 2035 include retrofit hybrid racks in existing facilities, greenfield 800 V DC campuses in North America and the Gulf, and fast scaling markets such as India at 27.2% from 2026 to 2035. Software and services provide a recurring revenue layer worth USD 8.50 Billion in 2035. Vendors that align product roadmaps with NVIDIA platform timing in 2026 and 2027 can convert design wins into volume.

FAQs

About the Author

Mayurima Roy

Mayurima Roy

Mayurima Roy is Research Analyst at Next Move Strategy Consulting, where she has spent 4 years working across the firm's full industry coverage rather than a single fixed vertical. Her work centers on structured research, ongoing trend tracking, competitive assessment, and insight-led content development, translating complex market data into clear, decision-ready narratives that support informed client decision-making across diverse global industries, market sectors, and world regions every day.

About the Reviewer

Supradip Baul

Supradip Baul

Supradip Baul is an accomplished business consultant and strategist with over a decade of rich experience in market intelligence, strategy, technology, and business transformation. His work has included rigorous qualitative and quantitative analysis across multiple industries, helping clients shape investment decisions and long-term roadmaps. Earlier in his career, he was associated with Gartner, where he contributed to industry-leading reports and market share analyses. He has worked with leading global companies and holds an MBA with a dual specialization in Marketing and Finance.

Download Free Sample

Melanie Samko

MELANIE SAMKO

Director of Marketing

TOSOH BIOSCIENCE, INC.

The information provided by NMSC is incredibly valuable, thank you so much for such a excellent work. I really appreciate it. I will make sure to reference all of it, in my summary document.

Pratyush Kumar Das

PRATYUSH KUMAR DAS

Assistant Manager

Polycab India Limited

We would like to express our appreciation for the data and insights provided by nextmsc. We are very pleased with the quality and depth of the information, which has proven to be highly valuable and beneficial for our business decision-making.

Kevin Coker

KEVIN COKER

Founder, CEO and Board Diector

Proxima Clinical Research

I have been using Next MSC reports for product positioning in a new geography for a long time. They have by far the best reports I have found and the price is reasonable too!

Amos Chang

AMOS CHANG

Strategy Consultant

Kardex Group

I have bought the intralogistics market reports from NMSC two times so far. Joseph and his team are always very helpful and flexible in responding to any customization requirements on the report. Their expertise in market reports really helps us steer the day-to-day business. I will definitely recommend and come back myself whenever there is a need.

Kishu Kanda

KISHU KANDA

Strategy Analyst

Accenture

We purchased the AI Consumer Market Report from this company. Not only did they customize the report to meet our specific requirements, but they also showed great flexibility in accommodating our budget. The report we received fully met our expectations. Additionally, they provided prompt and thorough responses to both our pre-purchase and follow-up questions. We look forward to working with this company again in the future.

Custom Market Research Services

We will customize the research for you if the listed report does not fully match your requirements.

Get 30% Free Customization

Select License

This website uses cookies to ensure you get the best experience on our website. Learn more

✖