AI Vulnerability Management Market Global Industry Analysis and Forecast (2026–2035)

AI Vulnerability Management Market size was USD 2.70 Billion in 2025 and is projected to climb to USD 11.90 Billion by 2035, a 15.9% CAGR over 2026–2035, as record vulnerability volumes, AI accelerated discovery and agentic remediation lift demand.
Download Free Sample PDF
Base Year (2025)
$2.70 Billion
Forecast (2035)
$11.90 Billion
CAGR (2026-2035)
15.9%
Top Region
North America

What Is the AI Vulnerability Management Market Size?

The global AI Vulnerability Management Market reached USD 2.70 Billion in 2025 and is estimated at USD 3.15 Billion in 2026, forecast to reach USD 11.90 Billion by 2035 at a CAGR of 15.9% between 2026 and 2035. North America leads with approximately 43% revenue share in 2025, while Software is the dominant component, holding approximately 76% of revenue.

During our market evaluation, we noticed that Software and North America anchor current revenue while agentic remediation and Asia-Pacific drive growth.

AI Vulnerability Management Market Global Industry Analysis and Forecast (2026–2035) Revenue Forecast

Values in USD Billion

2025 $2.70 Billion
2025
2026 $3.15 Billion
2026
2027 $3.65 Billion
2027
2028 $4.23 Billion
2028
2029 $4.90 Billion
2029
2030 $5.68 Billion
2030
2031 $6.59 Billion
2031
2032 $7.64 Billion
2032
2033 $8.85 Billion
2033
2034 $10.26 Billion
2034
2035 $11.90 Billion
2035

Key Takeaways

By Component: Software held the largest share, expanding from USD 2.05 Billion in 2025 to USD 8.50 Billion by 2035; Services is the fastest growing at 17.9% CAGR from 2026–2035.

By Technology: Machine learning and predictive prioritization held the largest share, expanding from USD 1.85 Billion in 2025 to USD 5.40 Billion by 2035; Agentic AI and autonomous remediation is the fastest growing at 27.0% CAGR from 2026–2035.

By End-User Industry: BFSI held the largest share, expanding from USD 0.64 Billion in 2025 to USD 2.65 Billion by 2035; Healthcare and life sciences is the fastest growing at 17.0% CAGR from 2026–2035.

Dominant Region: North America held approximately 43% share in 2025 at USD 1.15 Billion, rising to USD 4.45 Billion by 2035.

Fastest-Growing Region: Asia-Pacific at 18.2% CAGR from 2026–2035, expanding from USD 0.51 Billion in 2025 to USD 2.80 Billion by 2035.

Dominant Country: The U.S. at USD 1.00 Billion in 2025, projected at USD 3.90 Billion by 2035.

Fastest-Growing Country: India at 21.0% CAGR from 2026–2035, expanding from USD 0.07 Billion in 2025 to USD 0.50 Billion by 2035.

The market offers an absolute opportunity of USD 8.75 Billion between 2026 and 2035, which signals sustained capital inflow into remediation automation.

According to NMSC analysis, remediation capacity rather than detection now limits buyers, so vendors that close tickets automatically will take disproportionate share.

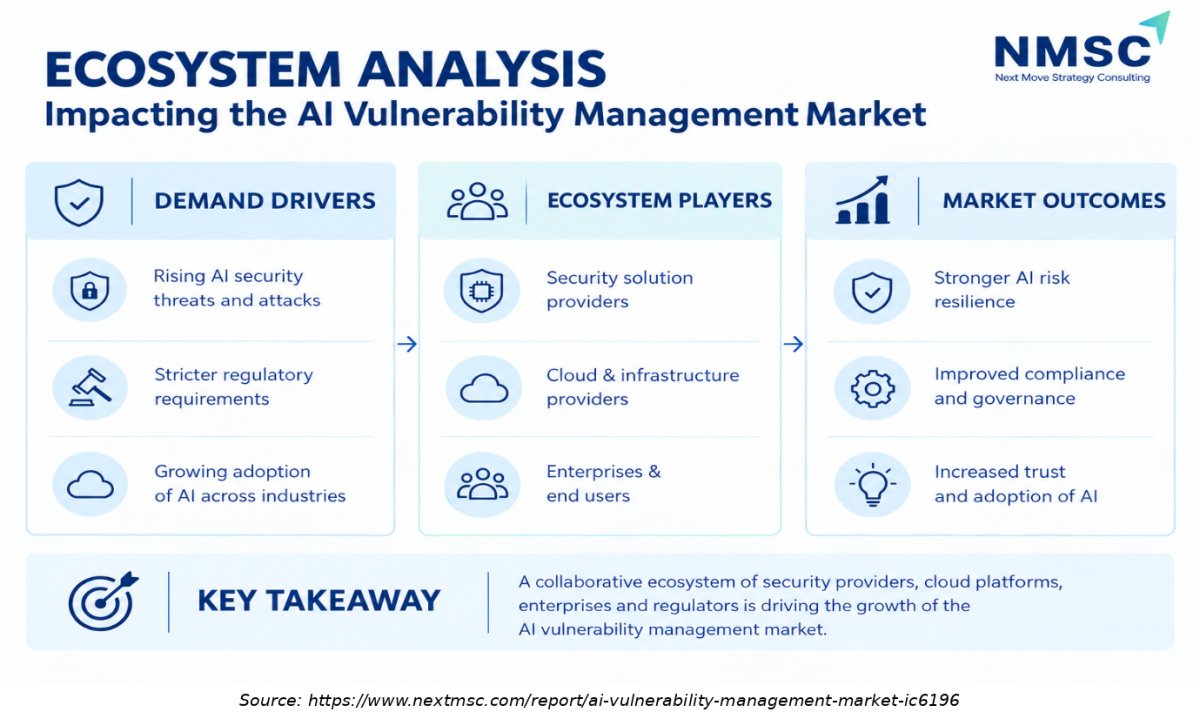
Ecosystem Analysis Impacting the Vulnerability Management Market

The infographic on Ecosystem Analysis Impacting the AI Vulnerability Management Market highlights the key stakeholders, technologies, and processes shaping the market. It focuses on cybersecurity providers, vulnerability assessment tools, threat intelligence, and risk prioritization solutions. These elements help organizations identify security weaknesses, manage risks effectively, and strengthen their overall cybersecurity posture.
What Does the AI Vulnerability Management Market Encompass?

The AI Vulnerability Management Market covers software platforms and attached services that apply artificial intelligence in cybersecurity operations to discover assets, identify weaknesses, prioritize exploitable risk, validate exposure and drive remediation across endpoints, servers, cloud workloads, applications and connected devices. Our assessment indicates that the scope excludes standalone antivirus, general endpoint detection and perimeter firewalls, and counts managed vulnerability and remediation services only when they run on an AI enabled platform.

Structural evolution runs from periodic scanning toward continuous exposure management, visible in how Tenable, Qualys and Rapid7 now position their platforms around exposure and risk. Regulation is accelerating the change, since the EU Cyber Resilience Act requires manufacturers to report actively exploited vulnerabilities from 11 September 2026, and CISA uses its Known Exploited Vulnerabilities catalogue to set federal remediation deadlines. Buyers therefore judge platforms on prioritization accuracy and time to fix.

Market Drivers & Dynamics

Interactive Dataset
Rising CVE volume and exploited flaw counts driver +2.4% Global 2026–2035
AI accelerated vulnerability discovery outpacing patch capacity driver +2.1% Global 2026–2030
EU Cyber Resilience Act reporting duties driver +1.6% Europe and exporters to Europe 2026–2028
Platform consolidation and bundled exposure suites driver +1.2% North America, Europe 2026–2030
Shortage of remediation staff and change windows driver +1.0% Global 2026–2035
Alert fatigue from AI generated findings restraint −1.3% Global 2026–2029
Pricing pressure from bundled offerings restraint −1.1% North America, Europe 2026–2032
Data sovereignty limits on cloud delivered AI restraint −0.8% Europe, Middle East & Africa 2026–2031
Source: Next Move Strategy Consulting

Growth Drivers

What Is the Primary Growth Driver in the AI Vulnerability Management Market ?
Record vulnerability volume is the primary driver. Public data show more than 48,000 vulnerabilities were reported in 2025, including 48,176 in the dataset cited by Estonia's Information System Authority, and the CISA Known Exploited Vulnerabilities catalogue reached 1,484 entries at the end of 2025 after 245 additions during the year. Manual triage cannot keep pace with this flow, so enterprises buy machine learning prioritization that separates exploitable flaws from background noise. We found that exploit evidence, not severity score alone, now decides which fixes receive budget.

How Is Regulation Driving the AI Vulnerability Management Market Growth?
The European Commission confirmed that, as of 11 September 2026, manufacturers must report actively exploited vulnerabilities and severe incidents affecting their products, while the main obligations of the Cyber Resilience Act apply from 11 December 2027. Reporting clocks reward vendors and customers that detect exploitation quickly and document fixes. Our findings suggest that compliance evidence, such as time to remediate, will become a purchase criterion alongside detection accuracy, especially for hardware and software makers selling into Europe, which lifts the AI Vulnerability Management Market.

Growth Inhibitors

What Is Restraining the AI Vulnerability Management Market?

Alert fatigue and integration effort restrain adoption. Even with prioritization, AI generated findings still arrive faster than operations teams can patch, and many enterprises lack the change windows to apply fixes at machine speed. Bundled offerings, such as Microsoft Defender Vulnerability Management inside the Defender portal, also compress pricing for specialists. We noticed that buyers increasingly demand proof of closed tickets, not counts of findings, before expanding contracts.

What Are the Growth Opportunities?

Can Managed Remediation Services Close the Fix Gap for Mid-Sized Enterprises?

Mid-sized enterprises can detect more weaknesses than they can fix. Arctic Wolf launched Aurora Exposure Management on May 12, 2026 with a native patch add on named Resolve, and Qualys has built a managed risk operations alliance of 15 partners. Services is the fastest growing component at 17.9% CAGR from 2026 to 2035, and providers that guarantee closure times will capture it.

Will Autonomous Validation and Patching Create a Premium Software Tier?

Exploit validation and automated remediation justify higher price points because they remove manual verification. Qualys introduced TruConfirm exploit validation in 2025, and Agentic AI and autonomous remediation grows at 27.0% CAGR from 2026 to 2035. Large banks, federal agencies and cloud native software companies with disciplined change control are the first beneficiaries, since they can accept machine-initiated fixes under audit.

Can Connected Device and OT Exposure Become a Distinct Vertical?

ServiceNow completed its Armis acquisition on April 20, 2026 to extend exposure management across IT, OT, IoT and medical devices. Healthcare and life sciences grow at 17.0% CAGR and manufacturing and energy at 16.9% from 2026 to 2035 as unpatchable devices demand compensating controls. Vendors that combine device discovery with OT security workflows can serve hospitals, utilities and factories that conventional scanners cannot reach.

Segmentation Analysis

2025 (USD Billion)
2035 (USD Billion)
Software 2025: $2.05 Billion | 2035: $8.50 Billion
Software
Services 2025: $0.65 Billion | 2035: $3.40 Billion
Services
Software $2.05 Billion $8.50 Billion 15.2%
Services $0.65 Billion $3.40 Billion 17.9%

Which Component Leads the AI Vulnerability Management Market?

Software leads with USD 2.05 Billion in 2025, roughly 76% of revenue, because platform subscriptions from Tenable, Qualys, Rapid7 and CrowdStrike anchor most contracts. Services is the fastest growing component at 17.9% CAGR from 2026 to 2035 as managed risk operations centers and remediation programs expand; Qualys alone reports a managed risk operations alliance of 15 partners. Our assessment indicates that buyers with thin patching teams will purchase outcomes rather than licences.

2025 (USD Billion)
2035 (USD Billion)
Category A
Category B
Category C
Category D
Segment Item 2025 (USD Billion) 2035 (USD Billion) CAGR
Category A $10.0 USD Billion $40.0 USD Billion 16.0%
Category B $17.1 USD Billion $51.1 USD Billion 22.0%
Category C $24.2 USD Billion $62.2 USD Billion 16.0%
Category D $31.3 USD Billion $73.3 USD Billion 26.0%

Segment-wise data is locked

Unlock complete segment-wise numbers for By Technology.

Unlock Full Data
2025 (USD Billion)
2035 (USD Billion)
Category A
Category B
Category C
Category D
Segment Item 2025 (USD Billion) 2035 (USD Billion) CAGR
Category A $10.0 USD Billion $40.0 USD Billion 20.0%
Category B $17.1 USD Billion $51.1 USD Billion 26.0%
Category C $24.2 USD Billion $62.2 USD Billion 24.0%
Category D $31.3 USD Billion $73.3 USD Billion 26.0%

Segment-wise data is locked

Unlock complete segment-wise numbers for By End-User Industry.

Unlock Full Data

Growth Opportunities

Our analysis shows that three whitespace opportunities should generate disproportionate revenue through 2035.

Can Managed Remediation Services Close the Fix Gap for Mid-Sized Enterprises?

Mid-sized enterprises can detect more weaknesses than they can fix. Arctic Wolf launched Aurora Exposure Management on May 12, 2026 with a native patch add on named Resolve, and Qualys has built a managed risk operations alliance of 15 partners. Services is the fastest growing component at 17.9% CAGR from 2026 to 2035, and providers that guarantee closure times will capture it.

Will Autonomous Validation and Patching Create a Premium Software Tier?

Exploit validation and automated remediation justify higher price points because they remove manual verification. Qualys introduced TruConfirm exploit validation in 2025, and Agentic AI and autonomous remediation grows at 27.0% CAGR from 2026 to 2035. Large banks, federal agencies and cloud native software companies with disciplined change control are the first beneficiaries, since they can accept machine-initiated fixes under audit.

Can Connected Device and OT Exposure Become a Distinct Vertical?

ServiceNow completed its Armis acquisition on April 20, 2026 to extend exposure management across IT, OT, IoT and medical devices. Healthcare and life sciences grow at 17.0% CAGR and manufacturing and energy at 16.9% from 2026 to 2035 as unpatchable devices demand compensating controls. Vendors that combine device discovery with OT security workflows can serve hospitals, utilities and factories that conventional scanners cannot reach.

Regional Outlook

2025 (USD Billion)
2035 (USD Billion)
North Americ
Europe
Asia-Pacific
Middle East
Latin Americ
Region 2025 (USD Billion) 2035 (USD Billion) CAGR (%)
North America $10.0 USD Billion $40.0 USD Billion 9.0%
Europe $17.1 USD Billion $51.1 USD Billion 27.0%
Asia-Pacific $24.2 USD Billion $62.2 USD Billion 25.0%
Middle East & Africa $31.3 USD Billion $73.3 USD Billion 23.0%
Latin America $38.4 USD Billion $84.4 USD Billion 12.0%

Regional data is locked

Unlock complete regional numbers for this market.

Unlock Full Data

Competitive Landscape

NMSC's analysis indicates that competition now centers on who owns the asset graph, the exploit intelligence and the remediation workflow.

How Do Companies Compete in the AI Vulnerability Management Industry?

Vendors compete on prioritization accuracy, breadth of asset coverage and the speed from finding to fix. Specialists such as Tenable, Qualys and Rapid7 lead on scanner depth and installed base, while Microsoft, CrowdStrike and Alphabet use deployed agents, cloud estates and threat intelligence to bundle exposure features. Pricing ranges from per asset subscriptions to flexible consumption models, such as CrowdStrike Falcon Flex, which reached USD 1.69 Billion of ending ARR.

Which Competitor Archetypes Dominate the Market?

Three archetypes dominate. Exposure specialists, including Tenable, Qualys and Rapid7, sell depth of detection and risk scoring. Platform owners, including Microsoft, CrowdStrike, Alphabet and Palo Alto Networks, bundle exposure management with endpoint, cloud or network estates. Workflow owners, led by ServiceNow, win by turning findings into assigned and audited work. Managed providers such as Arctic Wolf sell closure as a service, and each archetype differentiates on ownership of data, context or execution.

How Do Leading Companies Differentiate Their Innovation Strategy?

Innovation centers on agents that act, exploit validation and wider asset coverage. Qualys added TruConfirm exploit validation and an agent marketplace, Tenable agreed to acquire Apex Security to cover the AI attack surface, and Rapid7 extended AI based security operations to Microsoft environments in January 2026. Palo Alto Networks promotes precision filtering that it says cuts vulnerability noise by up to 99%. Differentiation increasingly rests on proof of reduced risk.

Key Market Players

Based on research conducted by NMSC, we found that the following nine companies hold the strongest verified positions in this market.

Tenable Holdings, Inc. Qualys, Inc. Rapid7, Inc. Microsoft Corporation CrowdStrike Holdings, Inc. Alphabet Inc ServiceNow, Inc. Palo Alto Networks, Inc. Arctic Wolf Networks, Inc.

Latest Developments

We observed that earnings disclosures, acquisitions and regulatory dates in 2026 defined the competitive reset.

Date Event
August 2026 ServiceNow announced a six-solution Autonomous Security portfolio spanning exposure management, continuous vulnerability detection, application security, external attack-surface management, and incident response.
July 2026 Microsoft announced expanded Defender protections for AI environments, including preview prompt-injection protection that isolates emails carrying malicious AI instructions before delivery.
July 2026 Amazon GuardDuty introduced AI Protection for Bedrock and SageMaker workloads
June 2026 AWS launched an AI Security Best Practices standard in Security Hub CSPM with 31 automated controls covering Bedrock, Bedrock AgentCore, and SageMaker
June 2026 AWS added Bedrock Guardrails to AgentCore policies, allowing security teams to inspect agent-action outputs and calls to gateway targets in real time
May 2026 Google Cloud launched AI Threat Defense, an autonomous security platform combining Gemini reasoning and code-generation capabilities with expertise from Mandiant and Wiz

Expert Insights

Francis DeSouza

COO, Google Cloud and President, Security Products | Google Cloud

"When organizations are confronted with an AI-enabled surge in vulnerabilities, traditional security tooling and manual triage will fail to keep pace."

Analyst Interpretation

The statement emphasizes the need for AI-powered vulnerability management solutions that automate detection, prioritize exploitable weaknesses, and accelerate remediation. As vulnerability volumes increase and attackers operate faster, organizations are likely to need more scalable, intelligent security tools.

Investment Opportunities

Where Is Capital Flowing in the AI Vulnerability Management Market?

Strategic capital is flowing toward platform assembly. Google completed its USD 32 Billion acquisition of Wiz in March 2026, ServiceNow completed Armis in April 2026, and CrowdStrike funded acquisitions of SGNL and Seraphic Security. Investors can expect further tuck in deals for AI security, asset discovery and remediation automation. Cybersecurity insurance underwriters add a second pull by rewarding documented patch performance with better terms.

How Is Infrastructure Investment Supporting Market Expansion?

Vendors in the AI Vulnerability Management Market are investing in cloud regions, government grade hosting and agent coverage. Qualys achieved FedRAMP High authorization for its GovCloud platform, Tenable announced an agreement with the GSA OneGov program to invest in FedRAMP authorized cloud capabilities, and CrowdStrike plans regional deployments in India, Saudi Arabia and the UAE. Such investments lower adoption barriers for regulated buyers and support sovereign hosting demand across government, defense and financial services.
What ESG Considerations Matter for Investors?

Governance and risk reduction dominate the ESG case. CrowdStrike achieved ISO/IEC 42001:2023 certification for responsible AI management, which signals buyer demand for audited AI governance, and the EU Cyber Resilience Act introduces administrative fines for non-compliant manufacturers. Faster remediation reduces breach driven harm to consumers and patients. Our analysis shows that vendors able to document AI model controls and customer outcomes will attract institutional capital more readily.

Key Benefits for Stakeholders

How Do Enterprise Security Leaders Benefit from This Report?

Security leaders gain a structured view of which components, technologies and industries grow fastest, along with vendor positioning that supports platform selection. The forecasts of USD 3.15 Billion in 2026 and USD 11.90 Billion in 2035 help size budgets, and the segmentation shows where services can fill remediation gaps. The analysis also connects exposure programs to zero trust security initiatives, so teams can sequence investments.

How Do Investors and Financial Analysts Benefit?

Investors receive reconciled forecasts by component, technology, industry and region, with a CAGR of 15.9% from 2026 to 2035 and an absolute opportunity of USD 8.75 Billion. The competitive analysis separates specialists from platform owners, and the development log highlights acquisitions that reset valuation benchmarks. Analysts can also compare adjacent governance risk and compliance platform spending without double counting, because the scope excludes adjacent markets.

How Do Technology Vendors and Product Teams Benefit?

Vendors and product teams in the AI Vulnerability Management Market can benchmark agentic features, services attach rates and regional priorities against the fastest growing segments. Agentic AI and autonomous remediation grow at 27.0% CAGR, while Asia-Pacific grows at 18.2%, indicating where to localize first. The report also clarifies regulatory triggers, such as European reporting duties, that influence roadmap timing and partner selection.
Key Market Segments Evaluated

By Component

  • Software
  • Services

By Technology

  • Machine learning and predictive prioritization
  • Generative AI assistants
  • Agentic AI and autonomous remediation

By End-User Industry

  • BFSI
  • IT and telecom
  • Government and defense
  • Healthcare and life sciences
  • Manufacturing and energy
  • Retail and consumer

By Region

  • North America 
    • U.S.
    • Canada
    • Mexico
  • Europe 
    • UK
    • Germany
    • France
    • Italy
    • Spain
    • Sweden
    • Denmark
    • Finland
    • Netherlands
    • Rest of Europe
  • Asia-Pacific 
    • China
    • India
    • Japan
    • South Korea
    • Taiwan
    • Indonesia
    • Vietnam
    • Australia
    • Philippines
    • Malaysia
    • Rest of APAC
  • Middle East & Africa 
    • Saudi Arabia
    • UAE
    • Egypt
    • Israel
    • Turkey
    • Nigeria
    • South Africa
    • Rest of MEA
  • Latin America 
    • Brazil
    • Argentina
    • Chile
    • Colombia
    • Rest of LATAM

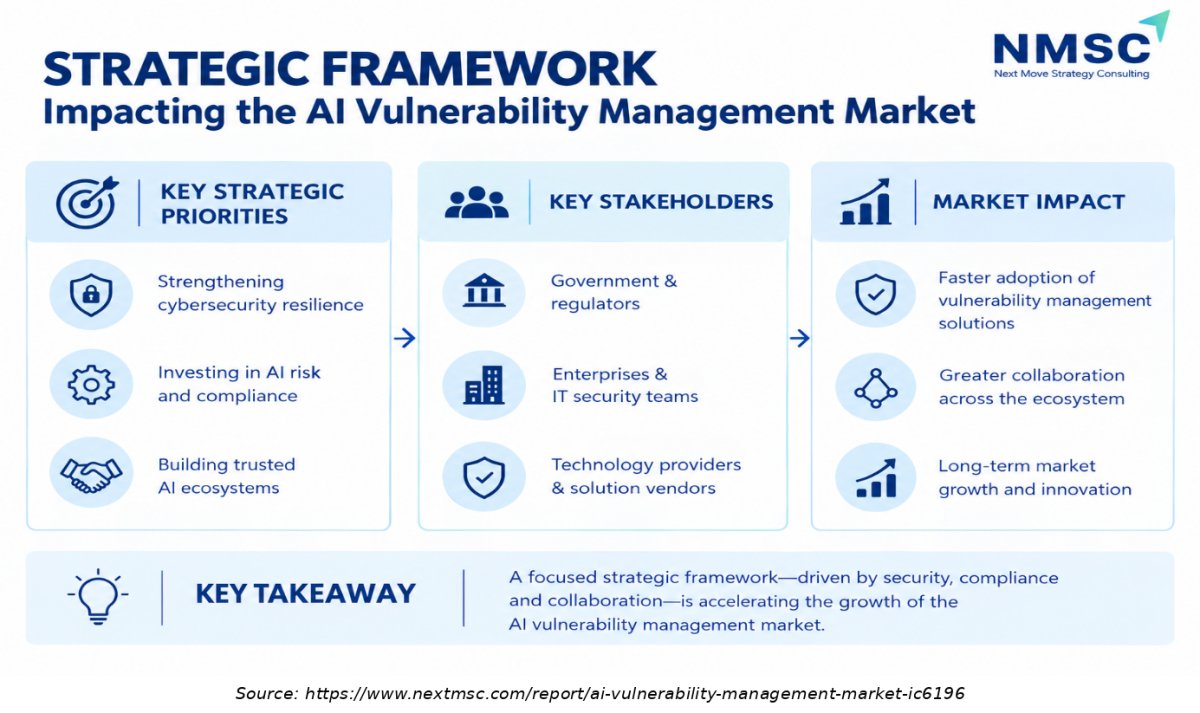
Strategic Framework Impacting the AI Vulnerability Management Market
Strategic Framework Impacting the AI Vulnerability Management Market
The infographic on Strategic Framework Impacting the AI Vulnerability Management Market highlights the key strategies driving AI adoption in vulnerability management. It focuses on automated vulnerability detection, risk-based prioritization, predictive threat analysis, and remediation planning. These strategic approaches help organizations identify security gaps faster, optimize resources, reduce cyber risks, and strengthen their overall security posture.

Conclusion & Recommendations

The AI Vulnerability Management Market is expected to grow from USD 3.15 Billion in 2026 to USD 11.90 Billion in 2035, a CAGR of 15.9% that reflects the shift from scanning to autonomous exposure reduction. Software remains the larger component, yet Services and agentic technologies grow faster. We found that structural demand rests on record vulnerability volume, regulation and AI accelerated discovery, which together keep remediation capacity the scarce resource.

What Strategic Positioning Recommendations Does NMSC Offer?

We recommend that specialists in the AI Vulnerability Management Market differentiate on verified remediation outcomes and cloud neutrality, while platform owners should expose open data connectors that reduce lock in concerns. Service providers should productize closure guarantees tied to measured time to fix. All vendors should prioritize Asia-Pacific and Middle East expansion with regional hosting, and publish audited controls for AI agents that act on customer systems.

What Is the Investment Attractiveness of the AI Vulnerability Management Market?

Attractiveness is high but selective. The USD 8.75 Billion expansion from 2026 to 2035 is supported by regulation and large strategic acquisitions, yet pricing pressure from bundles limits returns for undifferentiated scanners. Agentic remediation, services and healthcare device exposure offer the strongest growth at 27.0%, 17.9% and 17.0% CAGR respectively, so capital should Favor assets with proprietary exploit data or execution workflows.

What Are the Market Shifts and Key Risks in the AI Vulnerability Management Market?

Key shifts include consolidation into platforms, the rise of autonomous remediation and the entry of frontier AI into vulnerability discovery. Risks include alert overload, unsafe automated changes, vendor lock in and uneven regional regulation. Our analysis shows that a major failed automated patch could slow adoption, so vendors need rollback controls, audit trails and customer approval policies built into every agentic workflow.

What Are the Primary Growth Pathways Through 2035?

Primary pathways are managed remediation for mid-sized enterprises, autonomous validation tiers for regulated buyers, connected device exposure for healthcare and industry, and regional expansion in Asia-Pacific and the Middle East. Each pathway is supported by quantified segment growth in this report. We expect vendors that combine at least two pathways, such as services with agentic tooling, to outgrow the 15.9% market CAGR.

FAQs

Sources & References

1.

Tenable Holdings, Inc., fourth quarter and full year 2025 results

investors.tenable.com/node/14706/html
2.

Tenable, intent to acquire Apex Security

tenable.com
3.

Qualys, Inc., fourth quarter and full year 2025 results

investor.qualys.com/node/18901
4.

Rapid7, Inc., fourth quarter and full year 2025 results

investors.rapid7.com
5.

CrowdStrike Holdings, Inc., fourth quarter and fiscal 2026 results

ir.crowdstrike.com
6.

Microsoft, Defender Vulnerability Management documentation

learn.microsoft.com
7.

Microsoft, Security Exposure Management integration

learn.microsoft.com
8.

Google Cloud Press Corner, Google completes acquisition of Wiz

googlecloudpresscorner.com
9.

ServiceNow newsroom, ServiceNow to acquire Armis

newsroom.servicenow.com
10.

Armis, ServiceNow completes Armis acquisition

armis.com
11.

Palo Alto Networks, Cortex Exposure Management

paloaltonetworks.com
12.

Arctic Wolf, Aurora Exposure Management press release

arcticwolf.com
13.

European Commission, Safer and more secure digital products

commission.europa.eu
14.

European Commission, Cyber Resilience Act reporting obligations

digital-strategy.ec.europa.eu
15.

Anthropic, Project Glasswing

anthropic.com/glasswing
16.

CVE Program

cve.org
17.

NIST, National Vulnerability Database

nvd.nist.gov
18.

CISA, Known Exploited Vulnerabilities Catalog

cisa.gov

About the Author

Mayurima Roy

Mayurima Roy

Mayurima Roy is Research Analyst at Next Move Strategy Consulting, where she has spent 4 years working across the firm's full industry coverage rather than a single fixed vertical. Her work centers on structured research, ongoing trend tracking, competitive assessment, and insight-led content development, translating complex market data into clear, decision-ready narratives that support informed client decision-making across diverse global industries, market sectors, and world regions every day.

About the Reviewer

Supradip Baul

Supradip Baul

Supradip Baul is an accomplished business consultant and strategist with over a decade of rich experience in market intelligence, strategy, technology, and business transformation. His work has included rigorous qualitative and quantitative analysis across multiple industries, helping clients shape investment decisions and long-term roadmaps. Earlier in his career, he was associated with Gartner, where he contributed to industry-leading reports and market share analyses. He has worked with leading global companies and holds an MBA with a dual specialization in Marketing and Finance.

Download Free Sample

Mohit Agarwal

MOHIT AGARWAL

Chief Manager

DryChem India Pvt. Ltd.

Next Move Strategy Consulting is an amazing team of consultants. We required a market study report for our investors on top priority and the team went above and beyond our expectations to deliver the same with ample supporting data within a short time span enabling us to secure the investments and keep our project timeline maintained. Their professionalism, attention to detail, and timely delivery of actionable recommendations have left a lasting impression on our organization.

Rishabh Jogani

RISHABH JOGANI

Strategy Analyst

Accenture Japan

We are incredibly impressed with the market report on the real estate market in India provided by Next Move Strategy Consulting. The report was thorough, insightful, and well-structured, offering deep analysis and actionable recommendations. It not only captured the current trends and dynamics but also provided a forward-looking perspective that has been invaluable for our strategic planning. Their team demonstrated exceptional professionalism, attention to detail, and a profound understanding of the industry. The data-driven insights and clarity of presentation exceeded our expectations, making complex market trends easy to understand. We highly recommend Next Move Strategy Consulting to anyone looking for reliable and comprehensive market research services. Their expertise has given us the confidence to navigate the complexities of the Indian real estate market with clarity and foresight.

Kishu Kanda

KISHU KANDA

Strategy Analyst

Accenture

We purchased the AI Consumer Market Report from this company. Not only did they customize the report to meet our specific requirements, but they also showed great flexibility in accommodating our budget. The report we received fully met our expectations. Additionally, they provided prompt and thorough responses to both our pre-purchase and follow-up questions. We look forward to working with this company again in the future.

Pratyush Kumar Das

PRATYUSH KUMAR DAS

Assistant Manager

Polycab India Limited

We would like to express our appreciation for the data and insights provided by nextmsc. We are very pleased with the quality and depth of the information, which has proven to be highly valuable and beneficial for our business decision-making.

Ross J Mckenzie

ROSS J MCKENZIE

Business Insight Manager

Staysure Group

“Next MSC have been incredibly helpful in providing detailed & robust information on our market, alongside quantifying growth by different segments. The process to procure was simple and easy, with sample reports and regular contact to ensure we had what we needed. Succinct detail on their sources & methodologies is also greatly received, allowing transparency in this respect helps build trust in the detail you pay for. Joseph in particular was fantastic, and helped ensure efficient provision of the insight pack – thank you NMSC!”.

Custom Market Research Services

We will customize the research for you if the listed report does not fully match your requirements.

Get 30% Free Customization

Select License

This website uses cookies to ensure you get the best experience on our website. Learn more

✖