Systems Market")
Australia Cone-Beam Computed Tomography (CBCT) Systems Market by Type (Floor Mounted and Wall Mounted), by Patient Position (Seated, Supine, and Standing), by Detector Type (Image Intensifier and Flat-Panel Detector), by Field of View (Small FOV Systems, Medium FOV Systems, and Large FOV Systems), by Application (Dental, ENT Applications, Orthopedic Conditions, and Others), and by End-Users (Dental Clinics, Hospitals, and Others)– Opportunity Analysis and Industry Forecast, 2025–2030
Industry: Healthcare | Lastest Edition: December 23, 2025 | No of Pages: 127 | No. of Tables: 93 | No. of Figures: 58 | Format: PDF | Report Code : HC826
Australia CBCT Systems Market Overview
Australia CBCT Systems Market size was valued at USD 30.2 million in 2024, and is projected to reach to USD 34.9 million by 2030, with a CAGR of 1.1%. In terms of volume, the market size was 372 units in 2024, and is projected to reach 490 units by 2030, with a CAGR of 3.3% from 2025 to 2030.
Several factors such as Rising Oral Health Issues along with Increasing Government Initiatives propel CBCT market growth. However, conflict with economic conditions across various regions in Australia limit access to CBCT technology, particularly in rural areas. On the contrary, integration of artificial intelligence (AI) in CBCT systems presents lucrative opportunity for market expansion.
Moreover, leading firms such as Vatech Company Ltd. along with Carestream Dental, Koninklijke Philips N.V., 3Shape and J. Morita Mfg. Corporation are consistently developing new products and establishing strategic partnerships across different sectors to improve their growth in the market.
Rising Oral Health Issues Drives Australia CBCT Systems Market Growth
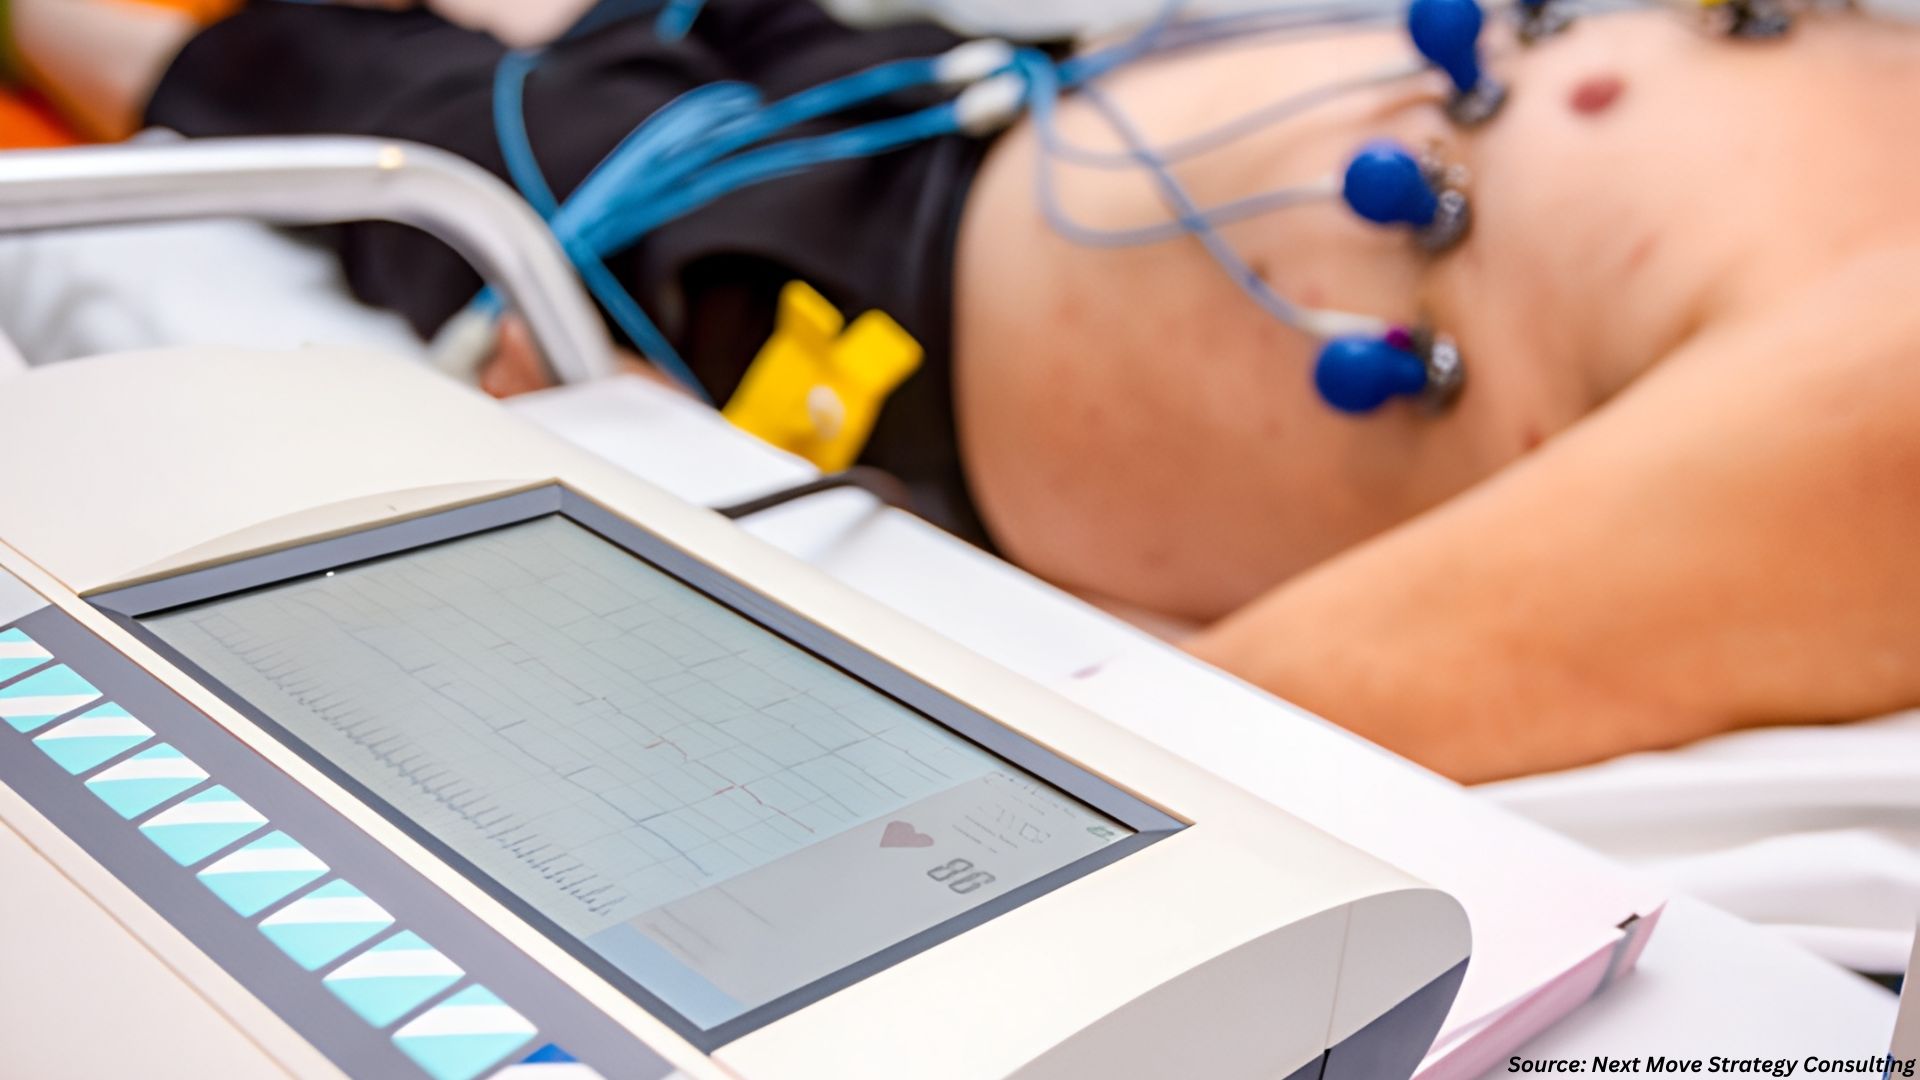
The increasing oral health issues in the country drives the market trends, as the growing occurrence of dental conditions elevates the demand for accurate diagnostic tools. With the rise in gum infections, tooth decay and implant needs, medical professionals are adopting advanced imaging technologies for better diagnostics and treatment.
The recent report from the Broadcasting Corporation shows that in 2023 Australia saw more than 87,000 hospital admissions related to dental issues. So, the increasing concerns about dental health are driving the need for advanced imaging technologies that leads to a faster uptake of the market.
Increasing Government Initiatives Drives the Australia CBCT Systems Market Demand
Government funding in Australia drives the expansion of the CBCT market by enhancing expenditures in healthcare, research, infrastructure and the implementation of advanced diagnostic technologies. As governments prioritize healthcare modernization, investments in advanced imaging systems including CBCT are helping on diagnostic accuracy and patient care.
As per the latest report published by the Department of Health and Aged Care of the Australian Government, they announced an USD 7.86 billion investment toward strengthening healthcare, allocated across the 2022-2025 budgets. These investments are boosting the acquisition of advanced imaging solutions that enhances healthcare infrastructure and also improving treatment planning, diagnostic accuracy and medical treatment.
Variability In Economic Conditions Limits the Australia CBCT Systems Market Expansion
Variability in economic conditions across different regions in Australia restricts access to CBCT technology, especially in rural areas, where financial limitations and lower demand make it challenging for healthcare providers to invest in and maintain these advanced imaging systems.
Integration of Artificial Intelligence (AI) in CBCT Systems Presents Lucrative Opportunity for Market Expansion
The introduction of artificial intelligence (AI) in CBCT market is anticipated to produce significant opportunities for market growth by enhancing diagnostic accuracy. AI algorithms streamline the analysis of imaging data allowing for quicker identification of deformity and alleviating the workload of health professionals which overall improves patient outcomes and heightens the adoption rates.
Additionally, the use of machine learning for image optimization and predictive analysis is expected to simplify the workflows reducing the need for manual intervention, and enhancing the overall effectiveness of CBCT imaging across different healthcare applications.
Competitive Landscape
The promising key players operating in the Australia CBCT systems industry includes Vatech Co., Ltd., Carestream Dental, Koninklijke Philips N.V., Acteon Group, J. Morita Mfg. Corp., Dentsply Sirona Inc., HDX WILL, CurveBeam AI, DEXIS LLC, 3Shape and others.
Australia CBCT Systems Market Key Segments
By Type
-
Floor Mounted
-
Wall Mounted
By Patient Position
-
Seated
-
Supine
-
Standing
By Detector Type
-
Image Intensifier
-
Flat-Panel Detector
By Field of View
-
Small FOV Systems
-
Medium FOV Systems
-
Large FOV Systems
By Applications
-
Dental
-
Oral and Maxillofacial surgery (OMFS)
-
Endodontics
-
Implant Dentistry
-
Orthodontics
-
General Dentistry
-
Temporomandibular Joint (TMJ)
-
Periodontics
-
Forensic Dentistry
-
-
ENT Applications
-
Orthopedic Conditions
-
Neural and Spine
-
Veterinary
-
Other Application
By End-Users
-
Dental Clinics
-
Hospitals
-
Other End-User
Key Players
-
Vatech Co., Ltd.
-
Carestream Dental
-
Koninklijke Philips N.V.
-
Acteon Group
-
J. Morita Mfg. Corp.
-
Dentsply Sirona Inc.
-
HDX WILL
-
CurveBeam AI
-
DEXIS LLC
-
3Shape
REPORT SCOPE AND SEGMENTATION:
|
Parameters |
Details |
|
Market Size Value in 2024 |
USD 30.2 million |
|
Revenue Forecast in 2030 |
USD 34.9 million |
|
Value Growth Rate |
CAGR of 1.1% from 2025 to 2030 |
|
Market Volume in 2024 |
372 Units |
|
Market Forecast in 2030 |
490 Units |
|
Volume Growth Rate |
CAGR of 3.3% from 2025 to 2030 |
|
Analysis Period |
2024–2030 |
|
Base Year Considered |
2024 |
|
Forecast Period |
2025–2030 |
|
Market Size Estimation |
Million (USD) |
|
Growth Factors |
|
|
Companies Profiled |
10 |
|
Market Share |
Available for 10 companies |
|
Customization Scope |
Free customization (equivalent up to 80 working hours of analysts) after purchase. Addition or alteration to country, regional, and segment scope. |
|
Pricing and Purchase Options |
Avail customized purchase options to meet your exact research needs. |
 Systems Market Revenue by 2030 (Billion USD)")
 Systems Market Segmentation")
 Systems Market Major Regions")
About the Author
 Jayanta Das is a senior research analyst delivering high-impact market intelligence across global markets. He leads comprehensive studies covering market assessment, forecasting, competitive evaluation, regulatory review, and trend analysis. Known for his structured and methodical approach, Jayanta excels at converting complex datasets into clear, decision-ready insights for leadership teams. His work supports strategic planning through credible sourcing, analytical precision, strong validation frameworks, and well-structured, business-focused reporting that enables confident decision-making.
About the Reviewer
 Supradip Baul is an accomplished business consultant and strategist with over a decade of rich experience in market intelligence, strategy, technology, and business transformation. His work has included rigorous qualitative and quantitative analysis across multiple industries, helping clients shape investment decisions and long-term roadmaps. Earlier in his career, he was associated with Gartner, where he contributed to industry-leading reports and market share analyses. He has worked with leading global companies and holds an MBA with a dual specialization in Marketing and Finance.
At Next Move Strategy Consulting, we understand that insightful market research is the cornerstone of successful business decisions. That's why we employ a robust and multifaceted approach, combining various methodologies to deliver the most accurate and actionable data for our clients.

Research Landscape
We navigate the world of research with two primary approaches:
Qualitative Approach
Our qualitative research methodologies involve immersive techniques such as in-depth interviews, focus groups, and observational studies. By engaging directly with individuals and stakeholders, we uncover valuable insights that quantitative data alone may overlook.

Quantitative Research
In tandem with qualitative methodologies, NMSC leverages the power of Quantitative Research to provide a robust foundation of numerical insights. Through systematic data collection and analysis, we quantify patterns, preferences, and market trends, offering a comprehensive view of the business landscape.
Our quantitative research approach employs diverse tools, including surveys, experiments, and statistical modelling. These methodologies enable us to gather data from a large and representative sample, ensuring the statistical significance of our findings. By employing structured questionnaires and standardized data collection methods, we guarantee the reliability and validity of the information we present to our clients.
Quantitative research is particularly effective in measuring the prevalence of trends, assessing market size, and gauging the impact of various factors on consumer behavior. The numerical precision attained through this approach equips our clients with actionable insights, facilitating data-driven decision-making and strategy formulation.


Our Specialized Toolbox for Industry-Specific Market Research
We deploy a specialized arsenal of techniques tailored to meet your unique requirements. Here's a glimpse into our comprehensive toolbox:

Information Procurement
The stage entails acquiring market data or relevant information through various sources and methodologies.


Market Research Approach
We utilize both top-down and bottom-up approaches in market research analysis to achieve a comprehensive understanding of the market dynamics, leveraging the broad perspective of industry trends and macroeconomic factors alongside detailed insights from specific segments and individual companies.

Porters Five Forces Analysis
We conduct Porter's Five Forces analysis to evaluate the competitive landscape of an industry, providing us with insights into factors that affect profitability and strategic positioning.

SWOT Analysis

Forecasting
We utilize a forecasting model to predict future consumption by considering parameters like population, economics, regulations, market competition, drivers, constraints, technology, and pricing. We also employ statistical techniques such as multilinear regression, exponential smoothing, moving average, ARIMA, and Monte Carlo simulations for accurate predictions. In econometric forecasting, we analyzed short-term and long-term event impacts, attributing values based on regulatory frameworks, economic factors, and market events.


 Speak to Our Analyst


 Systems Market")