Cancer Drug Market Global Industry Analysis and Forecast (2026-2035)

Cancer drug market size is estimated at USD 330.95 billion in 2026 and projected to reach USD 854.61 billion by 2035, growing at a CAGR of 11.12% from 2026 to 2035. Key growth drivers include expanding precision oncology, rising antibody-drug conjugate and immunotherapy adoption, increasing cellular and gene therapy approvals, and growing demand for targeted cancer treatments, with North America leading the market and Asia-Pacific registering the fastest growth.

Download Free Sample PDF
Base Year (2025)
$272.76 Billion
Forecast (2035)
$854.61 Billion
CAGR (2026-2035)
11.1%
Top Region
North America

What Is the Cancer Drug Market Size?

The global cancer drug market size was valued at USD 272.76 billion in 2025 and is estimated at USD 330.95 billion in 2026, forecast to reach USD 854.61 billion by 2035, expanding at an 11.12% CAGR between 2026 and 2035. North America leads with approximately 47% share, while Targeted Small Molecules dominate all other modalities with approximately 22% share.

We observed that growth is broad-based across every segmentation axis, with cellular and gene therapy and antibody-drug conjugates driving the dominant structural shifts through 2035, as the cancer drug market continues consolidating around precision oncology approaches.

Cancer Drug Market Global Industry Analysis and Forecast (2026-2035) Revenue Forecast

Values in USD Billion

2025 $272.76 Billion
2025
2026 $330.95 Billion
2026
2027 $367.75 Billion
2027
2028 $408.65 Billion
2028
2029 $454.09 Billion
2029
2030 $504.58 Billion
2030
2031 $560.69 Billion
2031
2032 $623.04 Billion
2032
2033 $692.32 Billion
2033
2034 $769.31 Billion
2034
2035 $854.61 Billion
2035

Key Takeaways

By Modality: Targeted Small Molecules held the largest share of approximately 22% (USD 60.01 billion) in 2025; Cellular and Gene Therapy is the fastest-growing sub-segment.

By Cancer Indication: Solid Tumors held the largest share of approximately 72% (USD 196.39 billion) in 2025; Hematologic Malignancies is the fastest-growing sub-segment.

By Drug Type: Innovative Branded held the largest share of approximately 74% (USD 201.84 billion) in 2025; Biosimilar is the fastest-growing sub-segment.

Dominant Region: North America dominated with approximately 47% revenue share (USD 128.20 billion) in 2025.

Fastest-Growing Region: Asia-Pacific is expected to register the highest CAGR during 2026–2035.

Dominant Country: U.S. led with approximately USD 108.97 billion in 2025.

Fastest-Growing Country: India is the fastest-growing country from 2026–2035.

What Does the Cancer Drug Market Encompass?

The cancer drug market encompasses cytotoxic chemotherapy, endocrine therapy, targeted small molecules, antibody-drug conjugates, targeted biologics, immunotherapy, radiopharmaceuticals, and cellular and gene therapy products used to treat solid tumors and hematologic malignancies. Our assessment indicates that the scope spans innovative branded, generic, biosimilar, and other follow-on products delivered through oral, intravenous, subcutaneous, and other administration routes across direct institutional, wholesaler, specialty pharmacy, and retail pharmacy sales channels. The category has evolved from broad cytotoxic chemotherapy into a differentiated precision oncology platform combining immune checkpoint inhibitors, antibody-drug conjugates, and CAR-T cell therapies that target specific tumor biology rather than generalized cell division.

Regulatory bodies including the U.S. Food and Drug Administration continue to grant priority review and breakthrough therapy designations that accelerate approval timelines for differentiated oncology mechanisms, as reflected in Bristol Myers Squibb's regulatory approvals spanning Breyanzi, Opdivo combination regimens, and Camzyos across multiple geographies. We observed that technology adoption is shifting toward antibody-drug conjugates and T-cell receptor therapies capable of addressing previously undruggable targets. NMSC's analysis indicates that platform consolidation through licensing and acquisition, including Bristol Myers Squibb's acquisition of Orbital Therapeutics and strategic partnership with BioNTech, is reshaping competitive dynamics across the cancer drug market.

Ecosystem Analysis Of The Cancer Drug Market

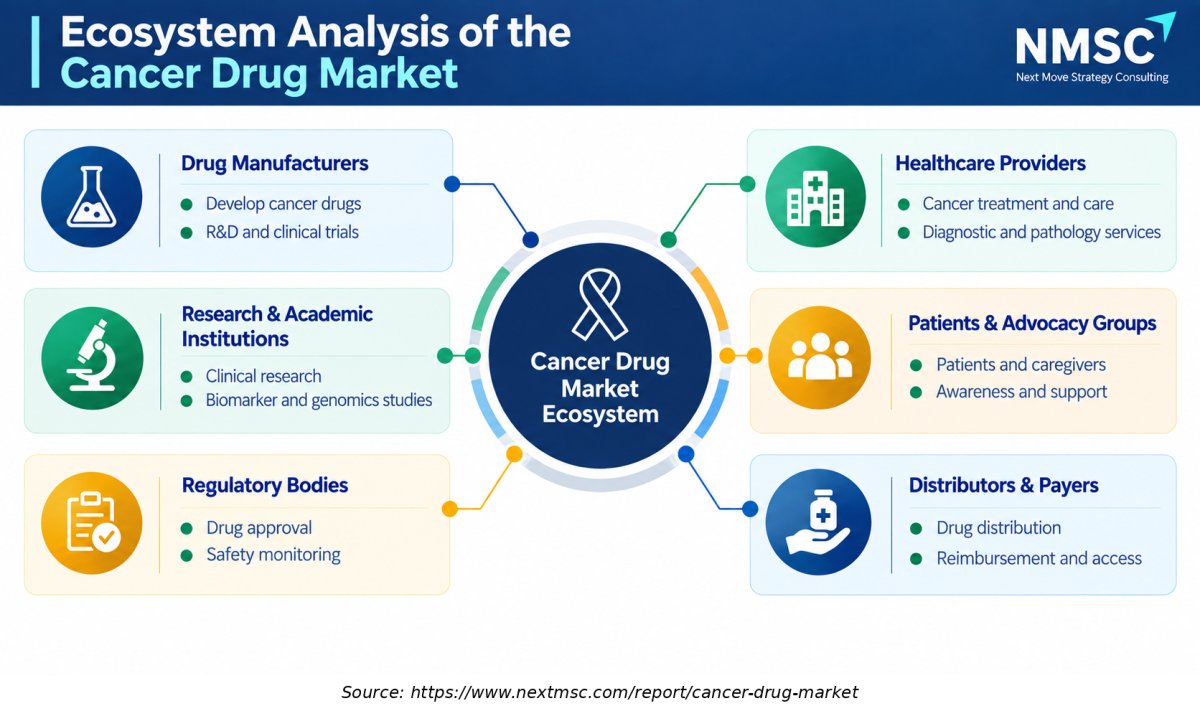
This infographic illustrates the interconnected ecosystem analysis of the cancer drug market, highlighting drug manufacturers, research institutions, regulatory bodies, healthcare providers, patients and advocacy groups, and distributors and payers. A central market hub connects these stakeholders, while the bottom section highlights key growth enablers such as technological advances, strategic collaborations, supportive regulation, increasing access, and rising R&D investment.

Market Drivers & Dynamics

Interactive Dataset
Accelerating FDA priority review and breakthrough therapy designations driver +2.8% North America, Europe 2026-2035
Expanding antibody-drug conjugate and T-cell engager pipeline investment driver +2.3% Global 2026-2035
Rising cell and gene therapy approvals for hematologic malignancies driver +1.9% North America, Europe, Asia-Pacific 2026-2035
Expanding perioperative and earlier-stage immunotherapy indication approvals driver +1.6% Global 2026-2033
Growing oncology biosimilar approval activity post-patent expiry driver +1.2% Asia-Pacific, Latin America 2026-2035
High cell and gene therapy manufacturing and treatment cost restraint -1.5% Global 2026-2032
Patent expiry and biosimilar competition eroding branded drug revenue restraint -1.3% North America, Europe 2026-2035
Complex, resource-intensive clinical trial requirements for novel modalities restraint -1.0% Global 2026-2032
Uneven reimbursement and regulatory frameworks across covered geographies restraint -0.7% Asia-Pacific, MEA, LATAM 2026-2030
Source: Next Move Strategy Consulting

Growth Drivers

What Is the Primary Growth Driver of the Cancer Drug Market?

Accelerating FDA priority review and breakthrough therapy designations is the primary growth driver of the market. The FDA continues to grant expedited review pathways for differentiated oncology mechanisms, as reflected in breakthrough therapy designations across novel antibody-drug conjugates and approvals for cell therapies such as Breyanzi across distinct lymphoma indications. We observed that this regulatory-driven demand continues to anchor baseline investment in precision oncology drug development across developed pharmaceutical markets.

How Is Antibody-Drug Conjugate Investment Driving Market Growth?

Expanding antibody-drug conjugate and T-cell engager pipeline investment is accelerating cancer drug market growth as developers pursue mechanisms capable of addressing previously undruggable targets. AstraZeneca's EVP of Oncology Haematology, Dave Fredrickson, has highlighted precision medicine and antibody-drug conjugate innovation as core research priorities within the company's oncology strategy. Our assessment indicates that this platform-driven investment, combined with cell and gene therapy expansion, is compressing development timelines for next-generation oncology mechanisms.

Growth Inhibitors

What Is Restraining Cancer Drug Market Growth?

High cell and gene therapy manufacturing and treatment cost restrains broader cancer drug market adoption, particularly across healthcare systems with constrained reimbursement budgets. Patent expiry and biosimilar competition further erode branded drug revenue for established oncology therapies as exclusivity periods conclude. We found that smaller biotechnology developers face particular exposure, as limited manufacturing and clinical infrastructure reduce their ability to scale complex cell therapy production relative to larger, vertically integrated pharmaceutical competitors.

What Are the Growth Opportunities?

How Can Developers Capture the Antibody-Drug Conjugate Opportunity?

Antibody-drug conjugate platforms addressing previously undruggable solid tumor targets present a whitespace opportunity for developers offering validated, differentiated payload-linker technology. Companies that commercialize next-generation antibody-drug conjugates beyond HER2 and TROP2 targets stand to capture premium pricing and expedited regulatory review as breakthrough therapy designations continue favoring differentiated mechanisms.

Where Does Perioperative Immunotherapy Expansion Create Whitespace?

Moving immune checkpoint inhibitors into earlier-stage, perioperative treatment settings represents an underpenetrated opportunity for developers with established immunotherapy franchises. Companies that generate disease-free survival data supporting earlier intervention can secure expanded label indications, benefiting from larger treatment-eligible patient populations relative to late-stage disease settings alone.

How Can Biosimilar Manufacturers Benefit from Patent Expiry Cycles?

Patent expiry across established monoclonal antibody and targeted therapy franchises represents a fast-growing opportunity for biosimilar manufacturers with validated regulatory and manufacturing capability. Firms that build oncology-specific biosimilar development expertise can differentiate from generalist biosimilar competitors, capturing recurring revenue tied to expanding patent cliff activity through 2035.

Segmentation Analysis

2025 (USD Billion)
2035 (USD Billion)
Cytotoxic Chemotherapy 2025: $38.19 Billion | 2035: $68.37 Billion
Cytotoxic Ch
Endocrine Therapy 2025: $24.55 Billion | 2035: $51.28 Billion
Endocrine Th
Targeted Small Molecules 2025: $60.01 Billion | 2035: $162.38 Billion
Targeted Sma
Antibody-Drug Conjugates 2025: $19.09 Billion | 2035: $94.01 Billion
Antibody-Dru
Targeted Biologics 2025: $35.46 Billion | 2035: $94.01 Billion
Targeted Bio
Immunotherapy 2025: $57.28 Billion | 2035: $188.01 Billion
Immunotherap
Radiopharmaceuticals 2025: $8.18 Billion | 2035: $42.73 Billion
Radiopharmac
Cellular and Gene Therapy 2025: $30.00 Billion | 2035: $153.82 Billion
Cellular and
Cytotoxic Chemotherapy $38.19 Billion $68.37 Billion 4.75%
Endocrine Therapy $24.55 Billion $51.28 Billion 6.49%
Targeted Small Molecules $60.01 Billion $162.38 Billion 9.49%
Antibody-Drug Conjugates $19.09 Billion $94.01 Billion 15.95%
Targeted Biologics $35.46 Billion $94.01 Billion 9.26%
Immunotherapy $57.28 Billion $188.01 Billion 11.63%
Radiopharmaceuticals $8.18 Billion $42.73 Billion 16.77%
Cellular and Gene Therapy $30.00 Billion $153.82 Billion 17.01%

Which Modality Segment Dominates the Cancer Drug Market?

Targeted Small Molecules, spanning kinase inhibitors, DNA damage response inhibitors, and proteasome inhibitors, led the market with USD 60.01 billion in 2025, supported by broad oral administration convenience and established manufacturing infrastructure. We observed that Cellular and Gene Therapy is the fastest-growing modality as CAR-T cell therapy approvals continue expanding across relapsed and refractory hematologic malignancy indications.

Growth Opportunities

Our analysis shows that three forward-looking opportunities stand out for stakeholders positioning within the cancer drug market over the 2026-2035 forecast period.

How Can Developers Capture the Antibody-Drug Conjugate Opportunity?

Antibody-drug conjugate platforms addressing previously undruggable solid tumor targets present a whitespace opportunity for developers offering validated, differentiated payload-linker technology. Companies that commercialize next-generation antibody-drug conjugates beyond HER2 and TROP2 targets stand to capture premium pricing and expedited regulatory review as breakthrough therapy designations continue favoring differentiated mechanisms.

Where Does Perioperative Immunotherapy Expansion Create Whitespace?

Moving immune checkpoint inhibitors into earlier-stage, perioperative treatment settings represents an underpenetrated opportunity for developers with established immunotherapy franchises. Companies that generate disease-free survival data supporting earlier intervention can secure expanded label indications, benefiting from larger treatment-eligible patient populations relative to late-stage disease settings alone.

How Can Biosimilar Manufacturers Benefit from Patent Expiry Cycles?

Patent expiry across established monoclonal antibody and targeted therapy franchises represents a fast-growing opportunity for biosimilar manufacturers with validated regulatory and manufacturing capability. Firms that build oncology-specific biosimilar development expertise can differentiate from generalist biosimilar competitors, capturing recurring revenue tied to expanding patent cliff activity through 2035.

Porter’s Five Forces Framework for the Cancer Drug Market
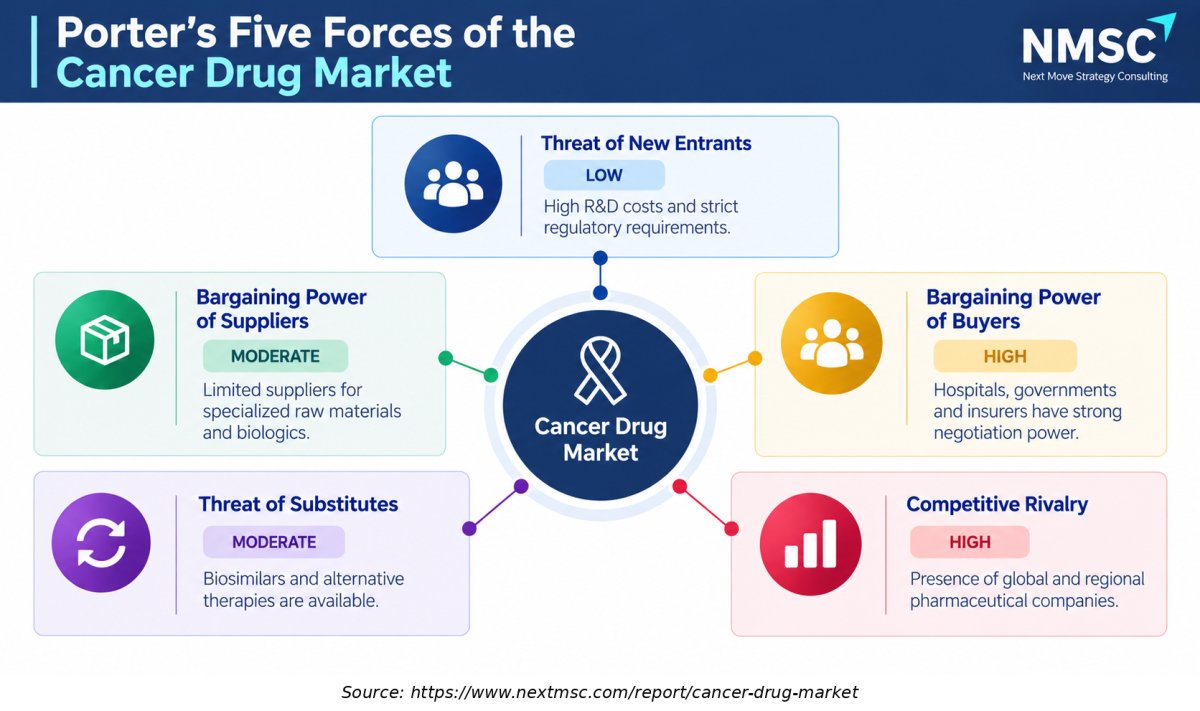
This infographic presents Porter’s Five Forces framework for the market, examining the threat of new entrants, supplier bargaining power, buyer bargaining power, threat of substitutes, and competitive rivalry. Each force is supported by market-specific factors including regulatory barriers, supplier dependence, payer influence, alternative therapies, pharmaceutical competition, R&D intensity, and the growing role of generics and biosimilars.

Regional Outlook

2025 (USD Billion)
2035 (USD Billion)
North Americ
Europe
Asia-Pacific
Middle East
Latin Americ
Region 2025 (USD Billion) 2035 (USD Billion) CAGR (%)
North America $10.0 USD Billion $40.0 USD Billion 9.0%
Europe $17.1 USD Billion $51.1 USD Billion 27.0%
Asia-Pacific $24.2 USD Billion $62.2 USD Billion 25.0%
Middle East & Africa $31.3 USD Billion $73.3 USD Billion 23.0%
Latin America $38.4 USD Billion $84.4 USD Billion 12.0%

Regional data is locked

Unlock complete regional numbers for this market.

Unlock Full Data

Competitive Landscape

We observed that the market features a moderately consolidated competitive landscape, dominated by large multinational pharmaceutical companies with diversified oncology portfolios alongside focused biotechnology developers.

Dimension Description
Market Structure Moderately consolidated; the 20 companies profiled in this report include diversified large-cap pharmaceutical companies with broad oncology portfolios alongside focused biotechnology developers specializing in specific modalities or indications.
Innovation Focus Antibody-drug conjugate payload-linker technology, cellular and gene therapy manufacturing scale-up, and perioperative immunotherapy indication expansion dominate current innovation pipelines across leading developers.
M&A Activity Strategic acquisitions and licensing partnerships, including Bristol Myers Squibb's acquisition of Orbital Therapeutics and partnership with BioNTech, continue to consolidate platform technology capability within diversified oncology portfolios.

How Do Companies Compete in the Cancer Drug Market?

Companies compete primarily on clinical differentiation, regulatory approval speed, and indication breadth across the industry. Diversified pharmaceutical companies such as Bristol Myers Squibb and AstraZeneca leverage broad oncology portfolios spanning multiple modalities to serve diverse treatment settings, while focused biotechnology developers compete through deep specialization in specific mechanisms such as antibody-drug conjugates or cell therapy.

Which Competitive Archetypes Dominate the Cancer Drug Market?

Two archetypes dominate the market: diversified large-cap pharmaceutical companies offering broad oncology portfolios across multiple modalities, and focused biotechnology developers specializing in specific mechanisms or indications. Bristol Myers Squibb and AstraZeneca exemplify the diversified archetype through comprehensive immunotherapy, cell therapy, and targeted therapy portfolios, while companies such as Incyte and Exelixis exemplify the focused archetype serving specific modality or indication niches.

How Are Companies Differentiating Through Innovation in Cancer Drugs?

Innovation and differentiation strategy increasingly center on antibody-drug conjugate payload technology and cell therapy manufacturing scale-up validated through pivotal clinical trial data. Breakthrough Therapy Designations for novel antibody-drug conjugates and expanded approvals for therapies like Breyanzi exemplify how developers translate differentiated science into regulatory and commercial advantage. Our analysis shows that developers unable to demonstrate differentiated clinical data risk exclusion from premium oncology treatment guidelines.

What M&A and Expansion Activity Is Shaping the Cancer Drug Market?

Strategic acquisitions, licensing partnerships, and global collaboration agreements continue to consolidate platform technology capability within the industry. Bristol Myers Squibb's acquisition of Orbital Therapeutics, global strategic partnership with BioNTech, and license agreement with Philochem for radiopharmaceutical technology illustrate how established pharmaceutical companies broaden modality breadth through external innovation.

Key Market Players

NMSC's assessment indicates that the following 20 companies are actively shaping pipeline innovation, regulatory approval strategy, and geographic expansion within the global cancer drug market.

Merck & Co., Inc. Bristol-Myers Squibb Company Johnson & Johnson AstraZeneca PLC F. Hoffmann-La Roche Ltd Novartis AG Pfizer Inc. Amgen Inc. Astellas Pharma Inc. Daiichi Sankyo Company, Limited AbbVie Inc. Eli Lilly and Company BeOne Medicines Ltd. Incyte Corporation Ipsen S.A. Exelixis, Inc. Servier S.A.S. Bayer AG GSK plc Eisai Co., Ltd.

Latest Developments

We found that recent regulatory and corporate activity within the market is concentrated on expanded indication approvals and platform technology acquisition, reflecting the industry's broader shift toward precision oncology mechanisms.

Date Event
Oct 2026 AstraZeneca and Daiichi Sankyo agreed with Summit Therapeutics to evaluate Datroway (datopotamab deruxtecan) with ivonescimab across multiple tumors, beginning with a Phase III first-line triple-negative breast cancer study. The collaboration expands combination development for a TROP2-directed ADC and broadens opportunities across lung and breast cancer treatment.
August 2026 BeOne Medicines and Revolution Medicines entered a clinical and regional commercialization collaboration covering four RAS(ON) inhibitors for RAS-addicted cancers. BeOne will evaluate combinations with selected oncology assets and received exclusive development and commercialization rights in select Asian markets, extending targeted-therapy access and strengthening its solid-tumor portfolio.
June 2026 Roche entered an exclusive global licensing and collaboration agreement with Nurix Therapeutics for bexobrutideg, an investigational BTK degrader. The companies will co-develop and co-commercialize the therapy across malignant hematology, while Roche also gains potential applications in immunology and neurology, expanding targeted protein degradation within its oncology pipeline.

Investment Opportunities

What Capital Inflows Are Targeting the Cancer Drug Market?

Capital inflows into the market are increasingly directed toward antibody-drug conjugate and cell therapy platform acquisition. Bristol Myers Squibb's acquisition of Orbital Therapeutics and strategic partnership with BioNTech illustrate sustained capital commitment to external innovation sourcing. We observed that investors favor developers demonstrating validated breakthrough therapy designations and priority review status, viewing regulatory momentum as a proxy for long-term commercial success.

How Is Infrastructure Investment Supporting Cancer Drug Market Expansion?

Infrastructure investment is expanding cell and gene therapy manufacturing capacity across North America, Europe, and Asia-Pacific to serve rising demand for complex biologic therapies. Our findings suggest that manufacturers are investing in specialized manufacturing facilities to improve consistency and scale for CAR-T cell therapy and antibody-drug conjugate production, supporting the capacity required for expanding approved indications.

What ESG Considerations Are Shaping Cancer Drug Investment Decisions?

Environmental, social, and governance considerations are increasingly central to investment decisions, with treatment access and health equity as emerging governance criteria. Corporate health equity advisory councils and expanded low- and middle-income country market initiatives exemplify growing industry attention to equitable treatment access. We found that investors increasingly favor developers with validated access programs, treating equity commitments as a governance indicator alongside clinical innovation.

Key Benefits for Stakeholders

How Does This Report Benefit Enterprise and Industry Leaders?

Enterprise and industry leaders gain access to validated segmentation, competitive benchmarking, and regional demand forecasts that support pipeline and portfolio decisions across the cancer drug industry. Our analysis shows that detailed modality, cancer indication, and drug type breakdowns help research and development teams align investment with high-growth precision oncology categories while identifying underserved indication segments for portfolio expansion.

How Does This Report Benefit Investors and Financial Analysts?

Investors and financial analysts benefit from consistent, single-point market size and CAGR estimates that support valuation and capital-allocation decisions across the cancer drug supply chain. We observed that the report's regional and segment-level growth differentials help identify which developers are best positioned to capture above-market growth in cellular and gene therapy and biosimilar categories through 2035.

How Does This Report Benefit Technology Vendors and Product Teams?

Technology vendors and product teams gain insight into emerging design requirements, including antibody-drug conjugate payload-linker technology, cell therapy manufacturing scale-up, and perioperative indication expansion, that are reshaping the industry. Our findings suggest that this analysis helps research and development teams prioritize roadmaps around differentiated mechanisms increasingly favored by expedited regulatory review pathways.

Key Market Segments Evaluated

By Modality

  • Cytotoxic Chemotherapy 
    • Alkylating Agents
      • Nitrogen Mustards
      • Nitrosoureas
      • Other Agents
    • Platinum Compounds
    • Antimetabolites
      • Antifolates
      • Pyrimidine Analogues
      • Purine Analogues
      • Other Antimetabolites
    • Topoisomerase Inhibitors
      • Topoisomerase I Inhibitors
      • Topoisomerase II Inhibitors
    • Microtubule Agents
      • Taxanes
      • Vinca Alkaloids
    • Antitumor Antibiotics
    • Other Cytotoxic Chemotherapy
  • Endocrine Therapy 
    • Estrogen Pathway
      • Selective Estrogen Receptor Modulators
      • Estrogen Receptor Degraders
      • Aromatase Inhibitors
      • Other Estrogen Pathway Agents
    • Androgen Pathway
      • Androgen Receptor Inhibitors
      • Androgen Synthesis Inhibitors
      • Other Androgen Pathway Agents
    • Other Endocrine Therapy
  • Targeted Small Molecules 
    • Kinase Inhibitors
      • Tyrosine Kinase Inhibitors
      • Cyclin-Dependent Kinase Inhibitors
      • PI3K Pathway Inhibitors
      • AKT Pathway Inhibitors
      • Other Kinase Inhibitors
    • DNA Damage Response Inhibitors
      • PARP Inhibitors
      • ATR Inhibitors
      • Other DNA Damage Response Inhibitors
    • Proteasome Inhibitors
    • Epigenetic Inhibitors
    • Other Targeted Small Molecules
  • Antibody-Drug Conjugates 
    • HER2-Directed ADCs
    • TROP2-Directed ADCs
    • Other ADCs
  • Targeted Biologics 
    • Monoclonal Antibodies
    • Non-Immune Bispecific Antibodies
    • Other Targeted Biologics
  • Immunotherapy 
    • Immune Checkpoint Inhibitors
      • PD-1 Inhibitors
      • PD-L1 Inhibitors
      • CTLA-4 Inhibitors
      • Other Checkpoint Inhibitors
    • T-Cell Engagers
    • Immune Modulators
    • Therapeutic Cancer Vaccines
    • Oncolytic Immunotherapy
  • Radiopharmaceuticals 
    • Radioligand Therapy
    • Radioimmunotherapy
    • Other Radiopharmaceuticals
  • Cellular and Gene Therapy 
    • CAR-T Cell Therapy
      • Autologous CAR-T
      • Allogeneic CAR-T
    • Other Engineered Cell Therapy
      • T-Cell Receptor Therapies
      • Natural Killer Cell Therapies
      • Other Engineered Immune-Cell Therapies
    • Gene Therapy
      • In-Vivo Gene Therapy
      • Ex-Vivo Gene Therapy
    • Other Therapy

By Drug Type

  • Innovative Branded
  • Generic
  • Biosimilar
  • Other Follow-On Product

By Molecule Type

  • Small Molecule
  • Monoclonal Antibody
  • Bispecific Antibody
  • Antibody-Drug Conjugate
  • Recombinant Protein
  • Peptide
  • Oligonucleotide
  • Radiopharmaceutical
  • Cell Therapy
  • Gene Therapy
  • Other Molecule Types

By Route of Administration

  • Oral
  • Intravenous
  • Subcutaneous
  • Intramuscular
  • Intrathecal
  • Intravesical
  • Other Parenteral
  • Other Non-Parenteral

By Cancer Indication

  • Solid Tumors 
    • Breast Cancer
    • Lung Cancer
    • Colorectal Cancer
    • Prostate Cancer
    • Gastric and Gastroesophageal Cancer
    • Liver Cancer
    • Pancreatic Cancer
    • Ovarian Cancer
    • Renal Cancer
    • Bladder and Urothelial Cancer
    • Head and Neck Cancer
    • Melanoma and Other Skin Cancers
    • Brain and Central Nervous System Tumors
    • Sarcoma
    • Neuroendocrine Tumors
    • Other Solid Tumors
  • Hematologic Malignancies 
    • Multiple Myeloma
    • Non-Hodgkin Lymphoma
    • Hodgkin Lymphoma
    • Leukemia
    • Myelodysplastic Syndromes
    • Myeloproliferative Neoplasms
    • Other Hematologic Malignancies

By Sales Channel

  • Direct Institutional Supply
  • Wholesaler and Distributor
  • Specialty Pharmacy
  • Retail Pharmacy
  • Other Licensed Channels

By Region

  • North America 
    • U.S.
    • Canada
    • Mexico
  • Europe 
    • UK
    • Germany
    • France
    • Italy
    • Spain
    • Sweden
    • Denmark
    • Finland
    • Netherlands
    • Rest of Europe
  • Asia-Pacific 
    • China
    • India
    • Japan
    • South Korea
    • Taiwan
    • Indonesia
    • Vietnam
    • Australia
    • Philippines
    • Malaysia
    • Rest of APAC
  • Middle East & Africa 
    • Saudi Arabia
    • UAE
    • Egypt
    • Israel
    • Turkey
    • Nigeria
    • South Africa
    • Rest of MEA
  • Latin America 
    • Brazil
    • Argentina
    • Chile
    • Colombia
    • Rest of LATAM

Conclusion & Recommendations

The long-term outlook for the market remains positive, with global revenue projected to expand from USD 272.76 billion in 2025 to USD 854.61 billion by 2035 at an 11.12% CAGR. We observed that sustained regulatory acceleration, antibody-drug conjugate innovation, and cell and gene therapy expansion will continue underpinning demand across solid tumor and hematologic malignancy indications through the forecast period.

What Strategic Positioning Should Cancer Drug Developers Pursue?

Developers should prioritize antibody-drug conjugate and cell therapy platform capability alongside perioperative indication expansion to secure long-term competitive positioning. Our assessment indicates that companies investing early in differentiated mechanisms with breakthrough therapy designation potential will be best positioned to capture premium pricing within the market.

How Attractive Is the Cancer Drug Market for New Investment?

The cancer drug industry presents an attractive investment case, supported by a USD 523.66 billion absolute dollar opportunity between 2026 and 2035 and above-average growth in Asia-Pacific and cellular and gene therapy categories. We found that investment attractiveness is highest for developers combining validated regulatory momentum with scaled manufacturing capacity, positioning them to serve both solid tumor and hematologic malignancy treatment segments simultaneously.

What Market Shifts and Key Risks Should Stakeholders Monitor?

Stakeholders should monitor high cell and gene therapy manufacturing costs, patent expiry-driven biosimilar competition, and uneven reimbursement frameworks across covered geographies as key risks to the market. Our analysis shows that developers unable to demonstrate differentiated clinical value risk losing market share to competitors with stronger breakthrough designation pipelines, particularly as biosimilar competition intensifies across mature therapeutic franchises.

What Are the Key Growth Pathways for the Cancer Drug Market?

Key growth pathways include expanding antibody-drug conjugate indication breadth, scaling cell and gene therapy manufacturing capacity, and deepening perioperative immunotherapy adoption across earlier-stage disease settings. NMSC's analysis indicates that developers pursuing these pathways while maintaining cost competitiveness in established cytotoxic chemotherapy categories will be best positioned to capture the market's projected growth through 2035.

Delivered Customizations

We have successfully delivered the following deep-dive customizations:

Client Request Customization Delivered Value Adds
Historical Modality Revenue Analysis
  • Historical revenue analysis of cancer drugs by modality (small molecules, biologics, antibody-drug conjugates, cell and gene therapies) across major regions.
  • Shows which modalities have driven growth and where momentum is shifting, guiding portfolio and investment priorities.
Company-Level Modality Share Assessment
  • Company-level revenue share by modality and by key oncology product, benchmarking leading players.
  • Identifies positioning gaps against market leaders to support partnership and M&A target selection.
Modality Market Sizing and Opportunity Assessment
  • TAM, SAM and VAM sizing by modality, tumor type and region for 2026-2035.
  • Quantifies serviceable and obtainable opportunity per modality to prioritize market entry and capital allocation.
Modality Pipeline and Approval Landscape
  • Mapping of late-stage oncology pipeline and recent approvals by modality, tumor indication and sponsor, using ClinicalTrials.gov and regulatory databases.
  • Highlights the upcoming launch wave by modality and indication, enabling timing of entry and competitive response.
Loss of Exclusivity and Biosimilar Entry Exposure
  • Modality-wise revenue at risk from patent expiry and biosimilar or generic entry, using FDA Orange Book, Purple Book and company filings.
  • Quantifies erosion timing by modality to guide lifecycle management and biosimilar or generic strategy.
Modality Pricing and Reimbursement Benchmarking
  • Cross-country price and reimbursement benchmarking of cancer drugs by modality using CMS, NICE and other public HTA listings.
  • Supports launch pricing, market access planning and price-corridor decisions for high-cost biologics and cell and gene therapies.

FAQs

About the Author

Liza Phukan

Liza Phukan

Liza Phukan is Research Associate at Next Move Strategy Consulting, where she has covered emerging industries and market research across sectors for 3.5 years. Her work includes analyzing industry developments, validating market data, and developing structured business content from research findings. She uses secondary research and data-validation practices to turn complex market information into clear decision-useful market analysis for business audiences and support report development and B2B.

About the Reviewer

Supradip Baul

Supradip Baul

Supradip Baul is an accomplished business consultant and strategist with over a decade of rich experience in market intelligence, strategy, technology, and business transformation. His work has included rigorous qualitative and quantitative analysis across multiple industries, helping clients shape investment decisions and long-term roadmaps. Earlier in his career, he was associated with Gartner, where he contributed to industry-leading reports and market share analyses. He has worked with leading global companies and holds an MBA with a dual specialization in Marketing and Finance.

Mohit Agarwal

MOHIT AGARWAL

Chief Manager

DryChem India Pvt. Ltd.

Next Move Strategy Consulting is an amazing team of consultants. We required a market study report for our investors on top priority and the team went above and beyond our expectations to deliver the same with ample supporting data within a short time span enabling us to secure the investments and keep our project timeline maintained. Their professionalism, attention to detail, and timely delivery of actionable recommendations have left a lasting impression on our organization.

Gaurav Jaiswal

GAURAV JAISWAL

Founder & CEO

Yano Charge Private Limited

The EV Charging market research report provided by the NextMSC was exceptionally detailed and insightful. It offered a comprehensive analysis that proved to be a game-changer for our strategic planning. Truly a testament to the NextMSC’s expertise and thoroughness in EV market landscape & analysis.

Amos Chang

AMOS CHANG

Strategy Consultant

Kardex Group

I have bought the intralogistics market reports from NMSC two times so far. Joseph and his team are always very helpful and flexible in responding to any customization requirements on the report. Their expertise in market reports really helps us steer the day-to-day business. I will definitely recommend and come back myself whenever there is a need.

Robert Sean Trevino

ROBERT SEAN TREVINO

Sr. Director, Head of Strategic Insights & Analytics

Foundation Medicine

I realized that it was a reliable source of information. These days, there are many people who are looking for authentic data, and this is one of the only sources that can offer them with what they need;

Gustaf Hummel Burstrom

GUSTAF HUMMEL BURSTROM

Founder

Revline Tools AB

Joseph and the team at Next Move Strategy Consulting have been excellent to work with, in supplying us with relevant market data and forecasts for our specific category. We had some special requirements and they were able to do a custom package to suit our needs. We would definitely recommend them to any other company needing market data and forecasts

Custom Market Research Services

We will customize the research for you if the listed report does not fully match your requirements.

Get 30% Free Customization

Select License

This website uses cookies to ensure you get the best experience on our website. Learn more

✖