Gene Therapy Drug Market Size, Share, Trends and Growth Analysis, By Therapy Modality (Gene Addition, Gene Editing, and Oncolytic Viral Therapy), By Vector Type (Viral and Non-Viral), By Therapeutic Area (Oncology, Rare Genetic Disorders, Cardiovascular Disorders, Neurological Disorders, Metabolic Disorders, Infectious Diseases, and Other Therapeutic Areas), By Delivery Approach, By Route of Administration, By Distribution Channel, By End User— Global Industry Report and Forecast, 2026–2035
Industry: Healthcare | Publishing Date: July 10, 2026 | Last Updated: September 30, 2026 | No of Pages: N/A | No. of Tables: N/A | No. of Figures: N/A | Format: PDF | Report Code: HC5086
What Is the Gene Therapy Drug Market Size?
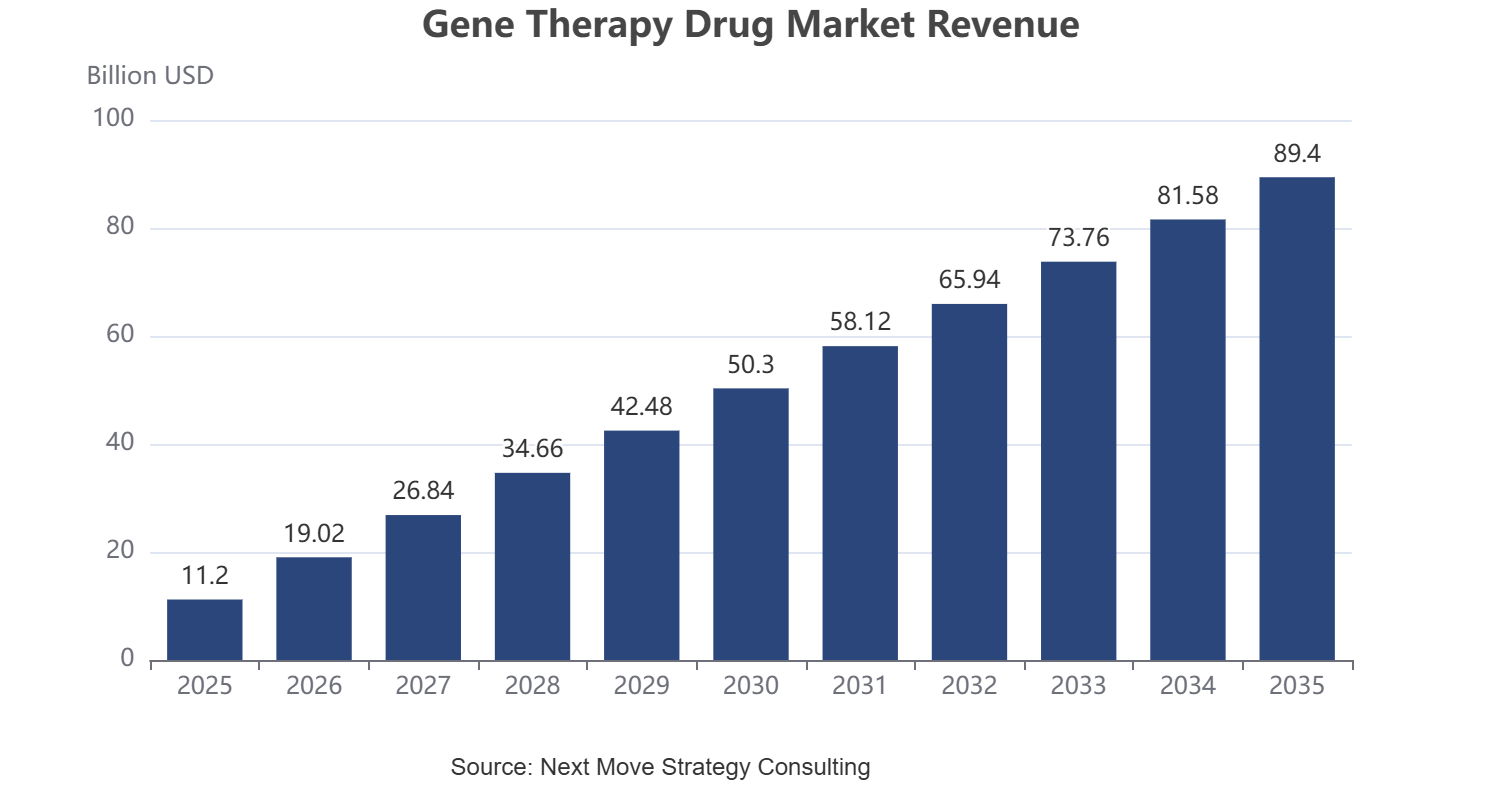
The global Gene Therapy Drug Market size was valued at USD 11.2 Billion in 2025 and is estimated at USD 14.6 Billion in 2026, forecast to reach USD 89.4 Billion by 2035, expanding at a 22.3% CAGR between 2026 and 2035. North America leads with approximately 46% share, while under therapy modality, Gene Addition dominates with approximately 62% share.
We observed that growth is broad-based across every segmentation axis, with expanding regulatory approvals for in vivo gene editing and ex vivo cell therapies driving the dominant structural shifts through 2035.
|
Key Takeaways |
|
By Therapy Modality: Gene Addition held the largest share of approximately 62% (USD 6.94 Billion) in 2025; Gene Editing is the fastest-growing sub-segment at 29.0% CAGR from 2026-2035. |
|
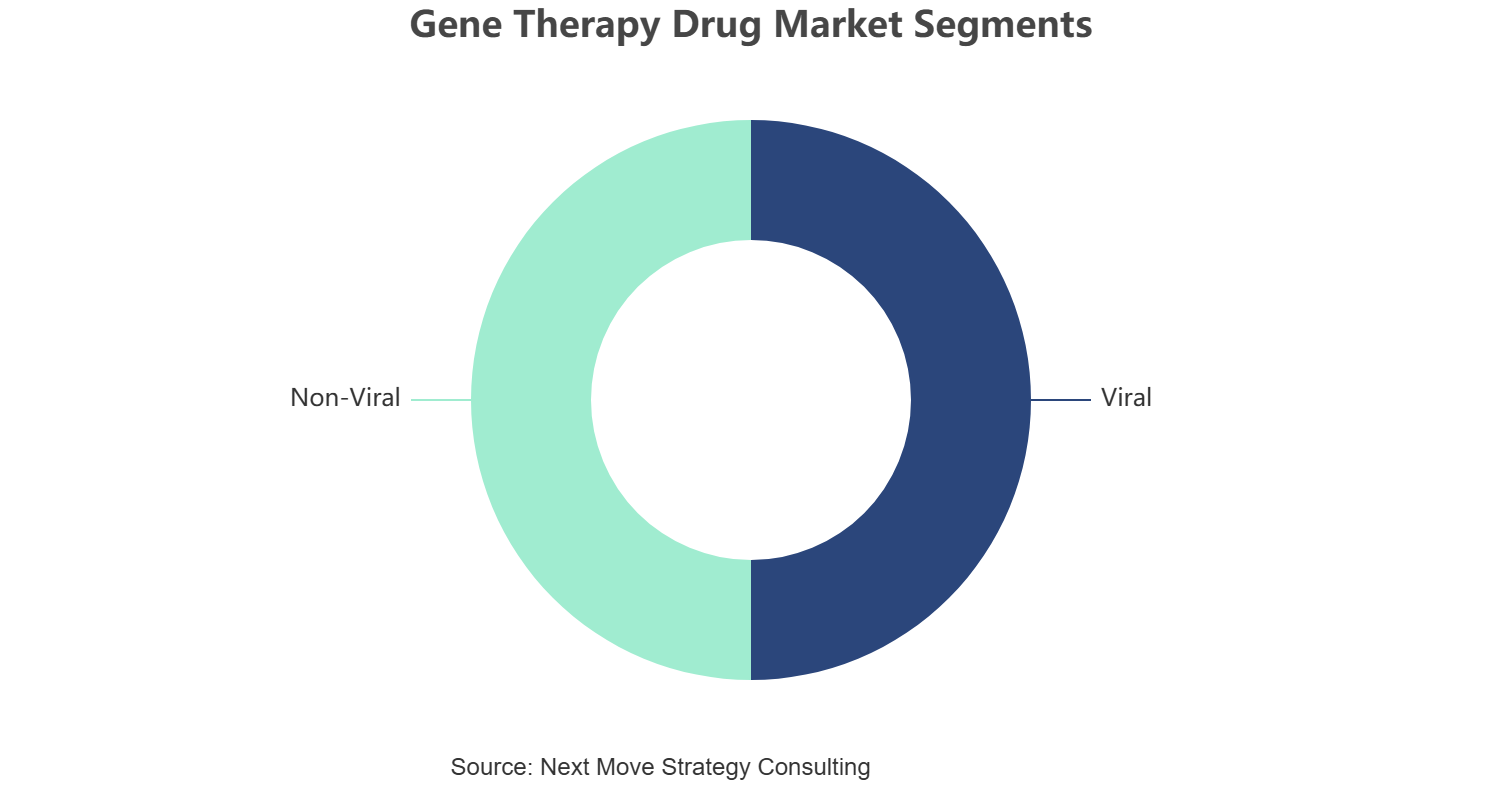
By Vector Type: Viral held the largest share of approximately 74% (USD 8.29 Billion) in 2025; Non-Viral is the fastest-growing sub-segment at 27.0% CAGR from 2026-2035. |
|
By Therapeutic Area: Oncology held the largest share of approximately 38% (USD 4.26 Billion) in 2025; Rare Genetic Disorders is the fastest-growing sub-segment at 28.0% CAGR from 2026-2035. |
|
By Delivery Approach: In Vivo held the largest share of approximately 58% (USD 6.50 Billion) in 2025; Ex Vivo is the fastest-growing sub-segment at 24.0% CAGR from 2026-2035. |
|
By Route of Administration: Intravenous held the largest share of approximately 40% (USD 4.48 Billion) in 2025; Intrathecal is the fastest-growing sub-segment at 25.6% CAGR from 2026-2035. |
|
By Distribution Channel: Specialty Pharmacy held the largest share of approximately 44% (USD 4.93 Billion) in 2025; Hospital Pharmacy is the fastest-growing sub-segment at 23.4% CAGR from 2026-2035. |
|
By End User: Hospitals held the largest share of approximately 48% (USD 5.38 Billion) in 2025; Ambulatory Infusion Centers is the fastest-growing sub-segment at 26.1% CAGR from 2026-2035. |
|
Dominant Region: North America dominated with approximately 46% revenue share (USD 5.15 Billion) in 2025. |
|
Fastest-Growing Region: Asia-Pacific is expected to register the highest CAGR of 30.0% during 2026-2035. |
|
Dominant Country: U.S. led with approximately USD 3.61 Billion in 2025. |
|
Fastest-Growing Country: China is the fastest-growing country at approximately 32.1% CAGR from 2026-2035. |
Between 2026 and 2035, the Gene Therapy Drug Market is set to generate an absolute dollar opportunity of USD 74.8 Billion, positioning in vivo gene editing and ex vivo cell therapy platforms as a compelling area for capital allocation.
According to NMSC analysis, sustained regulatory approvals for rare genetic disorder indications are reshaping reimbursement frameworks, as payers increasingly negotiate outcomes-based agreements tied to long-term efficacy data across specialty pharmacy channels.
What does the Gene Therapy Drug Market Encompass?
The Gene Therapy Drug Market covers approved and pipeline therapies that add, edit, or deliver oncolytic genetic material to treat oncology, rare genetic, and other disease indications through viral and non-viral vectors. We found that the market has evolved from a small number of ultra-rare disease approvals toward broader oncology and neuromuscular indications as manufacturing scale-up and vector production capacity have matured industry-wide.
Regulatory agencies including the U.S. Food and Drug Administration and the European Medicines Agency have expanded accelerated approval pathways for gene therapies, shaping how sponsors design pivotal trials. Our analysis shows that adoption is increasingly concentrated in specialized treatment centers with vector-handling infrastructure, reinforcing durable demand for hospital and academic medical center administration across therapeutic areas.
|
Parameter |
Details |
|
Market Size in 2025 |
USD 11.2 Billion |
|
Market Size in 2026 |
USD 14.6 Billion |
|
Revenue Forecast in 2035 |
USD 89.4 Billion |
|
Growth Rate |
CAGR of 22.3% from 2026 to 2035 |
|
Analysis Period |
2025–2035 |
|
Base Year Considered |
2025 |
|
Forecast Period |
2026–2035 |
|
Market Size Estimation |
Revenue (USD Billion) |
|
Companies Profiled |
20 |
|
Countries Covered |
33 |
|
Market Share |
Available for Top 10 Companies |
Key Emerging Trends
We observed that four structural trends are reshaping how sponsors develop and commercialize gene therapy drugs.
How Is In Vivo Gene Editing Transforming Treatment Paradigms?
In vivo gene editing is shifting treatment away from ex vivo cell manipulation toward direct administration of editing constructs. During our market evaluation, we noticed that this shift is reducing manufacturing complexity for hemoglobinopathy indications. Intellia Therapeutics' CRISPR-based in vivo programs are a widely cited example of vendors advancing this modality toward regulatory approval.
Why Is Non-Viral Vector Adoption Gaining Momentum?
Lipid nanoparticle delivery systems are gaining adoption as sponsors seek to reduce immunogenicity risk associated with viral vectors. We found that stakeholders including specialty pharmacies are prioritizing non-viral formulations for repeat-dosing indications. Intellia and Regeneron's collaborative lipid nanoparticle programs illustrate how non-viral delivery is expanding beyond its historical niche.
How Is Expanded Newborn Screening Reshaping Early Diagnosis and Demand?
Broader newborn screening for rare genetic disorders is identifying patients earlier, expanding the eligible population for gene addition therapies. Our findings suggest that this trend is most pronounced in inherited retinal and neuromuscular disorder categories. Novartis' Zolgensma newborn-screening-linked identification pathways exemplify how earlier diagnosis is directly expanding addressable patient populations.
What Role Does Manufacturing Scale-Up Play in Market Expansion?
Vector manufacturing capacity has historically constrained gene therapy commercialization, pushing sponsors toward in-house production investment. NMSC's analysis indicates that manufacturing scale-up is now a distinct strategic priority for companies pursuing multiple therapeutic area approvals. uniQure's dedicated AAV manufacturing facilities demonstrate how production-capacity investment is becoming inseparable from commercial launch planning.
Growth Drivers and Restraints
Growth Catalyst and Risk Assessment Matrix
|
Factors |
(+/-) % Impact on CAGR |
Geographic Relevance |
Impact Timeline |
|
Expanding regulatory approvals for rare genetic disorders |
+4.5% |
North America, Europe |
2026–2035 |
|
Growing oncology pipeline for gene-based therapeutics |
+3.4% |
Global |
2026–2035 |
|
Increasing newborn screening identifying eligible patients earlier |
+2.6% |
North America, Europe |
2026–2033 |
|
Rising vector manufacturing capacity investment |
+2.1% |
Global |
2026–2032 |
|
Government funding for rare disease research programs |
+1.7% |
North America, Asia-Pacific |
2026–2033 |
|
High per-patient treatment cost limiting access |
-2.4% |
Global |
2026–2035 |
|
Complex reimbursement and outcomes-based agreement negotiation |
-1.6% |
Europe, North America |
2026–2032 |
|
Manufacturing and supply chain capacity constraints |
-1.3% |
Global |
2026–2030 |
|
Long-term safety monitoring requirements from regulators |
-1.0% |
Global |
2026–2035 |
What Is the Primary Growth Driver of the Gene Therapy Drug Market?
The primary driver is the expanding number of regulatory approvals for rare genetic disorder indications. According to the U.S. Food and Drug Administration, the agency has approved a growing number of cell and gene therapy products in recent years under its accelerated pathways. We observed that this approval momentum is the single largest factor expanding addressable patient populations across specialty treatment centers.
How Is Expanding Oncology Pipeline Activity Driving Market Growth?
A deepening oncology pipeline for gene-based and oncolytic viral therapies is broadening commercial opportunity beyond rare genetic disorders. Our assessment indicates that hematological malignancy indications are attracting the largest share of new clinical programs, reinforcing durable demand in oncology-focused academic medical centers through 2035 (industry-derived estimate).
What Is Restraining Gene Therapy Drug Market Expansion?
High per-patient treatment costs, often exceeding a million dollars for approved therapies, are constraining payer access and slowing broader adoption. We noticed that this constraint is most acute in markets lacking outcomes-based reimbursement frameworks. This restraint is presented as an industry-derived estimate given the absence of a single publicly verifiable payer-access dataset matching this exact market definition.
Segmentation Analysis
Segment Sizing: By Therapy Modality
|
Segment |
2025 (USD) |
2035 (USD) |
CAGR% (2026-2035) |
|
Gene Addition |
6.94 Billion |
44.70 Billion |
18.0% |
|
Gene Editing |
3.14 Billion |
35.76 Billion |
29.0% |
|
Oncolytic Viral Therapy |
1.12 Billion |
8.94 Billion |
22.0% |
|
Total |
11.20 Billion |
89.40 Billion |
22.3% |
Which Therapy Modality Dominates the Gene Therapy Drug Market?
Gene Addition dominates therapy modality, accounting for approximately 62% of 2025 revenue on the strength of approved hemoglobinopathy and neuromuscular disorder treatments. We observed that Gene Editing is growing fastest at 29.0% CAGR as CRISPR-based programs advance through late-stage trials, reflecting sponsor investment in precision correction approaches over addition-based delivery.
Segment Sizing: By Vector Type
|
Segment |
2025 (USD) |
2035 (USD) |
CAGR% (2026-2035) |
|
Viral |
8.29 Billion |
55.43 Billion |
20.0% |
|
Non-Viral |
2.91 Billion |
33.97 Billion |
27.0% |
|
Total |
11.20 Billion |
89.40 Billion |
22.3% |
Which Vector Type Leads Gene Therapy Drug Market Demand?
Viral vectors lead with approximately 74% share in 2025, reflecting the established regulatory and manufacturing track record of adeno-associated virus and lentivirus platforms. Our findings suggest that Non-Viral vectors are the fastest-growing type at 27.0% CAGR as lipid nanoparticle delivery reduces immunogenicity concerns for repeat-dosing candidates entering late-stage development.
Segment Sizing: By Therapeutic Area
|
Segment |
2025 (USD) |
2035 (USD) |
CAGR% (2026-2035) |
|
Oncology |
4.26 Billion |
26.82 Billion |
19.0% |
|
Rare Genetic Disorders |
3.81 Billion |
35.76 Billion |
28.0% |
|
Cardiovascular Disorders |
0.67 Billion |
5.36 Billion |
22.0% |
|
Neurological Disorders |
0.90 Billion |
8.05 Billion |
23.0% |
|
Metabolic Disorders |
0.56 Billion |
4.47 Billion |
22.0% |
|
Infectious Diseases |
0.55 Billion |
4.47 Billion |
22.0% |
|
Other Therapeutic Areas |
0.45 Billion |
4.47 Billion |
24.0% |
|
Total |
11.20 Billion |
89.40 Billion |
22.3% |
Which Therapeutic Area Dominates the Gene Therapy Drug Market?
Oncology holds the largest 2025 share at approximately 38%, reflecting the breadth of hematological malignancy and solid tumor programs reaching commercial stage. We observed that Rare Genetic Disorders is the fastest-growing area at 28.0% CAGR as expanded newborn screening identifies eligible patients earlier, positioning this category to overtake oncology in absolute size by the later forecast years.
Growth Opportunities
Three whitespace opportunities stand out for sponsors and investors positioning ahead of 2035.
How Can Sponsors Capture Ex Vivo Cell Therapy Expansion?
Ex vivo immune cell and hematopoietic stem cell programs are expanding beyond oncology into autoimmune indications. Sponsors that build modular ex vivo manufacturing platforms stand to capture disproportionate share as this delivery approach scales into new therapeutic areas.
What Opportunity Exists in Outcomes-Based Reimbursement Design?
Payers remain hesitant to cover high-cost gene therapies without long-term efficacy assurance. Sponsors that structure outcomes-based, milestone-linked payment agreements represent a distinct whitespace for improving specialty pharmacy access in cost-sensitive markets.
How Can Vector Manufacturers Benefit from Capacity-as-a-Service Models?
Smaller biotech sponsors lack in-house vector manufacturing capacity for late-stage and commercial supply. Contract manufacturers offering flexible, capacity-as-a-service AAV and lentivirus production represent a concrete opportunity to capture recurring revenue from this underserved sponsor segment.
Consumer Behavior Analysis of the Gene Therapy Drug Market
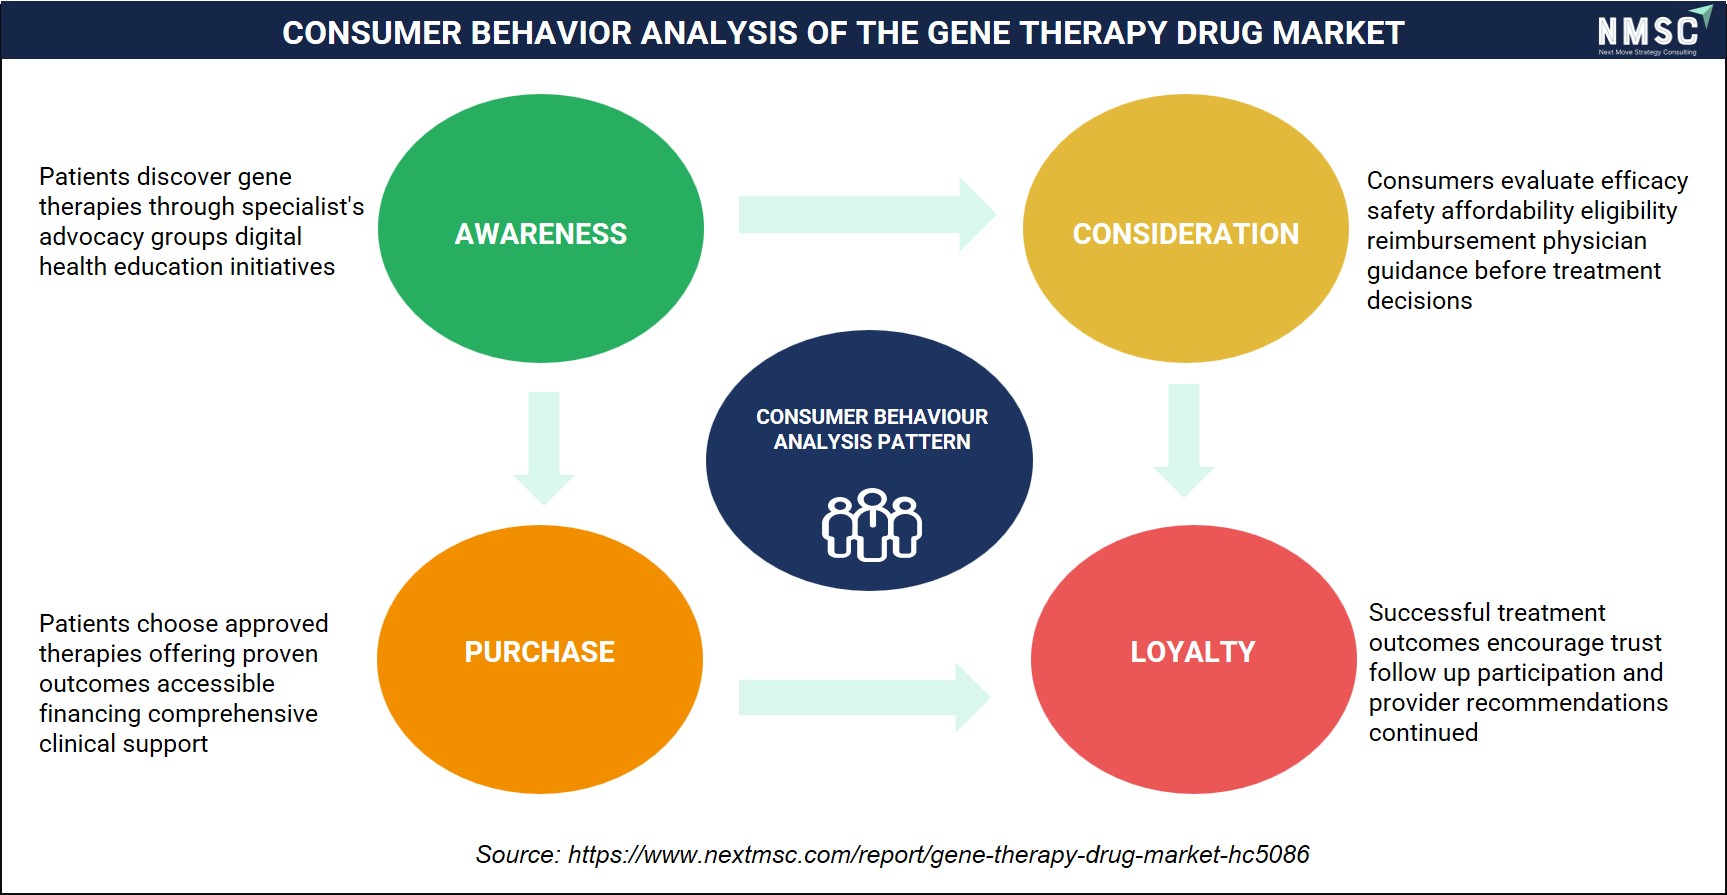
Consumer behavior in the gene therapy drug market is driven by disease awareness, clinical efficacy, treatment safety, and reimbursement availability. Patients and healthcare providers carefully evaluate therapeutic benefits, eligibility, and long-term outcomes before treatment. Positive clinical results, ongoing patient support, and trust in healthcare professionals contribute to treatment adoption, follow-up adherence, and sustained confidence in gene therapy solutions.
Regional Outlook
Geographic Performance Snapshot
|
Region |
2025 (USD) |
2035 (USD) |
CAGR% (2026-2035) |
Key Driver |
|
North America |
5.15 Billion |
33.97 Billion |
21.0% |
Regulatory approval momentum and reimbursement innovation |
|
Europe |
2.69 Billion |
19.67 Billion |
24.0% |
Centralized EMA approval pathways |
|
Asia-Pacific |
2.24 Billion |
26.82 Billion |
30.0% |
Expanding clinical trial and manufacturing investment |
|
Middle East & Africa |
0.56 Billion |
4.47 Billion |
26.0% |
Growing specialty treatment center infrastructure |
|
Latin America |
0.56 Billion |
4.47 Billion |
26.0% |
Rising rare disease diagnosis rates |
|
Total |
11.20 Billion |
89.40 Billion |
22.3% |
- |
North America Gene Therapy Drug Market Outlook
North America's market is the most mature globally, anchored by the largest number of approved gene therapies and established reimbursement frameworks. We observed that continued FDA approval momentum and expanding outcomes-based payer agreements are reinforcing demand, with sponsors emphasizing specialty pharmacy distribution as the primary commercialization lever through 2035.
Europe Gene Therapy Drug Market Outlook
Europe's market growth is closely tied to centralized European Medicines Agency approval pathways, which streamline market entry across member states. Technology adoption is concentrated in academic medical centers with vector-handling capability, and we found that reimbursement negotiation at the national level remains a key determinant of commercial rollout pace.
Asia-Pacific Gene Therapy Drug Market Outlook
Asia-Pacific is the fastest-growing region, driven by expanding clinical trial activity and government-backed biomanufacturing investment across China, Japan, and South Korea. Our analysis shows that regulatory modernization in several countries is accelerating local approval timelines for both domestic and international gene therapy sponsors.
Middle East & Africa Gene Therapy Drug Market Outlook
Middle East & Africa is an emerging market shaped by growing investment in specialty treatment center infrastructure in the Gulf states. We observed that government organizations are the leading sponsors of early access programs, with technology penetration still concentrated in a small number of flagship academic centers.
Latin America Gene Therapy Drug Market Outlook
Latin America is at an early growth stage, with rising rare disease diagnosis rates expanding the identified patient population. Our findings suggest that Brazil is leading regional adoption, while reimbursement frameworks for high-cost therapies remain a developing consideration for sponsors entering the region.
U.S. Gene Therapy Drug Market
Based on our engagements, the U.S. Gene Therapy Drug Market was valued at approximately USD 3.61 Billion in 2025 and is projected to reach approximately USD 22.08 Billion by 2035, expanding at a CAGR of 19.8% from 2026 to 2035. Demand structure reflects the largest concentration of FDA-approved gene therapies and mature specialty pharmacy distribution, with high competitive intensity among established sponsors, positioning the country's strategic outlook as constructive through the forecast period.
Canada Gene Therapy Drug Market
Through our analysis, the Canada Gene Therapy Drug Market was valued at approximately USD 1.03 Billion in 2025 and is projected to reach approximately USD 6.87 Billion by 2035, expanding at a CAGR of 20.9% from 2026 to 2035. Demand structure reflects steady health-technology-assessment-driven access expansion and moderate technology penetration across academic medical centers, positioning the country's strategic outlook as constructive through the forecast period.
UK Gene Therapy Drug Market
From our assessment, the UK Gene Therapy Drug Market was valued at approximately USD 0.75 Billion in 2025 and is projected to reach approximately USD 5.31 Billion by 2035, expanding at a CAGR of 21.7% from 2026 to 2035. Demand structure reflects NHS-negotiated managed access agreements and growing regulatory alignment supporting technology adoption, positioning the country's strategic outlook as constructive through the forecast period.
Germany Gene Therapy Drug Market
According to evaluation, the Germany Gene Therapy Drug Market was valued at approximately USD 0.86 Billion in 2025 and is projected to reach approximately USD 6.30 Billion by 2035, expanding at a CAGR of 22.1% from 2026 to 2035. Demand structure reflects strong academic medical center infrastructure and structured national reimbursement negotiation processes, positioning the country's strategic outlook as constructive through the forecast period.
France Gene Therapy Drug Market
Based on our engagements, the France Gene Therapy Drug Market was valued at approximately USD 0.58 Billion in 2025 and is projected to reach approximately USD 4.13 Billion by 2035, expanding at a CAGR of 21.8% from 2026 to 2035. Demand structure reflects centralized EMA-aligned approval pathways and growing early-access program participation, positioning the country's strategic outlook as constructive through the forecast period.
China Gene Therapy Drug Market
Through our analysis, the China Gene Therapy Drug Market was valued at approximately USD 0.90 Billion in 2025 and is projected to reach approximately USD 12.19 Billion by 2035, expanding at a CAGR of 30.4% from 2026 to 2035. Demand structure reflects rapid domestic biomanufacturing investment and accelerating regulatory modernization supporting the fastest adoption curve in the region, positioning the country's strategic outlook as constructive through the forecast period.
India Gene Therapy Drug Market
From our assessment, the India Gene Therapy Drug Market was valued at approximately USD 0.36 Billion in 2025 and is projected to reach approximately USD 4.29 Billion by 2035, expanding at a CAGR of 28.2% from 2026 to 2035. Demand structure reflects expanding clinical trial infrastructure and growing government support for rare disease research programs, positioning the country's strategic outlook as constructive through the forecast period.
Japan Gene Therapy Drug Market
According to evaluation, the Japan Gene Therapy Drug Market was valued at approximately USD 0.51 Billion in 2025 and is projected to reach approximately USD 5.63 Billion by 2035, expanding at a CAGR of 27.1% from 2026 to 2035. Demand structure reflects structured regulatory pathways and steady academic medical center adoption of approved therapies, positioning the country's strategic outlook as constructive through the forecast period.
South Korea Gene Therapy Drug Market
Based on our engagements, the South Korea Gene Therapy Drug Market was valued at approximately USD 0.31 Billion in 2025 and is projected to reach approximately USD 3.35 Billion by 2035, expanding at a CAGR of 26.7% from 2026 to 2035. Demand structure reflects strong biomanufacturing capability supporting domestic sponsor development programs, positioning the country's strategic outlook as constructive through the forecast period.
Australia Gene Therapy Drug Market
Through our analysis, the Australia Gene Therapy Drug Market was valued at approximately USD 0.16 Billion in 2025 and is projected to reach approximately USD 1.61 Billion by 2035, expanding at a CAGR of 26.1% from 2026 to 2035. Demand structure reflects growing specialty treatment center presence and moderate reimbursement-framework development, positioning the country's strategic outlook as constructive through the forecast period.
UAE Gene Therapy Drug Market
From our assessment, the UAE Gene Therapy Drug Market was valued at approximately USD 0.17 Billion in 2025 and is projected to reach approximately USD 1.43 Billion by 2035, expanding at a CAGR of 23.9% from 2026 to 2035. Demand structure reflects government-backed specialty treatment center investment driving early-stage adoption, positioning the country's strategic outlook as constructive through the forecast period.
Saudi Arabia Gene Therapy Drug Market
According to evaluation, the Saudi Arabia Gene Therapy Drug Market was valued at approximately USD 0.20 Billion in 2025 and is projected to reach approximately USD 1.65 Billion by 2035, expanding at a CAGR of 23.5% from 2026 to 2035. Demand structure reflects national rare disease program investment and growing academic medical center capability, positioning the country's strategic outlook as constructive through the forecast period.
South Africa Gene Therapy Drug Market
Based on our engagements, the South Africa Gene Therapy Drug Market was valued at approximately USD 0.06 Billion in 2025 and is projected to reach approximately USD 0.49 Billion by 2035, expanding at a CAGR of 23.4% from 2026 to 2035. Demand structure reflects emerging specialty care infrastructure with technology penetration concentrated among flagship centers, positioning the country's strategic outlook as constructive through the forecast period.
Brazil Gene Therapy Drug Market
Through our analysis, the Brazil Gene Therapy Drug Market was valued at approximately USD 0.28 Billion in 2025 and is projected to reach approximately USD 2.29 Billion by 2035, expanding at a CAGR of 23.5% from 2026 to 2035. Demand structure reflects rising rare disease diagnosis rates and growing academic medical center capability across the country, positioning the country's strategic outlook as constructive through the forecast period.
Argentina Gene Therapy Drug Market
From our assessment, the Argentina Gene Therapy Drug Market was valued at approximately USD 0.09 Billion in 2025 and is projected to reach approximately USD 0.72 Billion by 2035, expanding at a CAGR of 22.9% from 2026 to 2035. Demand structure reflects early-stage adoption led by a small number of specialty treatment centers, positioning the country's strategic outlook as constructive through the forecast period.
Supply Chain Structure of the Gene Therapy Drug Market
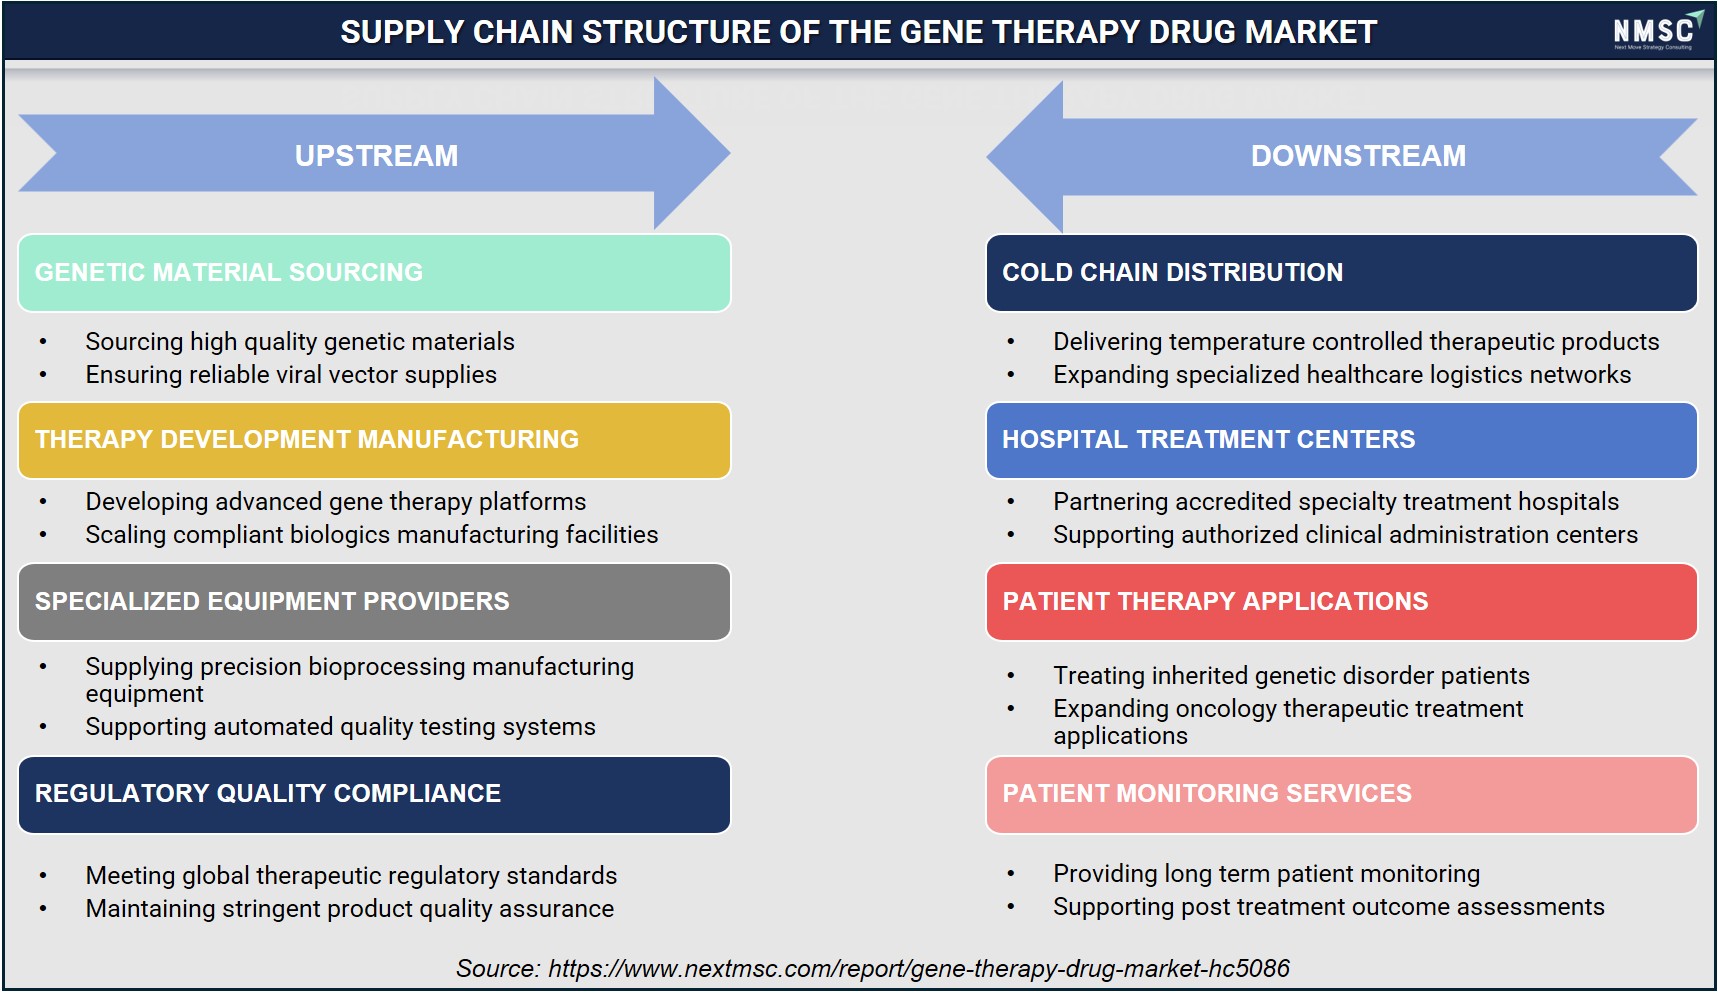
The gene therapy drug market supply chain relies on high-quality genetic material sourcing, advanced therapy manufacturing, specialized bioprocessing equipment, and stringent regulatory compliance to ensure product quality and safety. Efficient cold chain logistics, accredited treatment centers, and continuous patient monitoring support the secure delivery, administration, and long-term effectiveness of gene therapy treatments.
Competitive Landscape
We observed that the competitive landscape spans large biopharmaceutical companies alongside specialized gene therapy developers competing on differentiated modality and vector platforms.
|
Dimension |
Description |
|
Market Structure |
Moderately fragmented, with large biopharma incumbents and specialized developers |
|
Innovation Focus |
In vivo gene editing, non-viral delivery, and manufacturing scale-up |
|
M&A Activity |
Selective acquisitions of vector-platform and gene-editing startups by larger biopharma companies |
How Do Companies Compete in the Gene Therapy Drug Industry?
Companies compete primarily on clinical efficacy data depth and manufacturing scale for commercial supply. We found that sponsors with in-house vector production capacity are winning regulatory and payer confidence faster than those relying on contract manufacturing, particularly for therapies serving larger therapeutic areas such as oncology.
Which Competitive Archetypes Dominate the Gene Therapy Drug Market?
Two archetypes dominate: large biopharmaceutical companies with commercial infrastructure and payer relationships, and specialized gene therapy developers with deep platform expertise in a single modality. Our assessment indicates that large biopharma companies benefit from distribution scale, while specialized developers compete on faster platform iteration and modality-specific technical depth.
How Are Companies Differentiating Through Innovation in Gene Therapy Drugs?
Vendors are differentiating through next-generation capsid engineering that improves vector tissue targeting and through non-viral delivery platforms that reduce immunogenicity risk. We observed that companies investing in manufacturing process innovation are capturing share among sponsors seeking faster time to commercial-scale supply.
What M&A and Expansion Activity Is Shaping the Gene Therapy Drug Market?
Larger biopharmaceutical companies have continued acquiring specialized gene-editing and vector-platform developers to broaden pipeline depth. According to research conducted by NMSC, we found that this consolidation is concentrated among companies seeking to enter new therapeutic areas, while smaller developers continue expanding through academic medical center partnerships.
Key Market Players
We identified the following companies as the leading, validated participants shaping competitive dynamics in the Gene Therapy Drug Market.
-
Sarepta Therapeutics, Inc.
-
Bristol-Myers Squibb Company
-
Vertex Pharmaceuticals Incorporated
-
BioMarin Pharmaceutical Inc.
-
F. Hoffmann-La Roche Ltd
-
CSL Limited
-
Krystal Biotech, Inc.
-
bluebird bio, Inc.
-
Orchard Therapeutics plc
-
uniQure N.V.
-
REGENXBIO Inc.
-
Abeona Therapeutics Inc.
-
Rocket Pharmaceuticals, Inc.
-
Sangamo Therapeutics, Inc.
-
MeiraGTx Holdings plc
-
Voyager Therapeutics, Inc.
-
4D Molecular Therapeutics, Inc.
-
Solid Biosciences Inc.
Latest Developments
We tracked the following recent developments as indicative of current strategic direction across leading sponsors.
|
Date |
Event |
|
May 2026 |
Krystal announced UK MHRA approval of VYJUVEK for dystrophic epidermolysis bullosa (DEB), making it the first genetic medicine approved in the UK for this disease. |
Investment Opportunities
What Capital Inflows Are Targeting the Gene Therapy Drug Market?
Venture and strategic capital continues flowing into gene-editing and non-viral delivery platform companies as sponsors seek differentiated modality positions. We observed that later-stage funding rounds are increasingly concentrated among developers with clinical proof-of-concept data in rare genetic disorders.
How Is Infrastructure Investment Shaping the Market?
Vector manufacturing facility construction is a direct upstream driver of commercial supply capacity, as sponsors seek to reduce reliance on contract manufacturers. Our findings suggest that infrastructure investors are increasingly requiring demonstrated manufacturing yield data as part of underwriting for new facility projects.
What ESG Considerations Are Relevant to Gene Therapy Drug Investment?
Equitable patient access to high-cost therapies is becoming a governance consideration for investors evaluating gene therapy sponsors. We found that ESG-linked financing is beginning to reference outcomes-based reimbursement participation as a social-governance indicator, particularly among sponsors commercializing rare disease indications.
Key Benefits for Stakeholders
How Does This Report Benefit Enterprise and Industry Leaders?
Industry leaders gain a segmented view of where modality and vector investment delivers the strongest commercial return, supported by our therapy modality, vector type, and therapeutic area forecasts. This analysis helps R&D and commercial leaders prioritize pipeline investment with greater confidence.
How Does This Report Benefit Investors and Financial Analysts?
Investors and financial analysts benefit from consolidated market sizing, regional growth differentials, and competitive positioning that support valuation and diligence work. Our forecasts and strategic insights clarify which sub-segments and regions offer the strongest growth trajectories through 2035.
How Does This Report Benefit Technology Vendors and Product Teams?
Vector manufacturing vendors and product teams gain competitive landscape analysis and segmentation data that inform capacity-investment prioritization. We found that this report's growth-driver and opportunity analysis helps teams align capacity planning with the fastest-growing modalities and therapeutic areas.
Key Market Segments
By Therapy Modality
-
Gene Addition
-
In Vivo
-
Viral Vector
-
Non-Viral Vector
-
-
Ex Vivo
-
Hematopoietic Stem Cell
-
Immune Cell
-
Other Cell
-
-
Gene Editing
-
In Vivo
-
CRISPR
-
Zinc Finger Nuclease
-
TALEN
-
Meganuclease
-
Other Technologies
-
-
Ex Vivo
-
CRISPR
-
Zinc Finger Nuclease
-
TALEN
-
Meganuclease
-
Other Technologies
-
-
-
Oncolytic Viral Therapy
-
Adenovirus
-
Herpes Simplex Virus
-
Vaccinia Virus
-
Other Viruses
-
By Vector Type
-
Viral
-
Adeno-Associated Virus
-
Lentivirus
-
Retrovirus
-
Adenovirus
-
Herpes Simplex Virus
-
Vaccinia Virus
-
Other Viral Vectors
-
-
Non-Viral
-
Lipid Nanoparticles
-
Plasmid DNA
-
Polymer Vectors
-
Electroporation
-
Other Non-Viral Vectors
-
By Therapeutic Area
-
Oncology
-
Hematological Malignancies
-
Solid Tumors
-
-
Rare Genetic Disorders
-
Neuromuscular Disorders
-
Hemoglobinopathies
-
Primary Immunodeficiencies
-
Lysosomal Storage Disorders
-
Inherited Retinal Disorders
-
Other Rare Genetic Disorders
-
-
Cardiovascular Disorders
-
Neurological Disorders
-
Metabolic Disorders
-
Infectious Diseases
-
Other Therapeutic Areas
By Delivery Approach
-
In Vivo
-
Ex Vivo
By Route of Administration
-
Intravenous
-
Intramuscular
-
Intrathecal
-
Intratumoral
-
Intramyocardial
-
Subretinal
-
Intravitreal
-
Other Routes
By Distribution Channel
-
Direct Sales
-
Specialty Pharmacy
-
Hospital Pharmacy
-
Distributor
-
Government Procurement
By End User
-
Hospitals
-
Specialty Clinics
-
Academic Medical Centers
-
Ambulatory Infusion Centers
-
Other Healthcare Facilities
By Region
-
North America: U.S., Canada, Mexico.
-
Europe: UK, Germany, France, Italy, Spain, Sweden, Denmark, Finland, Netherlands, Rest of Europe.
-
Asia-Pacific: China, India, Japan, South Korea, Taiwan, Indonesia, Vietnam, Australia, Philippines, Malaysia, Rest of APAC.
-
Middle East & Africa: Saudi Arabia, UAE, Egypt, Israel, Turkey, Nigeria, South Africa, Rest of MEA.
-
Latin America: Brazil, Argentina, Chile, Colombia, Rest of LATAM.
Conclusion and Recommendations
What Is the Long-Term Outlook for the Gene Therapy Drug Market?
We expect sustained rapid growth through 2035 as regulatory approvals expand across oncology and rare genetic disorder indications. Our assessment indicates that gene editing modalities will increasingly narrow the gap with gene addition as CRISPR-based programs reach commercial stage across all regions.
What Strategic Positioning Should Sponsors Pursue?
Sponsors should prioritize in-house manufacturing capacity while building outcomes-based reimbursement evidence for payers. We found that sponsors combining manufacturing scale with structured access programs are best positioned to capture share from developers reliant on contract manufacturing alone.
How Attractive Is the Market for Investment?
Investment attractiveness is high given the 22.3% projected CAGR and the durable nature of rare disease and oncology gene therapy demand. Our findings suggest that Asia-Pacific and gene-editing sub-segments offer the strongest near-term return profile for growth-stage capital.
What Market Shifts and Key Risks Should Stakeholders Monitor?
Stakeholders should monitor payer access constraints and long-term safety monitoring requirements as the principal risks to forecast execution. We observed that any slowdown in outcomes-based reimbursement adoption would disproportionately affect sponsors concentrated in high-cost rare disease indications.
What Are the Primary Growth Pathways Through 2035?
The primary growth pathways run through ex vivo cell therapy expansion, outcomes-based reimbursement design, and capacity-as-a-service manufacturing models. According to NMSC analysis, sponsors that build repeatable strategies around these three pathways are best positioned to outperform the broader market through the forecast period.
About the Author
 Mihul Sharma
— Mihul Sharma is Research Associate at Next Move Strategy Consulting, where he has covered technology, industrial, and healthcare markets for 3 years. His work applies structured business research, market analysis, and secondary-source review to assess market trends, competitive developments, and growth opportunities. He supports report development by fully synthesizing industry data, company information, and market signals into concise findings for strategy and investment-focused research teams.
Mihul Sharma
— Mihul Sharma is Research Associate at Next Move Strategy Consulting, where he has covered technology, industrial, and healthcare markets for 3 years. His work applies structured business research, market analysis, and secondary-source review to assess market trends, competitive developments, and growth opportunities. He supports report development by fully synthesizing industry data, company information, and market signals into concise findings for strategy and investment-focused research teams.
About the Reviewer
 Supradip Baul
— Supradip Baul is an accomplished business consultant and strategist with over a decade of rich experience in market intelligence, strategy, technology, and business transformation. His work has included rigorous qualitative and quantitative analysis across multiple industries, helping clients shape investment decisions and long-term roadmaps. Earlier in his career, he was associated with Gartner, where he contributed to industry-leading reports and market share analyses. He has worked with leading global companies and holds an MBA with a dual specialization in Marketing and Finance.
Supradip Baul
— Supradip Baul is an accomplished business consultant and strategist with over a decade of rich experience in market intelligence, strategy, technology, and business transformation. His work has included rigorous qualitative and quantitative analysis across multiple industries, helping clients shape investment decisions and long-term roadmaps. Earlier in his career, he was associated with Gartner, where he contributed to industry-leading reports and market share analyses. He has worked with leading global companies and holds an MBA with a dual specialization in Marketing and Finance.
At Next Move Strategy Consulting, we understand that insightful market research is the cornerstone of successful business decisions. That's why we employ a robust and multifaceted approach, combining various methodologies to deliver the most accurate and actionable data for our clients.

Research Landscape
We navigate the world of research with two primary approaches:
Qualitative Approach
Our qualitative research methodologies involve immersive techniques such as in-depth interviews, focus groups, and observational studies. By engaging directly with individuals and stakeholders, we uncover valuable insights that quantitative data alone may overlook.

Quantitative Research
In tandem with qualitative methodologies, NMSC leverages the power of Quantitative Research to provide a robust foundation of numerical insights. Through systematic data collection and analysis, we quantify patterns, preferences, and market trends, offering a comprehensive view of the business landscape.
Our quantitative research approach employs diverse tools, including surveys, experiments, and statistical modelling. These methodologies enable us to gather data from a large and representative sample, ensuring the statistical significance of our findings. By employing structured questionnaires and standardized data collection methods, we guarantee the reliability and validity of the information we present to our clients.
Quantitative research is particularly effective in measuring the prevalence of trends, assessing market size, and gauging the impact of various factors on consumer behavior. The numerical precision attained through this approach equips our clients with actionable insights, facilitating data-driven decision-making and strategy formulation.


Our Specialized Toolbox for Industry-Specific Market Research
We deploy a specialized arsenal of techniques tailored to meet your unique requirements. Here's a glimpse into our comprehensive toolbox:

Information Procurement
The stage entails acquiring market data or relevant information through various sources and methodologies.


Market Research Approach
We utilize both top-down and bottom-up approaches in market research analysis to achieve a comprehensive understanding of the market dynamics, leveraging the broad perspective of industry trends and macroeconomic factors alongside detailed insights from specific segments and individual companies.

Porters Five Forces Analysis
We conduct Porter's Five Forces analysis to evaluate the competitive landscape of an industry, providing us with insights into factors that affect profitability and strategic positioning.

SWOT Analysis

Forecasting
We utilize a forecasting model to predict future consumption by considering parameters like population, economics, regulations, market competition, drivers, constraints, technology, and pricing. We also employ statistical techniques such as multilinear regression, exponential smoothing, moving average, ARIMA, and Monte Carlo simulations for accurate predictions. In econometric forecasting, we analyzed short-term and long-term event impacts, attributing values based on regulatory frameworks, economic factors, and market events.





 Speak to Our Analyst