Data Integration Services Market Global Industry Analysis and Forecast (2026–2035)

Data Integration Services Market size was USD 16.30 Billion in 2025, projected to reach USD 41.02 Billion by 2035, growing at a CAGR of 9.11% from 2026 to 2035. Key drivers include cloud and AI data readiness, real-time and event-driven architectures, and data sharing regulations, with North America leading the global market.

Download Free Sample PDF
Base Year (2025)
$16.30 Billion
Forecast (2035)
$41.02 Billion
CAGR (2026-2035)
9.1%
Top Region
North America

What Is the Data Integration Services Market Size?

The global Data Integration Services Market reached USD 16.30 Billion in 2025 and is estimated at USD 18.72 Billion in 2026, forecast to reach USD 41.02 Billion by 2035 at a CAGR of 9.11% between 2026 and 2035. North America leads with approximately 37% share in 2025, while Software Tools and Platforms dominates with about 58%.

We observed that buyers are reallocating budgets from isolated batch pipelines toward governed, real-time data products that feed analytics and AI workloads.

Data Integration Services Market Global Industry Analysis and Forecast (2026–2035) Revenue Forecast

Values in USD Billion

2025 $16.30 Billion
2025
2026 $18.72 Billion
2026
2027 $20.43 Billion
2027
2028 $22.29 Billion
2028
2029 $24.32 Billion
2029
2030 $26.53 Billion
2030
2031 $28.95 Billion
2031
2032 $31.59 Billion
2032
2033 $34.46 Billion
2033
2034 $37.60 Billion
2034
2035 $41.02 Billion
2035

Key Takeaways

By Offering: Software Tools and Platforms held the largest share, expanding from USD 9.45 Billion in 2025 to USD 22.97 Billion by 2035; Services is the fastest growing at 9.62% CAGR from 2026–2035.

By Integration Pattern: Batch Integration held the largest share, expanding from USD 6.52 Billion in 2025 to USD 12.31 Billion by 2035; Multi Pattern Integration is the fastest growing at 12.95% CAGR from 2026–2035.

By Deployment Model: Cloud held the largest share, expanding from USD 7.34 Billion in 2025 to USD 23.79 Billion by 2035; Cloud is also the fastest growing at 11.87% CAGR from 2026–2035.

By Organization Size: Large Enterprise held the largest share, expanding from USD 10.11 Billion in 2025 to USD 22.15 Billion by 2035; Small and Medium Business is the fastest growing at 11.53% CAGR from 2026–2035.

By Primary Contracting Buyer: IT and Enterprise Architecture held the largest share, expanding from USD 4.56 Billion in 2025 to USD 9.85 Billion by 2035; Line of Business is the fastest growing at 11.09% CAGR from 2026–2035.

By End User Industry: BFSI held the largest share, expanding from USD 3.91 Billion in 2025 to USD 9.03 Billion by 2035; Transportation and Logistics is the fastest growing at 11.49% CAGR from 2026–2035.

Dominant Region: North America held approximately 37% of 2025 revenue at USD 6.03 Billion, expanding to USD 13.74 Billion by 2035 at 8.02% CAGR.

Fastest-Growing Region: Asia-Pacific is the fastest growing at 11.70% CAGR from 2026–2035, rising from USD 4.24 Billion in 2025 to USD 13.54 Billion by 2035.

Dominant Country: The U.S. is the largest country market at USD 5.00 Billion in 2025, projected to reach USD 10.99 Billion by 2035.

Fastest-Growing Country: India is the fastest growing at 17.95% CAGR from 2026–2035, moving from USD 0.34 Billion in 2025 to USD 1.90 Billion by 2035.

The market presents an absolute investment opportunity of approximately USD 22.30 Billion between 2026 and 2035, which signals sustained capital demand for governed data movement, integration platforms and managed operations.

According to NMSC analysis, the sharpest value shift is toward multi-cloud deployments, expanding at a 14.89% CAGR from 2026 to 2035. This growth is driven by enterprise efforts to eliminate single-hyperscaler lock-in and position integration close to each data platform.

Ecosystem Analysis of the Data Integration Services Industry

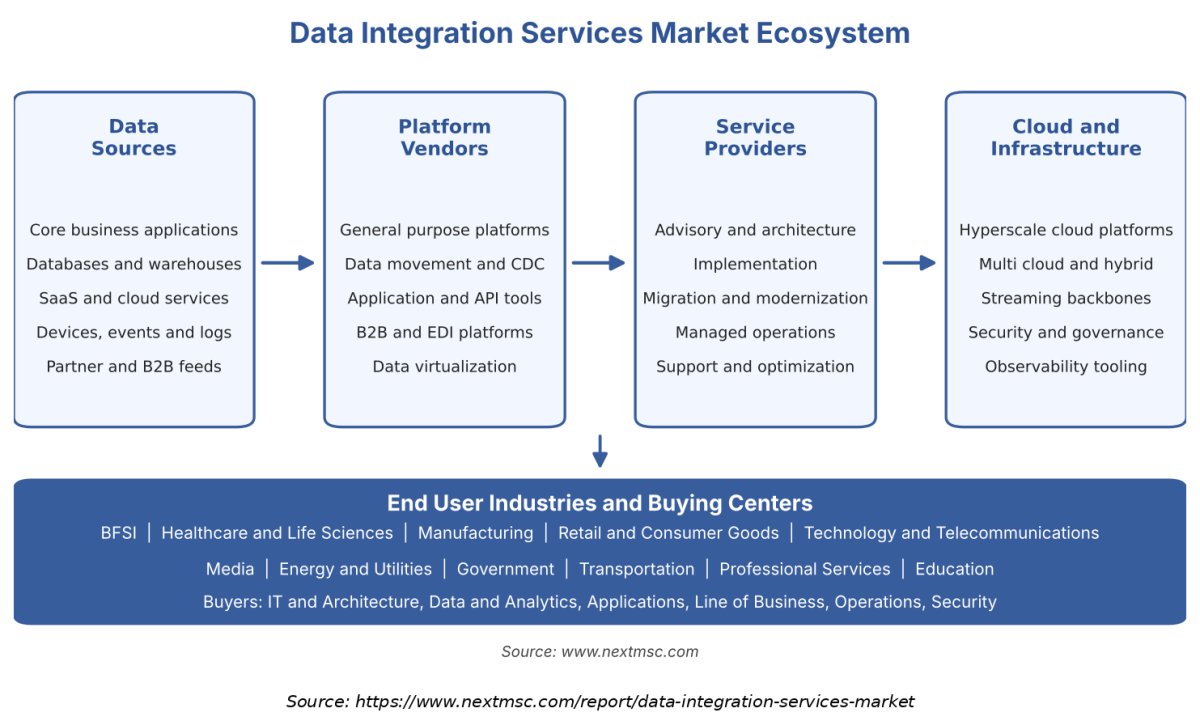
The infographic presents the market ecosystem by tracing data flows from sources through platform vendors, service providers, and cloud infrastructure to end-user industries. Platform vendors supply the engines and connectors, service providers design and operate pipelines, and hyperscale clouds host the compute and streaming backbones. Buying centers across IT, data, applications and operations then consume integrated data for analytics, AI and partner exchange.

What does the Data Integration Services Market Encompass?

The market covers software platforms and professional and managed services that move, transform, synchronize, virtualize and exchange data across applications, databases, clouds and trading partners. NMSC defines scope across two offering groups, from general purpose and data movement platforms to advisory, implementation and managed operations. Integration patterns include batch, real time, application, B2B, virtual and multi pattern approaches, and all values are sized in USD Billion for 2025 through 2035.

Market Drivers & Dynamics

Interactive Dataset
Enterprise AI and analytics workloads that require governed, unified data driver +1.8% Global, led by North America 2026–2035
Migration of integration workloads to cloud and multi cloud platforms driver +1.5% Global 2026–2032
Rising adoption of real time and event streaming pipelines driver +1.2% North America, Europe, Asia-Pacific 2026–2033
Data sharing and operational resilience rules such as the EU Data Act, DORA and CMS-0057-F driver +0.9% Europe, North America 2026–2029
Platform consolidation and bundled suites that simplify procurement driver +0.6% North America, Europe 2026–2030
Legacy system complexity and technical debt restraint −1.1% Global, acute in government and BFSI 2026–2035
Shortage of integration and data engineering talent restraint −0.9% Global 2026–2031
Data sovereignty and cross border transfer restrictions restraint −0.7% China, Europe, India, Middle East 2026–2035
Regulatory uncertainty, including the stay of US open banking compliance dates restraint −0.4% U.S. 2026–2028
Source: Next Move Strategy Consulting

Growth Drivers

What Is the Primary Growth Driver in the Data Integration Services Market?

Enterprise adoption of cloud computing and AI is the primary structural driver of the market. Eurostat reports that 52.74% of EU enterprises bought cloud services in 2025, up 7.42 percentage points from 2023, and 19.95% used at least one AI technology, up 6.47 points from 2024. In the United States, 19.8% of businesses reported AI use for the period ending 3 May 2026. Each new workload needs governed data feeds, which supports demand for platforms and services.

How Is Data Sharing Regulation Driving the Market Growth?

Data sharing and resilience rules are turning integration from an IT preference into a compliance requirement. The EU Data Act applies from 12 September 2025 and removes switching charges from 12 January 2027, so enterprises need portable and interoperable data flows. DORA has applied since 17 January 2025, and payer API obligations under CMS-0057-F generally begin on 1 January 2027. These dates create a predictable project pipeline for vendors and service providers in the Data Integration Services Market.

Growth Inhibitors

What Is Restraining the Data Integration Services Market?

Legacy system complexity and scarce skills restrain faster adoption. The US Government Accountability Office reviewed 69 legacy systems in July 2025. It found that 11 critical systems cost about USD 0.75 Billion a year to operate and maintain, while about 79% of planned IT spending at the 24 reviewed agencies went to operations and maintenance. Eurostat reports that ICT specialists made up 5.0% of EU employment in 2025, which limits delivery capacity. Mitigation relies on managed services and low code tooling.

What Are the Growth Opportunities?

Can Managed Integration Operations Capture Demand for Outsourced Pipeline Reliability?

Managed Services grows at 11.48% CAGR from 2026 to 2035, with Managed Integration Operations at 11.99%, because enterprises struggle to staff always on pipeline support. Providers that bundle managed cloud services such as monitoring, incident response and platform administration under outcome based contracts can convert project work into recurring revenue. Global system integrators and platform vendors with strong partner networks are the main beneficiaries in the market.

Does Mid Market and SMB Adoption of Cloud Integration Represent an Untapped Volume Opportunity?

Small and Medium Business grows at 11.53% CAGR and Mid Market at 10.94%, together rising from USD 6.19 Billion in 2025 to USD 18.87 Billion by 2035. Packaged connectors, usage based pricing and marketplace distribution lower entry costs for firms without dedicated data engineers. Vendors with self service tooling and partner led onboarding are best placed to capture this volume, while service providers can add value through templates and fixed price migrations.

Can Healthcare and Life Sciences Become a Premium Interoperability Vertical?

Healthcare and Life Sciences grows at 10.82% CAGR, reaching USD 5.75 Billion by 2035. US payer API requirements under CMS-0057-F generally apply from 1 January 2027, and ASTP reported that TEFCA exchanged 464 million documents by the end of 2025. Vendors that offer prebuilt FHIR connectors, consent controls and audit trails can command premium pricing, and providers, payers and healthcare IT suppliers are the main beneficiaries.

Segmentation Analysis

2025 (USD Billion)
2035 (USD Billion)
Software Tools and Platforms 2025: $9.45 Billion | 2035: $22.97 Billion
Software Too
Services 2025: $6.85 Billion | 2035: $18.05 Billion
Services
Software Tools and Platforms $9.45 Billion $22.97 Billion 8.72%
Services $6.85 Billion $18.05 Billion 9.62%

Which Offering Segment Dominates the Data Integration Services Market?

Software Tools and Platforms dominated in 2025 with USD 9.45 Billion, around 58% of revenue, led by General Purpose Integration Platforms at USD 2.84 Billion. Services is the faster growing group at 9.62% CAGR from 2026 to 2035, and Managed Services leads at 11.48% as enterprises outsource pipeline operations. Migration and Modernization grows at 10.45% as firms plan data migration to cloud, which supports the market.

2025 (USD Billion)
2035 (USD Billion)
Category A
Category B
Category C
Category D
Segment Item 2025 (USD Billion) 2035 (USD Billion) CAGR
Category A $10.0 USD Billion $40.0 USD Billion 25.0%
Category B $17.1 USD Billion $51.1 USD Billion 11.0%
Category C $24.2 USD Billion $62.2 USD Billion 25.0%
Category D $31.3 USD Billion $73.3 USD Billion 11.0%

Segment-wise data is locked

Unlock complete segment-wise numbers for By Integration Pattern.

Unlock Full Data
2025 (USD Billion)
2035 (USD Billion)
Category A
Category B
Category C
Category D
Segment Item 2025 (USD Billion) 2035 (USD Billion) CAGR
Category A $10.0 USD Billion $40.0 USD Billion 27.0%
Category B $17.1 USD Billion $51.1 USD Billion 9.0%
Category C $24.2 USD Billion $62.2 USD Billion 19.0%
Category D $31.3 USD Billion $73.3 USD Billion 17.0%

Segment-wise data is locked

Unlock complete segment-wise numbers for By Deployment Model.

Unlock Full Data
2025 (USD Billion)
2035 (USD Billion)
Category A
Category B
Category C
Category D
Segment Item 2025 (USD Billion) 2035 (USD Billion) CAGR
Category A $10.0 USD Billion $40.0 USD Billion 14.0%
Category B $17.1 USD Billion $51.1 USD Billion 24.0%
Category C $24.2 USD Billion $62.2 USD Billion 22.0%
Category D $31.3 USD Billion $73.3 USD Billion 12.0%

Segment-wise data is locked

Unlock complete segment-wise numbers for By Organization Size.

Unlock Full Data
2025 (USD Billion)
2035 (USD Billion)
Category A
Category B
Category C
Category D
Segment Item 2025 (USD Billion) 2035 (USD Billion) CAGR
Category A $10.0 USD Billion $40.0 USD Billion 24.0%
Category B $17.1 USD Billion $51.1 USD Billion 22.0%
Category C $24.2 USD Billion $62.2 USD Billion 20.0%
Category D $31.3 USD Billion $73.3 USD Billion 22.0%

Segment-wise data is locked

Unlock complete segment-wise numbers for By Primary Contracting Buyer.

Unlock Full Data
2025 (USD Billion)
2035 (USD Billion)
Category A
Category B
Category C
Category D
Segment Item 2025 (USD Billion) 2035 (USD Billion) CAGR
Category A $10.0 USD Billion $40.0 USD Billion 23.0%
Category B $17.1 USD Billion $51.1 USD Billion 9.0%
Category C $24.2 USD Billion $62.2 USD Billion 19.0%
Category D $31.3 USD Billion $73.3 USD Billion 13.0%

Segment-wise data is locked

Unlock complete segment-wise numbers for By End User Industry.

Unlock Full Data
2025 (USD Billion)
2035 (USD Billion)
Category A
Category B
Category C
Category D
Segment Item 2025 (USD Billion) 2035 (USD Billion) CAGR
Category A $10.0 USD Billion $40.0 USD Billion 21.0%
Category B $17.1 USD Billion $51.1 USD Billion 23.0%
Category C $24.2 USD Billion $62.2 USD Billion 25.0%
Category D $31.3 USD Billion $73.3 USD Billion 15.0%

Segment-wise data is locked

Unlock complete segment-wise numbers for By Region.

Unlock Full Data

Supply Chain Analysis of the Data Integration Services Industry

Supply Chain Analysis of the Data Integration Services Industry
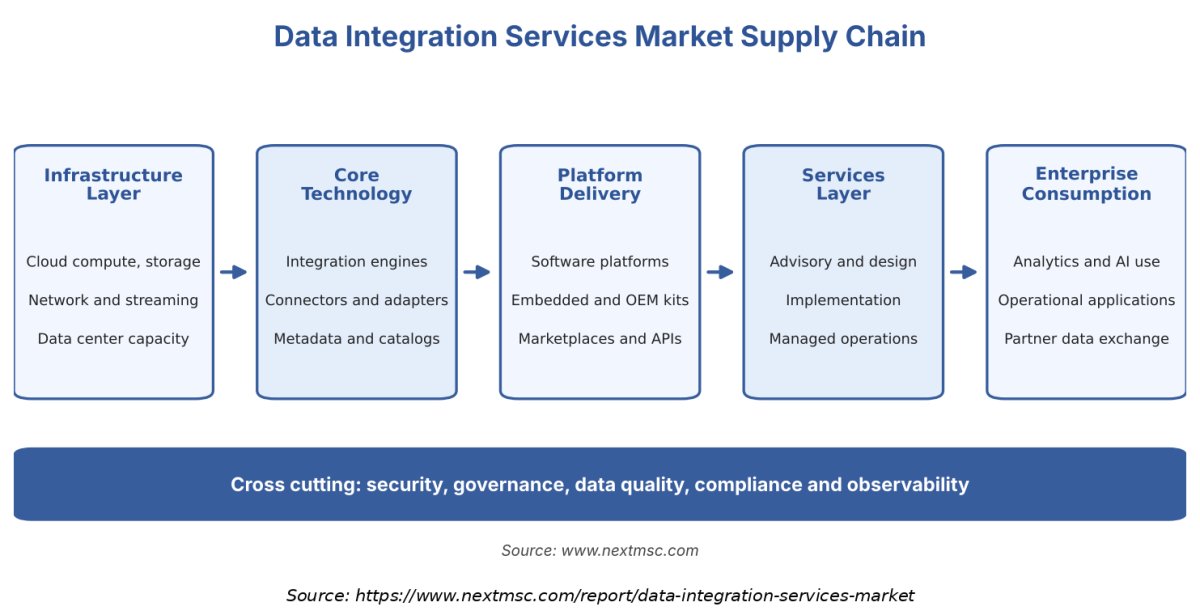
The above infographic maps the market supply chain from infrastructure, core technology and platform delivery to services and enterprise consumption. Cloud and streaming infrastructure sit upstream, integration engines and connectors form the technology core, and platforms reach buyers through direct sales, marketplaces and embedded modules. Service providers then implement and operate the flows, while governance, security and observability run across every stage and decide how reliably data reaches analytics and AI workloads.

Growth Opportunities

Our analysis shows that three whitespace opportunities are positioned to generate outsized returns through 2035.

Can Managed Integration Operations Capture Demand for Outsourced Pipeline Reliability?

Managed Services grows at 11.48% CAGR from 2026 to 2035, with Managed Integration Operations at 11.99%, because enterprises struggle to staff always on pipeline support. Providers that bundle managed cloud services such as monitoring, incident response and platform administration under outcome based contracts can convert project work into recurring revenue. Global system integrators and platform vendors with strong partner networks are the main beneficiaries in the market.

Does Mid Market and SMB Adoption of Cloud Integration Represent an Untapped Volume Opportunity?

Small and Medium Business grows at 11.53% CAGR and Mid Market at 10.94%, together rising from USD 6.19 Billion in 2025 to USD 18.87 Billion by 2035. Packaged connectors, usage based pricing and marketplace distribution lower entry costs for firms without dedicated data engineers. Vendors with self service tooling and partner led onboarding are best placed to capture this volume, while service providers can add value through templates and fixed price migrations.

Can Healthcare and Life Sciences Become a Premium Interoperability Vertical?

Healthcare and Life Sciences grows at 10.82% CAGR, reaching USD 5.75 Billion by 2035. US payer API requirements under CMS-0057-F generally apply from 1 January 2027, and ASTP reported that TEFCA exchanged 464 million documents by the end of 2025. Vendors that offer prebuilt FHIR connectors, consent controls and audit trails can command premium pricing, and providers, payers and healthcare IT suppliers are the main beneficiaries.

Regional Outlook

2025 (USD Billion)
2035 (USD Billion)
North Americ
Asia-Pacific
Europe
Middle East
Latin Americ
Region 2025 (USD Billion) 2035 (USD Billion) CAGR (%)
North America $10.0 USD Billion $40.0 USD Billion 9.0%
Asia-Pacific $17.1 USD Billion $51.1 USD Billion 27.0%
Europe $24.2 USD Billion $62.2 USD Billion 25.0%
Middle East & Africa $31.3 USD Billion $73.3 USD Billion 23.0%
Latin America $38.4 USD Billion $84.4 USD Billion 12.0%

Regional data is locked

Unlock complete regional numbers for this market.

Unlock Full Data

Competitive Landscape

Our assessment indicates that the market combines hyperscale platform owners, specialist integration vendors and global service providers.

How Do Companies Compete in the Data Integration Services Market?

Companies compete on connector breadth, governance depth, total cost of ownership and the ability to run across multiple clouds. Hyperscalers bundle integration into data platforms, while specialist vendors win on neutrality and depth of source coverage. Service providers compete on delivery capacity, industry templates and managed operations. We observed that pricing is moving from fixed licenses toward consumption based models, which favors vendors with transparent usage metering and strong partner ecosystems across the Data Integration Services Market.

Which Competitive Archetypes Dominate the Data Integration Services Market?

Three archetypes dominate. Cloud and software platform owners such as Microsoft, Amazon, Oracle, IBM and SAP embed integration in broader data estates. Specialist vendors including Informatica, Qlik, Boomi, Fivetran, Denodo and Precisely differentiate through neutrality, data quality and breadth of connectors. Global service providers including Accenture, Tata Consultancy Services, Capgemini, Cognizant, Infosys, HCL Technologies, Wipro, NTT DATA and Kyndryl differentiate through delivery scale, industry knowledge and managed operations.

What Innovation and Differentiation Strategies Are Companies Pursuing?

Vendors are differentiating through agent ready connectivity, zero copy and zero ETL access, and open table format support within a data fabric style architecture. Denodo added Model Context Protocol support in Platform 9.4, Precisely launched a Data Integration Agent in May 2026, and Oracle made its AI Data Platform generally available in October 2025. Based on research conducted by NMSC, these launches show that governance and AI readiness now matter more than raw connector counts in the market.

What M&A and Partnership Activity Is Shaping the Market?

Consolidation accelerated between late 2025 and mid-2026. Platform consolidation accelerated between late 2025 and mid-2026. Salesforce completed its Informatica acquisition on 18 November 2025, followed by IBM completing its Confluent purchase on 17 March 2026. Additionally, SAP acquired Reltio on 7 May 2026, while Fivetran and dbt Labs merged on 1 June 2026. Accenture also acquired Keepler in April 2026 to strengthen data and AI delivery in Spain. Our findings suggest that buyers should expect fewer, broader platforms and more partner led delivery.

Key Market Players

Based on research conducted by NMSC, the following 20 companies represent the validated leadership set across platforms and services in this market.

International Business Machines Corporation Microsoft Corporation Oracle Corporation SAP SE Amazon.com, Inc. Informatica Inc. QlikTech International AB Accenture plc Tata Consultancy Services Limited Capgemini SE Cognizant Technology Solutions Corporation Infosys Limited HCL Technologies Limited Wipro Limited NTT DATA Group Corporation Boomi, LP Kyndryl Holdings, Inc. Fivetran, Inc. Denodo Technologies, Inc. Precisely Software Incorporated

Latest Developments

During our market evaluation, we noticed that platform consolidation and agent ready data products dominated strategic activity from October 2025 to June 2026.

Date Event
June 2026 Fivetran and dbt Labs completed their all-stock merger to establish an open data infrastructure company for AI applications. The companies also released the dbt Core 2.0 alpha under the Apache 2.0 license, built on shared foundations with the Fusion engine and incorporating newly open-sourced Fusion code.
May 2026 Boomi signed a letter of intent to acquire Lunar.dev, a provider of AI and Model Context Protocol (MCP) gateways, to strengthen enterprise governance, security, and connectivity for AI agents across business systems.
May 2026 SAP completed its acquisition of Reltio, a master data management provider, to strengthen SAP Business Data Cloud and improve enterprise data unification and AI readiness. Reltio's portfolio remains available as a standalone offering.
May 2026 Precisely expanded its Data Integrity Suite with a Data Integration Agent, a Data Product Marketplace, enhanced APIs, and a hosted MCP server to help enterprises deliver trusted, governed data for AI and analytics workloads.

Expert Insights

Steve Lucas

Steve Lucas

Chairman & CEO | Boomi

"These large language models will produce output that is 100% dependent on the data that you fed them. Data quality is the No. 1 challenge when it comes to AI ROI."

Analyst Interpretation

Lucas's observation emphasizes that data integration services increasingly need to address data quality alongside connectivity and transformation. Inconsistent, duplicated, or incomplete information can undermine analytics and AI-generated outputs even when organizations use advanced models. Consequently, enterprises are seeking integrated solutions that combine data ingestion, cleansing, transformation, validation, and governance. This trend strengthens opportunities for service providers offering data quality assessments, master data management, integration architecture consulting, and AI-ready data preparation.

Investment Opportunities

Where Are Capital Inflows Concentrating in the Data Integration Services Market?

Capital is concentrating in consolidation and platform expansion. IBM announced a USD 11 Billion agreement to acquire Confluent on 8 December 2025, and Fivetran and dbt Labs expected about USD 0.60 Billion of combined recurring revenue when they agreed to merge in October 2025. Capital inflows should prioritize real-time streaming, managed services, and virtualization platforms. These segments project to grow at 13.24%, 11.48%, and 11.13% CAGRs, respectively, between 2026 and 2035.

How Is Infrastructure Investment Shaping Market Capacity?

Integration workloads depend on cloud, network and datacenters. The International Energy Agency estimates that data centers used about 415 TWh of electricity in 2024 and projects about 945 TWh by 2030, while the ITU estimates that about 6 billion people were online in 2025. These trends expand data volumes and processing demand, which supports investment in multi cloud connectivity, streaming backbones and observability tooling.

What ESG Considerations Are Influencing Market Investment?

Environmental, social and governance considerations center on energy efficient data movement, privacy by design and transparent lineage. Zero copy and mirrored access reduce redundant data copies, which lowers storage and compute use. Governance features support compliance with the EU Data Act, DORA and national privacy laws, while access controls protect personal data. Investors increasingly screen vendors for auditability, which links ESG performance to purchasing decisions in the market.

Key Benefits for Stakeholders

How Does This Report Benefit Enterprise Leaders and Data Teams?

Enterprise leaders gain a reconciled forecast growing from USD 16.30 Billion in 2025 to USD 41.02 Billion by 2035. Granular segment and regional data empower decision-making across platform, pattern, and deployment strategies. The analysis shows where Cloud grows at 11.87% and where On Premises grows at only 2.29%, helping teams sequence migrations, negotiate contracts and plan managed service scope across the Data Integration Services Market.

How Does This Report Benefit Investors and Financial Analysts?

Investors and analysts gain a forecast of USD 22.30 Billion in absolute growth between 2026 and 2035, a 9.11% CAGR, and growth rankings across offerings, patterns, industries and 15 countries. The report identifies fast growing pockets such as Multi Cloud at 14.89% and India at 17.95%, alongside the consolidation activity that signals valuation and exit pathways in the market.

How Does This Report Benefit Technology Vendors and Service Providers?

Platform vendors, system integrators and managed service providers gain visibility into which segments, buyers and regions are expanding fastest. Product teams can align roadmaps with Event Streaming at 13.24% and Data Virtualization Platforms at 11.13%, while service leaders can size Managed Services at USD 6.86 Billion by 2035. Competitive and partnership analysis supports pricing, packaging and go to market decisions.

Key Market Segments Evaluated

By Offering

  • Software Tools and Platforms 
    • General-Purpose Integration Platforms
    • Data Movement Platforms
    • Application Integration Platforms
    • B2B Integration Platforms
    • Data Virtualization Platforms
    • Other Data Integration Software
  • Services 
    • Professional Services
      • Advisory and Architecture
      • Implementation and Integration
      • Migration and Modernization
      • Support and Optimization
    • Managed Services
      • Managed Integration Operations
      • Managed Platform Administration
      • Managed Incident Management

By Integration Pattern

  • Batch Integration 
    • Extract, Transform and Load
    • Extract, Load and Transform
  • Real Time Integration 
    • Change Data Capture and Replication
    • Event Streaming
  • Application Integration 
    • Application Synchronization
    • API Integration
  • B2B Integration 
    • Electronic Data Interchange
    • Other B2B Exchange
  • Virtual and Federated Integration
  • Multi Pattern Integration

By Deployment Model

  • On Premises
  • Cloud 
    • Single Cloud
    • Multi Cloud
  • Hybrid 
    • Single Cloud Hybrid
    • Multi Cloud Hybrid

By Organization Size

  • Large Enterprise
  • Mid Market
  • Small and Medium Business

By Primary Contracting Buyer

  • IT and Enterprise Architecture
  • Data and Analytics
  • Applications and Integration
  • Line of Business
  • Operations and Supply Chain
  • Security and Compliance

By End User Industry

  • BFSI
  • Healthcare and Life Sciences
  • Manufacturing
  • Retail and Consumer Goods
  • Technology and Telecommunications
  • Media and Entertainment
  • Energy and Utilities
  • Government and Public Sector
  • Transportation and Logistics
  • Professional Services
  • Education
  • Other Industries

By Region

  • North America 
    • U.S.
    • Canada
    • Mexico
  • Europe 
    • UK
    • Germany
    • France
    • Italy
    • Spain
    • Sweden
    • Denmark
    • Finland
    • Netherlands
    • Rest of Europe
  • Asia-Pacific 
    • China
    • India
    • Japan
    • South Korea
    • Taiwan
    • Indonesia
    • Vietnam
    • Australia
    • Philippines
    • Malaysia
    • Rest of APAC
  • Middle East & Africa 
    • Saudi Arabia
    • UAE
    • Egypt
    • Israel
    • Turkey
    • Nigeria
    • South Africa
    • Rest of MEA
  • Latin America 
    • Brazil
    • Argentina
    • Chile
    • Colombia
    • Rest of LATAM

Conclusion & Recommendations

What Is the Long-Term Outlook for the Data Integration Services Market?

The long term outlook is positive, with revenue expanding from USD 16.30 Billion in 2025 to USD 41.02 Billion by 2035 at a 9.11% CAGR from 2026. Cloud adoption, real-time demand, and AI-driven initiatives outweigh legacy and talent constraints as enterprise budgets shift toward governed data architectures. APAC emerges as the fastest growing region at 11.70%, while North America remains the largest at USD 13.74 Billion in 2035.

What Strategic Positioning Recommendations Does NMSC Offer?

Vendors should prioritize open standards, agent ready connectivity and consumption pricing, and should embed governance and observability rather than sell them separately. Service providers should build managed operations around Event Streaming and Change Data Capture and Replication, and should package migrations for Mid Market and Small and Medium Business buyers. Both groups should invest in healthcare, BFSI and logistics templates, where compliance duties or growth rates are highest.

How Strong Is the Investment Attractiveness of the Data Integration Services Market?

Investment attractiveness is high, supported by an absolute opportunity of USD 22.30 Billion between 2026 and 2035 and a steady 9.11% CAGR. Completed transactions in 2025 and 2026, including IBM and Confluent and Salesforce and Informatica, show strategic appetite for data infrastructure. Managed Services, Event Streaming and Multi Cloud offer the strongest growth, while On Premises offers little upside at 2.29%.

What Are the Market Shifts and Key Risks in the Data Integration Services Market?

Key shifts include the move from batch to real time patterns, from point tools to platforms, and from custom pipelines to zero ETL access. Primary risks stem from legacy system complexity and scarce ICT talent. Architecture fragmentation due to data sovereignty rules and regulatory uncertainty around US open banking compliance timelines also present hurdles. Vendors that address these risks through managed services and open standards are better positioned.

What Are the Primary Growth Pathways Through 2035?

Primary pathways include Multi Cloud expansion at 14.89% CAGR, Real Time Integration at 12.48% and Managed Services at 11.48%. Geographic pathways run through APAC, especially India at 17.95% and China at 12.07%. Vertical pathways run through Healthcare and Life Sciences at 10.82% and Transportation and Logistics at 11.49%, supported by interoperability rules and supply chain data exchange programs.

FAQs

Sources & References

1.

Eurostat, Cloud computing statistics on the use by enterprises

ec.europa.eu
2.

Eurostat, Use of artificial intelligence in enterprises

ec.europa.eu
3.

Eurostat, ICT specialists in employment

ec.europa.eu
4.

US Census Bureau, AI use by businesses (2026)

census.gov
5.

European Commission, Data Act

digital-strategy.ec.europa.eu/policies/data-act
6.

European Commission, Data Act explained

digital-strategy.ec.europa.eu
7.

EIOPA, Digital Operational Resilience Act

eiopa.europa.eu
8.

CMS, Interoperability and Prior Authorization Final Rule (CMS-0057-F)

cms.gov
9.

ASTP/ONC, TEFCA history and growth

healthit.gov
10.

Consumer Financial Protection Bureau, Personal Financial Data Rights

consumerfinance.gov
11.

US Government Accountability Office, GAO-25-107795

files.gao.gov
12.

International Energy Agency, Energy demand from AI

iea.org
13.

International Telecommunication Union, Facts and Figures 2025

itu.int
14.

Office of Management and Budget, Memorandum M-25-21

whitehouse.gov
15.

Statistics Canada, Analysis in Brief 11-621-M2025008

www150.statcan.gc.ca
16.

UK Government, Data (Use and Access) Act 2025 commencement

gov.uk
17.

Destatis, Press release No. 416 of 24 November 2025

destatis.de
18.

ANSSI, Cloud and SecNumCloud

cyber.gouv.fr
19.

State Council of China, Provisions on cross border data flows

english.www.gov.cn
20.

Press Information Bureau India, Digital Personal Data Protection Rules

pib.gov.in
21.

Personal Information Protection Commission Japan

ppc.go.jp/en
22.

Digital Agency Japan, Data Free Flow with Trust

digital.go.jp
23.

Personal Information Protection Commission Korea, Laws and regulations

pipc.go.kr
24.

Federal Register of Legislation Australia, Privacy and Other Legislation Amendment Act 2024

legislation.gov.au
25.

UAE Government, Data protection laws

u.ae
26.

Saudi National Portal, Legal and regulatory framework

my.gov.sa
27.

The Presidency of South Africa, Commencement of POPIA sections

thepresidency.gov.za
28.

Presidency of Brazil, Lei 13.709 of 2018

planalto.gov.br
29.

Argentina AAIP, Personal data

argentina.gob.ar
30.

IBM Newsroom, IBM to acquire Confluent

newsroom.ibm.com
31.

IBM Newsroom, IBM completes acquisition of Confluent

newsroom.ibm.com
32.

Salesforce, Salesforce completes acquisition of Informatica

salesforce.com
33.

Business Wire, Fivetran and dbt Labs unite to set the standard for open data infrastructure

businesswire.com
34.

Fivetran, Fivetran and dbt Labs complete merger

fivetran.com
35.

SAP News Center, SAP completes acquisition of Reltio

news.sap.com
36.

Microsoft Azure Blog, Microsoft databases and Microsoft Fabric

azure.microsoft.com
37.

AWS, AWS Glue zero ETL integrations into Amazon S3 Tables

aws.amazon.com
38.

Qlik, Qlik Open Lakehouse now generally available

qlik.com
39.

Denodo, Denodo Platform 9.4 release

globenewswire.com
40.

Precisely, Precisely advances agentic ready data

precisely.com
41.

Oracle, Oracle AI Data Platform at AI World

oracle.com
42.

Boomi, Lunar.dev letter of intent

boomi.com
43.

Accenture Newsroom, Accenture acquires Keepler

newsroom.accenture.com

About the Author

Mayurima Roy

Mayurima Roy

Mayurima Roy is Research Analyst at Next Move Strategy Consulting, where she has spent 4 years working across the firm's full industry coverage rather than a single fixed vertical. Her work centers on structured research, ongoing trend tracking, competitive assessment, and insight-led content development, translating complex market data into clear, decision-ready narratives that support informed client decision-making across diverse global industries, market sectors, and world regions every day.

About the Reviewer

Supradip Baul

Supradip Baul

Supradip Baul is an accomplished business consultant and strategist with over a decade of rich experience in market intelligence, strategy, technology, and business transformation. His work has included rigorous qualitative and quantitative analysis across multiple industries, helping clients shape investment decisions and long-term roadmaps. Earlier in his career, he was associated with Gartner, where he contributed to industry-leading reports and market share analyses. He has worked with leading global companies and holds an MBA with a dual specialization in Marketing and Finance.

Download Free Sample

Pratyush Kumar Das

PRATYUSH KUMAR DAS

Assistant Manager

Polycab India Limited

We would like to express our appreciation for the data and insights provided by nextmsc. We are very pleased with the quality and depth of the information, which has proven to be highly valuable and beneficial for our business decision-making.

Gustaf Hummel Burstrom

GUSTAF HUMMEL BURSTROM

Founder

Revline Tools AB

Joseph and the team at Next Move Strategy Consulting have been excellent to work with, in supplying us with relevant market data and forecasts for our specific category. We had some special requirements and they were able to do a custom package to suit our needs. We would definitely recommend them to any other company needing market data and forecasts

Melanie Samko

MELANIE SAMKO

Director of Marketing

TOSOH BIOSCIENCE, INC.

The information provided by NMSC is incredibly valuable, thank you so much for such a excellent work. I really appreciate it. I will make sure to reference all of it, in my summary document.

Henri Knyphausen

HENRI KNYPHAUSEN

Partner at Singulier [Ex-BCG]

Singulier

I recently engaged NEXTMSC.com for a commercial due diligence project within the intralogistics sector, and I am pleased to provide a reference based on my experience. In utilizing NEXTMSC.com's services, I found their report to offer valuable insights into market dynamics and key industry players. The initial report provided a solid foundation for our analysis. However, as we were investigating a smaller target in the market, and I had specific customization requests requiring additional research. These requests included detailed information on product portfolios of various players and sub-market sizes, both inclusive and exclusive of certain product categories. NEXTMSC.com demonstrated commendable responsiveness and agility in accommodating these customization requests. Within a timeframe of 1-2 weeks, they delivered a revised report that met our specific needs. Furthermore, they were receptive to my follow-up inquiries, ensuring clarity and understanding of the data provided. The final deliverable significantly contributed to our due diligence efforts. One of NEXTMSC.com's notable strengths lies in their qualitative research capabilities. However, for future engagements, I would recommend the inclusion of a quantified market model in Excel format. Such a model would offer the ability to conduct in-depth analyses and explore various market segments, including country-specific data and subcomponent breakdowns. Based on my positive experience, I would not hesitate to work with NEXTMSC.com again. Their responsiveness, willingness to accommodate customization requests, and commitment to delivering actionable insights make them a reliable partner for commercial research projects.

Amos Chang

AMOS CHANG

Strategy Consultant

Kardex Group

I have bought the intralogistics market reports from NMSC two times so far. Joseph and his team are always very helpful and flexible in responding to any customization requirements on the report. Their expertise in market reports really helps us steer the day-to-day business. I will definitely recommend and come back myself whenever there is a need.

Custom Market Research Services

We will customize the research for you if the listed report does not fully match your requirements.

Get 30% Free Customization

Select License

This website uses cookies to ensure you get the best experience on our website. Learn more

✖